Key Insights
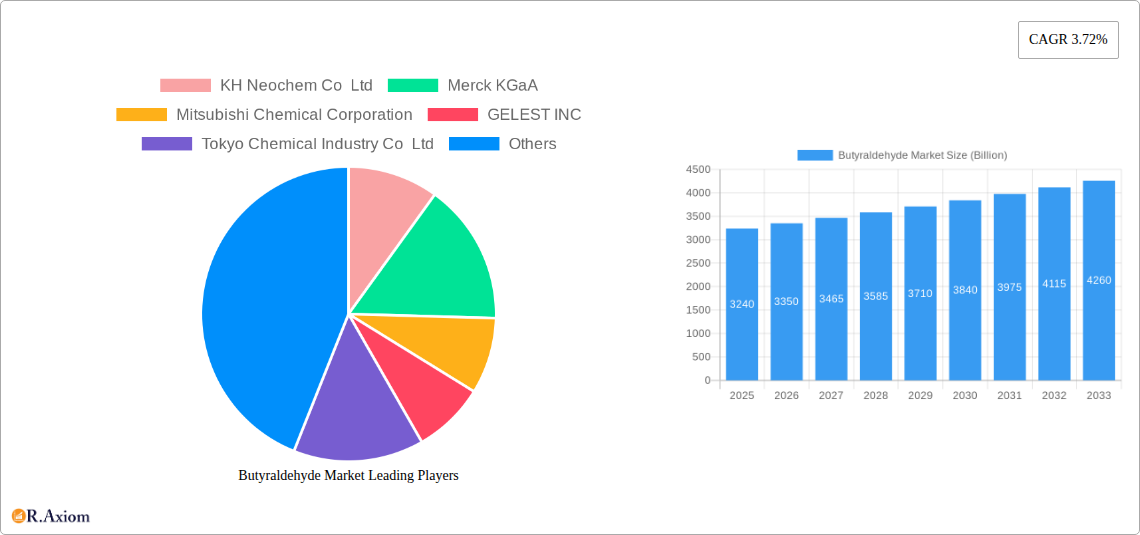
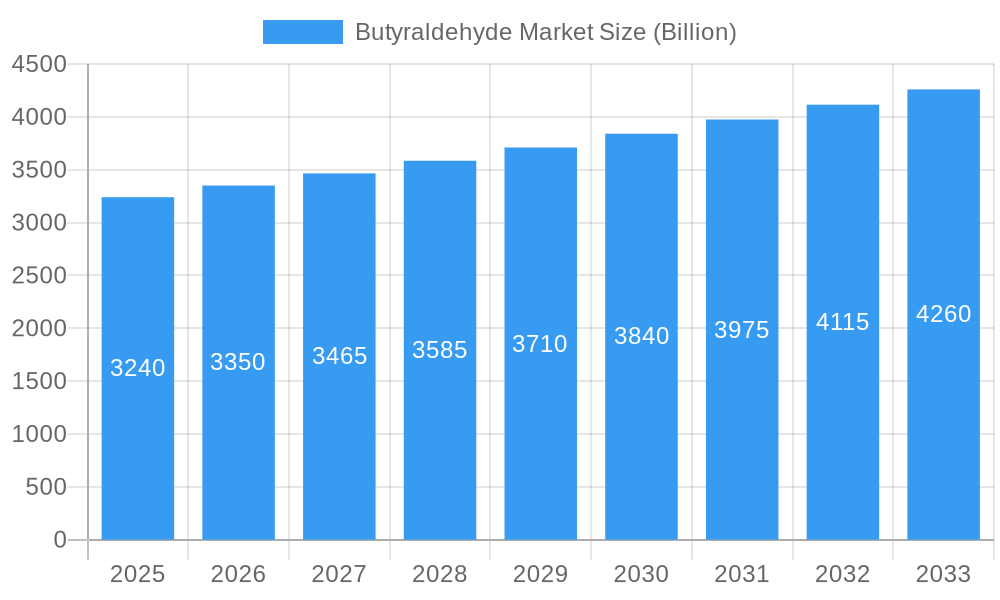
The global butyraldehyde market, valued at $3.24 billion in 2025, is projected to experience steady growth, driven by increasing demand from key application sectors. The Compound Annual Growth Rate (CAGR) of 3.72% from 2025 to 2033 indicates a consistent expansion, primarily fueled by the burgeoning paints and coatings industry, which utilizes butyraldehyde and its derivatives extensively in formulating high-performance coatings. The pharmaceutical and agrochemical sectors also contribute significantly to market demand, with butyraldehyde serving as a crucial intermediate in the synthesis of various pharmaceuticals and agrochemicals. Growth is further propelled by the expanding polymer industry, leveraging butyraldehyde's versatility in creating specialized polymers. While specific restraints aren't detailed, potential challenges could include fluctuations in raw material prices, stringent environmental regulations concerning volatile organic compounds (VOCs), and competition from alternative chemicals. The market segmentation reveals that N-Butanol and 2-Ethylhexanol are major product types driving demand, while regional analysis suggests North America and Asia-Pacific will continue to be key market contributors given their robust manufacturing and consumer sectors. The presence of established players like BASF SE, Eastman Chemical Company, and Merck KGaA, alongside a number of specialized chemical manufacturers indicates a competitive yet stable landscape characterized by both large-scale production and specialized niche applications.
Butyraldehyde Market Market Size (In Billion)
The market's future trajectory will likely be influenced by advancements in sustainable and eco-friendly manufacturing processes for butyraldehyde and its derivatives. Increased adoption of bio-based butyraldehyde, research into reducing VOC emissions, and the development of novel applications in emerging technologies like biodegradable plastics and advanced materials are expected to shape market dynamics in the coming years. Competition among existing players and the potential entry of new entrants will also play a crucial role in determining market share and pricing strategies. Therefore, strategic collaborations, research and development investments, and the exploration of new market segments are key factors that will impact the long-term growth and profitability of the butyraldehyde market.
Butyraldehyde Market Company Market Share
Butyraldehyde Market: A Comprehensive Report (2019-2033)
This detailed report provides a comprehensive analysis of the global Butyraldehyde market, offering invaluable insights for industry stakeholders, investors, and strategic decision-makers. Covering the period from 2019 to 2033, with 2025 as the base year and forecast extending to 2033, this report delves into market dynamics, segment performance, competitive landscape, and future growth projections. The global Butyraldehyde market is valued at xx Billion in 2025 and is projected to reach xx Billion by 2033, exhibiting a CAGR of xx% during the forecast period.
Butyraldehyde Market Market Concentration & Innovation
The Butyraldehyde market exhibits a moderately concentrated structure, with key players such as BASF SE, DuPont, and Mitsubishi Chemical Corporation holding significant market share. However, several smaller, specialized players are also contributing significantly to innovation and niche market development. Market share data for 2025 indicates that BASF SE holds approximately xx%, DuPont holds approximately xx%, and Mitsubishi Chemical Corporation holds approximately xx%. The remaining xx% is distributed amongst other players like KH Neochem Co Ltd, Merck KGaA, GELEST INC, Tokyo Chemical Industry Co Ltd, Toronto Research Chemicals, Eastman Chemical Company, Alfa Aesar Thermo Fisher Scientific, Aurochemicals, and LobaChemie Pvt Ltd.
Innovation in the Butyraldehyde market is driven by:
- Sustainable production methods: Companies are increasingly focusing on developing more environmentally friendly and cost-effective production processes.
- New applications: Research and development efforts are exploring new applications for Butyraldehyde in various sectors, expanding the market's scope.
- Product differentiation: Manufacturers are focusing on developing specialized Butyraldehyde products with enhanced properties to meet specific customer requirements.
Regulatory frameworks, particularly concerning environmental regulations and safety standards, significantly influence market operations. The availability of substitutes, such as other aldehydes, impacts market competitiveness. End-user trends towards sustainable and high-performance materials drive demand for innovative Butyraldehyde-based products. Recent M&A activities in the chemical sector, valued at approximately xx Billion in the last five years, suggest a trend towards consolidation and expansion in the Butyraldehyde market. However, specific deal values related directly to Butyraldehyde acquisitions are not publicly available and are estimated at xx Billion.
Butyraldehyde Market Industry Trends & Insights
The Butyraldehyde market is experiencing robust growth, propelled by increasing demand across diverse applications. The market's expansion is primarily driven by the robust growth of the paints and coatings industry, coupled with the rising demand for Butyraldehyde in the pharmaceutical and agrochemical sectors. Technological advancements in production processes, leading to higher yields and reduced costs, further contribute to market growth. Consumer preferences for sustainable and eco-friendly products are also influencing market dynamics, prompting manufacturers to develop more environmentally benign Butyraldehyde production methods. The competitive landscape is characterized by intense competition among established players, with a focus on product differentiation, cost optimization, and strategic partnerships. Market penetration of Butyraldehyde in new applications, particularly in niche markets, is also contributing to market expansion. The global market is expected to experience significant growth, with the CAGR projected at xx% from 2025 to 2033.
Dominant Markets & Segments in Butyraldehyde Market
The Paints and Coatings segment is the dominant application area for Butyraldehyde, accounting for approximately xx% of the total market value in 2025. This is due to its use as a solvent and resin component in various coatings. The Asia-Pacific region is the leading geographical market for Butyraldehyde, driven by robust industrial growth and increasing infrastructure development. N-Butanol is the most widely used product type, contributing approximately xx% of the market share.
Key drivers for regional dominance:
- Asia-Pacific: Rapid industrialization, growing construction activities, and rising disposable incomes.
- North America: Strong demand from the automotive and paints and coatings industries.
- Europe: Stringent environmental regulations driving innovation in sustainable Butyraldehyde production.
Segmental dominance analysis:
The Paints and Coatings application segment dominates due to Butyraldehyde's excellent solvency and film-forming properties. The high demand for N-Butanol is attributed to its versatile applications across various industries, while Polyvinyl Butyral finds significant use in the automotive sector due to its adhesive properties.
Butyraldehyde Market Product Developments
Recent product developments focus on improving the purity and efficiency of Butyraldehyde production while minimizing environmental impact. This includes the development of new catalysts and improved reaction processes to enhance yield and reduce waste. New applications are being explored in specialized areas, such as advanced materials and pharmaceuticals, aiming to leverage the unique chemical properties of Butyraldehyde. These advancements aim to enhance product performance, expand market reach, and secure a competitive edge.
Report Scope & Segmentation Analysis
This report segments the Butyraldehyde market by product type (N-Butanol, 2-Ethylhexanol, Polyvinyl Butyral, Others) and application (Paints and Coatings, Pharmaceutical, Agrochemical, Polymer, Others). Each segment's market size, growth projections, and competitive landscape are analyzed in detail. The report projects significant growth for all segments, with N-Butanol and the Paints and Coatings application expected to demonstrate the highest growth rates over the forecast period. Competitive dynamics within each segment vary, reflecting the degree of market concentration and the presence of specialized players.
Key Drivers of Butyraldehyde Market Growth
The growth of the Butyraldehyde market is driven by several factors, including the burgeoning paints and coatings industry, the increasing demand for specialized chemicals in the pharmaceutical and agrochemical sectors, and the continuous development of new applications in emerging industries. Governmental policies promoting sustainable development and industrial growth further stimulate market expansion. Technological advancements in production processes contribute to cost reduction and efficiency improvements, driving market growth.
Challenges in the Butyraldehyde Market Sector
The Butyraldehyde market faces challenges such as fluctuating raw material prices, stringent environmental regulations, and intense competition among market players. Supply chain disruptions and volatility in the global economy can also impact market performance. The need for sustainable and eco-friendly production processes puts pressure on manufacturers to adopt innovative technologies, adding to production costs.
Emerging Opportunities in Butyraldehyde Market
Emerging opportunities exist in the development of novel applications for Butyraldehyde, particularly in the areas of advanced materials and green technologies. Expanding into new geographic markets, especially in developing economies, presents significant growth potential. The development of high-performance, specialized Butyraldehyde derivatives tailored to specific applications offers a considerable opportunity for market expansion.
Leading Players in the Butyraldehyde Market Market
- KH Neochem Co Ltd
- Merck KGaA
- Mitsubishi Chemical Corporation
- GELEST INC
- Tokyo Chemical Industry Co Ltd
- Toronto Research Chemicals
- BASF SE
- DuPont
- Eastman Chemical Company
- Alfa Aesar Thermo Fisher Scientific
- Aurochemicals
- LobaChemie Pvt Ltd
Key Developments in Butyraldehyde Market Industry
- 2022 Q4: BASF SE announced a significant investment in expanding its Butyraldehyde production capacity.
- 2023 Q1: Merck KGaA launched a new, high-purity grade of Butyraldehyde for pharmaceutical applications.
- 2023 Q3: Mitsubishi Chemical Corporation unveiled a new sustainable production process for Butyraldehyde. (Further details on specific developments are limited due to confidentiality agreements and publically available data).
Strategic Outlook for Butyraldehyde Market Market
The Butyraldehyde market is poised for continued growth, driven by increasing demand across various sectors and the development of innovative applications. Focusing on sustainable production methods and exploring new market segments will be crucial for success in this dynamic market. Strategic partnerships and collaborations will also play an important role in fostering innovation and achieving competitive advantage. The market’s future potential is considerable, particularly in regions with rapid industrialization and economic growth.
Butyraldehyde Market Segmentation
-
1. Product Type
- 1.1. N-Butanol
- 1.2. 2-Ethylhexanol
- 1.3. Polyvinyl Buthyral
- 1.4. Others
-
2. Application
- 2.1. Paints and Coatings
- 2.2. Pharmaceutical
- 2.3. Agrochemical
- 2.4. Polymer
- 2.5. Others
Butyraldehyde Market Segmentation By Geography
-
1. Asia Pacific
- 1.1. China
- 1.2. India
- 1.3. Japan
- 1.4. South Korea
- 1.5. Rest of Asia Pacific
-
2. North America
- 2.1. United States
- 2.2. Canada
- 2.3. Mexico
-
3. Europe
- 3.1. Germany
- 3.2. United Kingdom
- 3.3. France
- 3.4. Italy
- 3.5. Rest of Europe
-
4. South America
- 4.1. Brazil
- 4.2. Argentina
- 4.3. Rest of South America
-
5. Middle East and Africa
- 5.1. Saudi Arabia
- 5.2. South Africa
- 5.3. Rest of Middle East and Africa
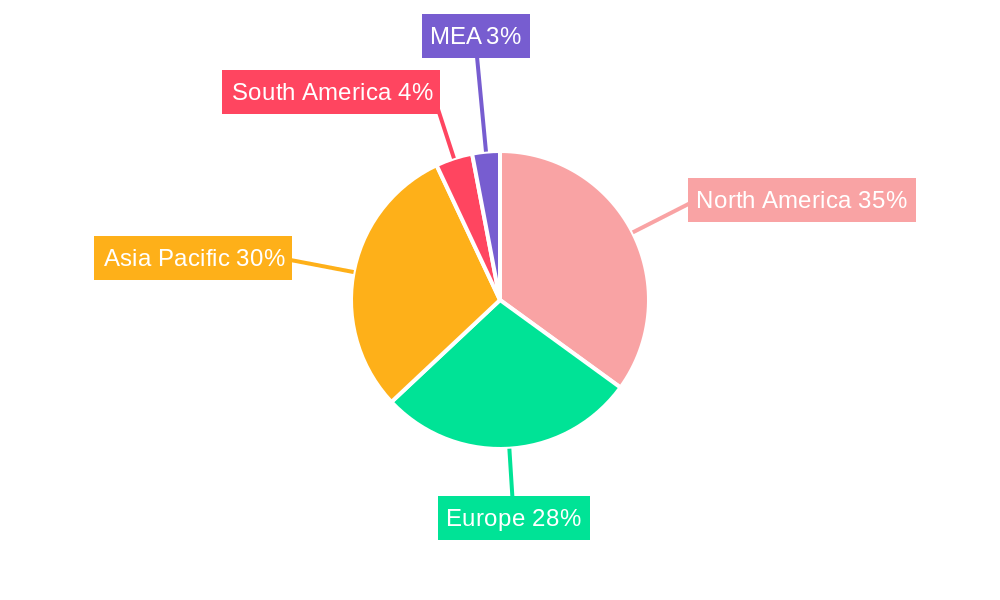
Butyraldehyde Market Regional Market Share
Geographic Coverage of Butyraldehyde Market
Butyraldehyde Market REPORT HIGHLIGHTS
| Aspects | Details |
|---|---|
| Study Period | 2020-2034 |
| Base Year | 2025 |
| Estimated Year | 2026 |
| Forecast Period | 2026-2034 |
| Historical Period | 2020-2025 |
| Growth Rate | CAGR of 3.72% from 2020-2034 |
| Segmentation |
|
Table of Contents
- 1. Introduction
- 1.1. Research Scope
- 1.2. Market Segmentation
- 1.3. Research Objective
- 1.4. Definitions and Assumptions
- 2. Executive Summary
- 2.1. Market Snapshot
- 3. Market Dynamics
- 3.1. Market Drivers
- 3.2. Market Restrains
- 3.3. Market Trends
- 3.4. Market Opportunities
- 4. Market Factor Analysis
- 4.1. Porters Five Forces
- 4.1.1. Bargaining Power of Suppliers
- 4.1.2. Bargaining Power of Buyers
- 4.1.3. Threat of New Entrants
- 4.1.4. Threat of Substitutes
- 4.1.5. Competitive Rivalry
- 4.2. PESTEL analysis
- 4.3. BCG Analysis
- 4.3.1. Stars (High Growth, High Market Share)
- 4.3.2. Cash Cows (Low Growth, High Market Share)
- 4.3.3. Question Mark (High Growth, Low Market Share)
- 4.3.4. Dogs (Low Growth, Low Market Share)
- 4.4. Ansoff Matrix Analysis
- 4.5. Supply Chain Analysis
- 4.6. Regulatory Landscape
- 4.7. Current Market Potential and Opportunity Assessment (TAM–SAM–SOM Framework)
- 4.8. RAX Analyst Note
- 4.1. Porters Five Forces
- 5. Market Analysis, Insights and Forecast 2021-2033
- 5.1. Market Analysis, Insights and Forecast - by Product Type
- 5.1.1. N-Butanol
- 5.1.2. 2-Ethylhexanol
- 5.1.3. Polyvinyl Buthyral
- 5.1.4. Others
- 5.2. Market Analysis, Insights and Forecast - by Application
- 5.2.1. Paints and Coatings
- 5.2.2. Pharmaceutical
- 5.2.3. Agrochemical
- 5.2.4. Polymer
- 5.2.5. Others
- 5.3. Market Analysis, Insights and Forecast - by Region
- 5.3.1. Asia Pacific
- 5.3.2. North America
- 5.3.3. Europe
- 5.3.4. South America
- 5.3.5. Middle East and Africa
- 5.1. Market Analysis, Insights and Forecast - by Product Type
- 6. Global Butyraldehyde Market Analysis, Insights and Forecast, 2021-2033
- 6.1. Market Analysis, Insights and Forecast - by Product Type
- 6.1.1. N-Butanol
- 6.1.2. 2-Ethylhexanol
- 6.1.3. Polyvinyl Buthyral
- 6.1.4. Others
- 6.2. Market Analysis, Insights and Forecast - by Application
- 6.2.1. Paints and Coatings
- 6.2.2. Pharmaceutical
- 6.2.3. Agrochemical
- 6.2.4. Polymer
- 6.2.5. Others
- 6.1. Market Analysis, Insights and Forecast - by Product Type
- 7. Asia Pacific Butyraldehyde Market Analysis, Insights and Forecast, 2020-2032
- 7.1. Market Analysis, Insights and Forecast - by Product Type
- 7.1.1. N-Butanol
- 7.1.2. 2-Ethylhexanol
- 7.1.3. Polyvinyl Buthyral
- 7.1.4. Others
- 7.2. Market Analysis, Insights and Forecast - by Application
- 7.2.1. Paints and Coatings
- 7.2.2. Pharmaceutical
- 7.2.3. Agrochemical
- 7.2.4. Polymer
- 7.2.5. Others
- 7.1. Market Analysis, Insights and Forecast - by Product Type
- 8. North America Butyraldehyde Market Analysis, Insights and Forecast, 2020-2032
- 8.1. Market Analysis, Insights and Forecast - by Product Type
- 8.1.1. N-Butanol
- 8.1.2. 2-Ethylhexanol
- 8.1.3. Polyvinyl Buthyral
- 8.1.4. Others
- 8.2. Market Analysis, Insights and Forecast - by Application
- 8.2.1. Paints and Coatings
- 8.2.2. Pharmaceutical
- 8.2.3. Agrochemical
- 8.2.4. Polymer
- 8.2.5. Others
- 8.1. Market Analysis, Insights and Forecast - by Product Type
- 9. Europe Butyraldehyde Market Analysis, Insights and Forecast, 2020-2032
- 9.1. Market Analysis, Insights and Forecast - by Product Type
- 9.1.1. N-Butanol
- 9.1.2. 2-Ethylhexanol
- 9.1.3. Polyvinyl Buthyral
- 9.1.4. Others
- 9.2. Market Analysis, Insights and Forecast - by Application
- 9.2.1. Paints and Coatings
- 9.2.2. Pharmaceutical
- 9.2.3. Agrochemical
- 9.2.4. Polymer
- 9.2.5. Others
- 9.1. Market Analysis, Insights and Forecast - by Product Type
- 10. South America Butyraldehyde Market Analysis, Insights and Forecast, 2020-2032
- 10.1. Market Analysis, Insights and Forecast - by Product Type
- 10.1.1. N-Butanol
- 10.1.2. 2-Ethylhexanol
- 10.1.3. Polyvinyl Buthyral
- 10.1.4. Others
- 10.2. Market Analysis, Insights and Forecast - by Application
- 10.2.1. Paints and Coatings
- 10.2.2. Pharmaceutical
- 10.2.3. Agrochemical
- 10.2.4. Polymer
- 10.2.5. Others
- 10.1. Market Analysis, Insights and Forecast - by Product Type
- 11. Middle East and Africa Butyraldehyde Market Analysis, Insights and Forecast, 2020-2032
- 11.1. Market Analysis, Insights and Forecast - by Product Type
- 11.1.1. N-Butanol
- 11.1.2. 2-Ethylhexanol
- 11.1.3. Polyvinyl Buthyral
- 11.1.4. Others
- 11.2. Market Analysis, Insights and Forecast - by Application
- 11.2.1. Paints and Coatings
- 11.2.2. Pharmaceutical
- 11.2.3. Agrochemical
- 11.2.4. Polymer
- 11.2.5. Others
- 11.1. Market Analysis, Insights and Forecast - by Product Type
- 12. Competitive Analysis
- 12.1. Company Profiles
- 12.1.1 KH Neochem Co Ltd
- 12.1.1.1. Company Overview
- 12.1.1.2. Products
- 12.1.1.3. Company Financials
- 12.1.1.4. SWOT Analysis
- 12.1.2 Merck KGaA
- 12.1.2.1. Company Overview
- 12.1.2.2. Products
- 12.1.2.3. Company Financials
- 12.1.2.4. SWOT Analysis
- 12.1.3 Mitsubishi Chemical Corporation
- 12.1.3.1. Company Overview
- 12.1.3.2. Products
- 12.1.3.3. Company Financials
- 12.1.3.4. SWOT Analysis
- 12.1.4 GELEST INC
- 12.1.4.1. Company Overview
- 12.1.4.2. Products
- 12.1.4.3. Company Financials
- 12.1.4.4. SWOT Analysis
- 12.1.5 Tokyo Chemical Industry Co Ltd
- 12.1.5.1. Company Overview
- 12.1.5.2. Products
- 12.1.5.3. Company Financials
- 12.1.5.4. SWOT Analysis
- 12.1.6 Toronto Research Chemicals
- 12.1.6.1. Company Overview
- 12.1.6.2. Products
- 12.1.6.3. Company Financials
- 12.1.6.4. SWOT Analysis
- 12.1.7 BASF SE
- 12.1.7.1. Company Overview
- 12.1.7.2. Products
- 12.1.7.3. Company Financials
- 12.1.7.4. SWOT Analysis
- 12.1.8 DuPont
- 12.1.8.1. Company Overview
- 12.1.8.2. Products
- 12.1.8.3. Company Financials
- 12.1.8.4. SWOT Analysis
- 12.1.9 Eastman Chemical Company
- 12.1.9.1. Company Overview
- 12.1.9.2. Products
- 12.1.9.3. Company Financials
- 12.1.9.4. SWOT Analysis
- 12.1.10 Alfa Aesar Thermo Fisher Scientific
- 12.1.10.1. Company Overview
- 12.1.10.2. Products
- 12.1.10.3. Company Financials
- 12.1.10.4. SWOT Analysis
- 12.1.11 Aurochemicals
- 12.1.11.1. Company Overview
- 12.1.11.2. Products
- 12.1.11.3. Company Financials
- 12.1.11.4. SWOT Analysis
- 12.1.12 LobaChemie Pvt Ltd
- 12.1.12.1. Company Overview
- 12.1.12.2. Products
- 12.1.12.3. Company Financials
- 12.1.12.4. SWOT Analysis
- 12.1.1 KH Neochem Co Ltd
- 12.2. Market Entropy
- 12.2.1 Company's Key Areas Served
- 12.2.2 Recent Developments
- 12.3. Company Market Share Analysis 2025
- 12.3.1 Top 5 Companies Market Share Analysis
- 12.3.2 Top 3 Companies Market Share Analysis
- 12.4. List of Potential Customers
- 13. Research Methodology
List of Figures
- Figure 1: Global Butyraldehyde Market Revenue Breakdown (Billion, %) by Region 2025 & 2033
- Figure 2: Global Butyraldehyde Market Volume Breakdown (K Tons, %) by Region 2025 & 2033
- Figure 3: Asia Pacific Butyraldehyde Market Revenue (Billion), by Product Type 2025 & 2033
- Figure 4: Asia Pacific Butyraldehyde Market Volume (K Tons), by Product Type 2025 & 2033
- Figure 5: Asia Pacific Butyraldehyde Market Revenue Share (%), by Product Type 2025 & 2033
- Figure 6: Asia Pacific Butyraldehyde Market Volume Share (%), by Product Type 2025 & 2033
- Figure 7: Asia Pacific Butyraldehyde Market Revenue (Billion), by Application 2025 & 2033
- Figure 8: Asia Pacific Butyraldehyde Market Volume (K Tons), by Application 2025 & 2033
- Figure 9: Asia Pacific Butyraldehyde Market Revenue Share (%), by Application 2025 & 2033
- Figure 10: Asia Pacific Butyraldehyde Market Volume Share (%), by Application 2025 & 2033
- Figure 11: Asia Pacific Butyraldehyde Market Revenue (Billion), by Country 2025 & 2033
- Figure 12: Asia Pacific Butyraldehyde Market Volume (K Tons), by Country 2025 & 2033
- Figure 13: Asia Pacific Butyraldehyde Market Revenue Share (%), by Country 2025 & 2033
- Figure 14: Asia Pacific Butyraldehyde Market Volume Share (%), by Country 2025 & 2033
- Figure 15: North America Butyraldehyde Market Revenue (Billion), by Product Type 2025 & 2033
- Figure 16: North America Butyraldehyde Market Volume (K Tons), by Product Type 2025 & 2033
- Figure 17: North America Butyraldehyde Market Revenue Share (%), by Product Type 2025 & 2033
- Figure 18: North America Butyraldehyde Market Volume Share (%), by Product Type 2025 & 2033
- Figure 19: North America Butyraldehyde Market Revenue (Billion), by Application 2025 & 2033
- Figure 20: North America Butyraldehyde Market Volume (K Tons), by Application 2025 & 2033
- Figure 21: North America Butyraldehyde Market Revenue Share (%), by Application 2025 & 2033
- Figure 22: North America Butyraldehyde Market Volume Share (%), by Application 2025 & 2033
- Figure 23: North America Butyraldehyde Market Revenue (Billion), by Country 2025 & 2033
- Figure 24: North America Butyraldehyde Market Volume (K Tons), by Country 2025 & 2033
- Figure 25: North America Butyraldehyde Market Revenue Share (%), by Country 2025 & 2033
- Figure 26: North America Butyraldehyde Market Volume Share (%), by Country 2025 & 2033
- Figure 27: Europe Butyraldehyde Market Revenue (Billion), by Product Type 2025 & 2033
- Figure 28: Europe Butyraldehyde Market Volume (K Tons), by Product Type 2025 & 2033
- Figure 29: Europe Butyraldehyde Market Revenue Share (%), by Product Type 2025 & 2033
- Figure 30: Europe Butyraldehyde Market Volume Share (%), by Product Type 2025 & 2033
- Figure 31: Europe Butyraldehyde Market Revenue (Billion), by Application 2025 & 2033
- Figure 32: Europe Butyraldehyde Market Volume (K Tons), by Application 2025 & 2033
- Figure 33: Europe Butyraldehyde Market Revenue Share (%), by Application 2025 & 2033
- Figure 34: Europe Butyraldehyde Market Volume Share (%), by Application 2025 & 2033
- Figure 35: Europe Butyraldehyde Market Revenue (Billion), by Country 2025 & 2033
- Figure 36: Europe Butyraldehyde Market Volume (K Tons), by Country 2025 & 2033
- Figure 37: Europe Butyraldehyde Market Revenue Share (%), by Country 2025 & 2033
- Figure 38: Europe Butyraldehyde Market Volume Share (%), by Country 2025 & 2033
- Figure 39: South America Butyraldehyde Market Revenue (Billion), by Product Type 2025 & 2033
- Figure 40: South America Butyraldehyde Market Volume (K Tons), by Product Type 2025 & 2033
- Figure 41: South America Butyraldehyde Market Revenue Share (%), by Product Type 2025 & 2033
- Figure 42: South America Butyraldehyde Market Volume Share (%), by Product Type 2025 & 2033
- Figure 43: South America Butyraldehyde Market Revenue (Billion), by Application 2025 & 2033
- Figure 44: South America Butyraldehyde Market Volume (K Tons), by Application 2025 & 2033
- Figure 45: South America Butyraldehyde Market Revenue Share (%), by Application 2025 & 2033
- Figure 46: South America Butyraldehyde Market Volume Share (%), by Application 2025 & 2033
- Figure 47: South America Butyraldehyde Market Revenue (Billion), by Country 2025 & 2033
- Figure 48: South America Butyraldehyde Market Volume (K Tons), by Country 2025 & 2033
- Figure 49: South America Butyraldehyde Market Revenue Share (%), by Country 2025 & 2033
- Figure 50: South America Butyraldehyde Market Volume Share (%), by Country 2025 & 2033
- Figure 51: Middle East and Africa Butyraldehyde Market Revenue (Billion), by Product Type 2025 & 2033
- Figure 52: Middle East and Africa Butyraldehyde Market Volume (K Tons), by Product Type 2025 & 2033
- Figure 53: Middle East and Africa Butyraldehyde Market Revenue Share (%), by Product Type 2025 & 2033
- Figure 54: Middle East and Africa Butyraldehyde Market Volume Share (%), by Product Type 2025 & 2033
- Figure 55: Middle East and Africa Butyraldehyde Market Revenue (Billion), by Application 2025 & 2033
- Figure 56: Middle East and Africa Butyraldehyde Market Volume (K Tons), by Application 2025 & 2033
- Figure 57: Middle East and Africa Butyraldehyde Market Revenue Share (%), by Application 2025 & 2033
- Figure 58: Middle East and Africa Butyraldehyde Market Volume Share (%), by Application 2025 & 2033
- Figure 59: Middle East and Africa Butyraldehyde Market Revenue (Billion), by Country 2025 & 2033
- Figure 60: Middle East and Africa Butyraldehyde Market Volume (K Tons), by Country 2025 & 2033
- Figure 61: Middle East and Africa Butyraldehyde Market Revenue Share (%), by Country 2025 & 2033
- Figure 62: Middle East and Africa Butyraldehyde Market Volume Share (%), by Country 2025 & 2033
List of Tables
- Table 1: Global Butyraldehyde Market Revenue Billion Forecast, by Product Type 2020 & 2033
- Table 2: Global Butyraldehyde Market Volume K Tons Forecast, by Product Type 2020 & 2033
- Table 3: Global Butyraldehyde Market Revenue Billion Forecast, by Application 2020 & 2033
- Table 4: Global Butyraldehyde Market Volume K Tons Forecast, by Application 2020 & 2033
- Table 5: Global Butyraldehyde Market Revenue Billion Forecast, by Region 2020 & 2033
- Table 6: Global Butyraldehyde Market Volume K Tons Forecast, by Region 2020 & 2033
- Table 7: Global Butyraldehyde Market Revenue Billion Forecast, by Product Type 2020 & 2033
- Table 8: Global Butyraldehyde Market Volume K Tons Forecast, by Product Type 2020 & 2033
- Table 9: Global Butyraldehyde Market Revenue Billion Forecast, by Application 2020 & 2033
- Table 10: Global Butyraldehyde Market Volume K Tons Forecast, by Application 2020 & 2033
- Table 11: Global Butyraldehyde Market Revenue Billion Forecast, by Country 2020 & 2033
- Table 12: Global Butyraldehyde Market Volume K Tons Forecast, by Country 2020 & 2033
- Table 13: China Butyraldehyde Market Revenue (Billion) Forecast, by Application 2020 & 2033
- Table 14: China Butyraldehyde Market Volume (K Tons) Forecast, by Application 2020 & 2033
- Table 15: India Butyraldehyde Market Revenue (Billion) Forecast, by Application 2020 & 2033
- Table 16: India Butyraldehyde Market Volume (K Tons) Forecast, by Application 2020 & 2033
- Table 17: Japan Butyraldehyde Market Revenue (Billion) Forecast, by Application 2020 & 2033
- Table 18: Japan Butyraldehyde Market Volume (K Tons) Forecast, by Application 2020 & 2033
- Table 19: South Korea Butyraldehyde Market Revenue (Billion) Forecast, by Application 2020 & 2033
- Table 20: South Korea Butyraldehyde Market Volume (K Tons) Forecast, by Application 2020 & 2033
- Table 21: Rest of Asia Pacific Butyraldehyde Market Revenue (Billion) Forecast, by Application 2020 & 2033
- Table 22: Rest of Asia Pacific Butyraldehyde Market Volume (K Tons) Forecast, by Application 2020 & 2033
- Table 23: Global Butyraldehyde Market Revenue Billion Forecast, by Product Type 2020 & 2033
- Table 24: Global Butyraldehyde Market Volume K Tons Forecast, by Product Type 2020 & 2033
- Table 25: Global Butyraldehyde Market Revenue Billion Forecast, by Application 2020 & 2033
- Table 26: Global Butyraldehyde Market Volume K Tons Forecast, by Application 2020 & 2033
- Table 27: Global Butyraldehyde Market Revenue Billion Forecast, by Country 2020 & 2033
- Table 28: Global Butyraldehyde Market Volume K Tons Forecast, by Country 2020 & 2033
- Table 29: United States Butyraldehyde Market Revenue (Billion) Forecast, by Application 2020 & 2033
- Table 30: United States Butyraldehyde Market Volume (K Tons) Forecast, by Application 2020 & 2033
- Table 31: Canada Butyraldehyde Market Revenue (Billion) Forecast, by Application 2020 & 2033
- Table 32: Canada Butyraldehyde Market Volume (K Tons) Forecast, by Application 2020 & 2033
- Table 33: Mexico Butyraldehyde Market Revenue (Billion) Forecast, by Application 2020 & 2033
- Table 34: Mexico Butyraldehyde Market Volume (K Tons) Forecast, by Application 2020 & 2033
- Table 35: Global Butyraldehyde Market Revenue Billion Forecast, by Product Type 2020 & 2033
- Table 36: Global Butyraldehyde Market Volume K Tons Forecast, by Product Type 2020 & 2033
- Table 37: Global Butyraldehyde Market Revenue Billion Forecast, by Application 2020 & 2033
- Table 38: Global Butyraldehyde Market Volume K Tons Forecast, by Application 2020 & 2033
- Table 39: Global Butyraldehyde Market Revenue Billion Forecast, by Country 2020 & 2033
- Table 40: Global Butyraldehyde Market Volume K Tons Forecast, by Country 2020 & 2033
- Table 41: Germany Butyraldehyde Market Revenue (Billion) Forecast, by Application 2020 & 2033
- Table 42: Germany Butyraldehyde Market Volume (K Tons) Forecast, by Application 2020 & 2033
- Table 43: United Kingdom Butyraldehyde Market Revenue (Billion) Forecast, by Application 2020 & 2033
- Table 44: United Kingdom Butyraldehyde Market Volume (K Tons) Forecast, by Application 2020 & 2033
- Table 45: France Butyraldehyde Market Revenue (Billion) Forecast, by Application 2020 & 2033
- Table 46: France Butyraldehyde Market Volume (K Tons) Forecast, by Application 2020 & 2033
- Table 47: Italy Butyraldehyde Market Revenue (Billion) Forecast, by Application 2020 & 2033
- Table 48: Italy Butyraldehyde Market Volume (K Tons) Forecast, by Application 2020 & 2033
- Table 49: Rest of Europe Butyraldehyde Market Revenue (Billion) Forecast, by Application 2020 & 2033
- Table 50: Rest of Europe Butyraldehyde Market Volume (K Tons) Forecast, by Application 2020 & 2033
- Table 51: Global Butyraldehyde Market Revenue Billion Forecast, by Product Type 2020 & 2033
- Table 52: Global Butyraldehyde Market Volume K Tons Forecast, by Product Type 2020 & 2033
- Table 53: Global Butyraldehyde Market Revenue Billion Forecast, by Application 2020 & 2033
- Table 54: Global Butyraldehyde Market Volume K Tons Forecast, by Application 2020 & 2033
- Table 55: Global Butyraldehyde Market Revenue Billion Forecast, by Country 2020 & 2033
- Table 56: Global Butyraldehyde Market Volume K Tons Forecast, by Country 2020 & 2033
- Table 57: Brazil Butyraldehyde Market Revenue (Billion) Forecast, by Application 2020 & 2033
- Table 58: Brazil Butyraldehyde Market Volume (K Tons) Forecast, by Application 2020 & 2033
- Table 59: Argentina Butyraldehyde Market Revenue (Billion) Forecast, by Application 2020 & 2033
- Table 60: Argentina Butyraldehyde Market Volume (K Tons) Forecast, by Application 2020 & 2033
- Table 61: Rest of South America Butyraldehyde Market Revenue (Billion) Forecast, by Application 2020 & 2033
- Table 62: Rest of South America Butyraldehyde Market Volume (K Tons) Forecast, by Application 2020 & 2033
- Table 63: Global Butyraldehyde Market Revenue Billion Forecast, by Product Type 2020 & 2033
- Table 64: Global Butyraldehyde Market Volume K Tons Forecast, by Product Type 2020 & 2033
- Table 65: Global Butyraldehyde Market Revenue Billion Forecast, by Application 2020 & 2033
- Table 66: Global Butyraldehyde Market Volume K Tons Forecast, by Application 2020 & 2033
- Table 67: Global Butyraldehyde Market Revenue Billion Forecast, by Country 2020 & 2033
- Table 68: Global Butyraldehyde Market Volume K Tons Forecast, by Country 2020 & 2033
- Table 69: Saudi Arabia Butyraldehyde Market Revenue (Billion) Forecast, by Application 2020 & 2033
- Table 70: Saudi Arabia Butyraldehyde Market Volume (K Tons) Forecast, by Application 2020 & 2033
- Table 71: South Africa Butyraldehyde Market Revenue (Billion) Forecast, by Application 2020 & 2033
- Table 72: South Africa Butyraldehyde Market Volume (K Tons) Forecast, by Application 2020 & 2033
- Table 73: Rest of Middle East and Africa Butyraldehyde Market Revenue (Billion) Forecast, by Application 2020 & 2033
- Table 74: Rest of Middle East and Africa Butyraldehyde Market Volume (K Tons) Forecast, by Application 2020 & 2033
Frequently Asked Questions
1. What is the projected Compound Annual Growth Rate (CAGR) of the Butyraldehyde Market?
The projected CAGR is approximately 3.72%.
2. Which companies are prominent players in the Butyraldehyde Market?
Key companies in the market include KH Neochem Co Ltd, Merck KGaA, Mitsubishi Chemical Corporation, GELEST INC, Tokyo Chemical Industry Co Ltd, Toronto Research Chemicals, BASF SE, DuPont, Eastman Chemical Company, Alfa Aesar Thermo Fisher Scientific, Aurochemicals, LobaChemie Pvt Ltd.
3. What are the main segments of the Butyraldehyde Market?
The market segments include Product Type, Application.
4. Can you provide details about the market size?
The market size is estimated to be USD 3.24 Billion as of 2022.
5. What are some drivers contributing to market growth?
; Increasing Demand from Paints and Coatings Sector; Other Drivers.
6. What are the notable trends driving market growth?
N-Butanol to Dominate the Market.
7. Are there any restraints impacting market growth?
; Health and Environmental Hazard of Butyraldehyde; Unfavorable Conditions Arising Due to COVID-19 Outbreak.
8. Can you provide examples of recent developments in the market?
N/A
9. What pricing options are available for accessing the report?
Pricing options include single-user, multi-user, and enterprise licenses priced at USD 4750, USD 5250, and USD 8750 respectively.
10. Is the market size provided in terms of value or volume?
The market size is provided in terms of value, measured in Billion and volume, measured in K Tons.
11. Are there any specific market keywords associated with the report?
Yes, the market keyword associated with the report is "Butyraldehyde Market," which aids in identifying and referencing the specific market segment covered.
12. How do I determine which pricing option suits my needs best?
The pricing options vary based on user requirements and access needs. Individual users may opt for single-user licenses, while businesses requiring broader access may choose multi-user or enterprise licenses for cost-effective access to the report.
13. Are there any additional resources or data provided in the Butyraldehyde Market report?
While the report offers comprehensive insights, it's advisable to review the specific contents or supplementary materials provided to ascertain if additional resources or data are available.
14. How can I stay updated on further developments or reports in the Butyraldehyde Market?
To stay informed about further developments, trends, and reports in the Butyraldehyde Market, consider subscribing to industry newsletters, following relevant companies and organizations, or regularly checking reputable industry news sources and publications.
Methodology
Step 1 - Identification of Relevant Samples Size from Population Database


Step 2 - Approaches for Defining Global Market Size (Value, Volume* & Price*)

Note*: In applicable scenarios
Step 3 - Data Sources
Primary Research
- Web Analytics
- Survey Reports
- Research Institute
- Latest Research Reports
- Opinion Leaders
Secondary Research
- Annual Reports
- White Paper
- Latest Press Release
- Industry Association
- Paid Database
- Investor Presentations

Step 4 - Data Triangulation
Involves using different sources of information in order to increase the validity of a study
These sources are likely to be stakeholders in a program - participants, other researchers, program staff, other community members, and so on.
Then we put all data in single framework & apply various statistical tools to find out the dynamic on the market.
During the analysis stage, feedback from the stakeholder groups would be compared to determine areas of agreement as well as areas of divergence

