

Key Insights
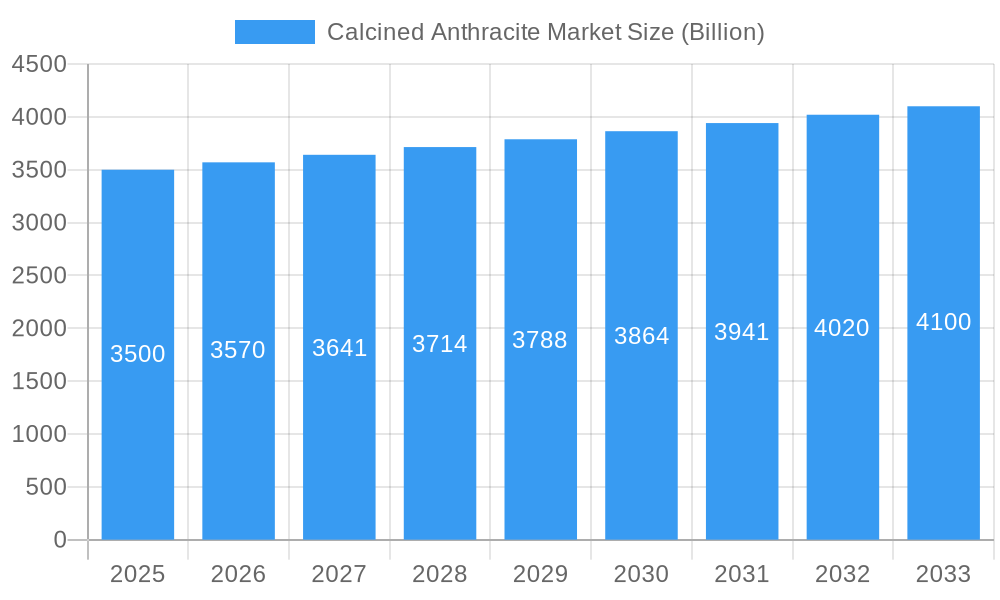
The global calcined anthracite market, valued at $3.5 billion in 2025, is projected to experience steady growth, driven by increasing demand from key industrial sectors. A compound annual growth rate (CAGR) of 1.9% from 2025 to 2033 indicates a gradual but consistent expansion. This growth is primarily fueled by the burgeoning steel industry, particularly the electric arc furnace (EAF) steelmaking process which relies heavily on calcined anthracite as a carbonaceous reducing agent. The increasing adoption of EAF steelmaking globally, coupled with the ongoing expansion of infrastructure projects, contributes significantly to market demand. Further growth drivers include the utilization of calcined anthracite in other applications like pulverized coal injection (PCI) in blast furnaces and as a filter medium, albeit to a lesser extent. While the market faces certain restraints, such as price volatility of raw materials and environmental regulations concerning carbon emissions, these challenges are likely to be mitigated by technological advancements and the ongoing shift towards more efficient and sustainable steel production methods. Regional growth will vary, with Asia-Pacific, particularly China and India, expected to dominate due to their substantial steel production capacities. North America and Europe will also contribute significantly, driven by ongoing infrastructure development and industrial activity. The market segmentation by calcination type (gas vs. electrical) and application reflects the diverse end-use sectors and technological preferences influencing market dynamics. Competitive landscape analysis reveals a mix of established players and emerging regional producers, indicating opportunities for both market consolidation and new entrants.
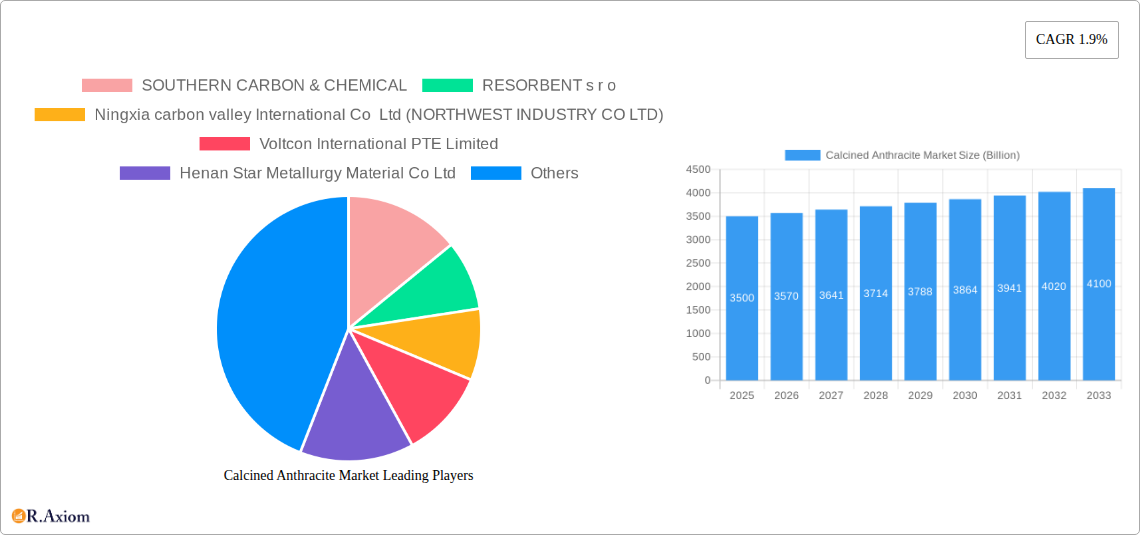
Calcined Anthracite Market Market Size (In Billion)
The steady growth trajectory of the calcined anthracite market anticipates consistent demand through 2033. However, future market performance will hinge on several factors. Steel production levels globally will play a significant role, as will advancements in alternative reducing agents and environmentally friendly steelmaking technologies. Furthermore, government regulations aimed at reducing carbon emissions may impact the demand for calcined anthracite, necessitating strategic adaptations by market players. Long-term growth prospects remain promising, predicated upon the sustained demand from the steel industry and the exploration of new applications for this crucial material. The market's evolution will also depend on the effectiveness of strategies adopted by industry players to navigate the challenges of raw material price fluctuations and sustainability concerns.
Calcined Anthracite Market Company Market Share
Calcined Anthracite Market: A Comprehensive Report (2019-2033)
This comprehensive report provides an in-depth analysis of the global Calcined Anthracite market, offering valuable insights for industry stakeholders, investors, and market entrants. Covering the period from 2019 to 2033, with 2025 as the base year and estimated year, this report projects a market valued at xx Billion by 2033. The report segments the market by calcination type (Gas, Electrical), application (Pulverized Coal Injection (Blast furnace), Basic Oxygen Steel Making (BOS), Electric Arc Furnace, Others (Electrodes, Filter Medium, etc.)), and geographically, providing a granular understanding of market dynamics and future growth trajectories.
Calcined Anthracite Market Market Concentration & Innovation
The Calcined Anthracite market is characterized by a moderately concentrated competitive landscape, with a select group of prominent companies commanding a significant share of the market. As of 2025, key players such as SOUTHERN CARBON & CHEMICAL, RESORBENT s r o, and Ningxia Carbon Valley International Co. Ltd (operating under NORTHWEST INDUSTRY CO LTD) collectively hold approximately xx% of the global market. This market share distribution is influenced by a confluence of factors including substantial production capacities, the adoption of cutting-edge technological advancements, and the extent of their geographic reach. Innovation within the industry is primarily propelled by the persistent demand for enhanced energy efficiency in its applications and a growing imperative to minimize environmental impact throughout the production lifecycle.
- Innovation Drivers: The industry is actively pursuing the development of more efficient and less energy-intensive calcination technologies. There's a pronounced focus on producing higher-quality calcined anthracite with superior performance characteristics tailored for specific industrial needs. Furthermore, the exploration and implementation of sustainable sourcing strategies and production practices are gaining significant traction.
- Regulatory Frameworks: Increasingly stringent global environmental regulations, particularly concerning carbon emissions, are acting as a powerful catalyst for innovation. This is driving the industry towards developing and adopting cleaner and more sustainable production methodologies.
- Product Substitutes: While calcined anthracite possesses unique properties that make it difficult to substitute in many critical applications, continuous monitoring of potential alternative materials in niche areas is essential to stay ahead of evolving market dynamics.
- End-User Trends: The robust and expanding steel industry, especially in rapidly developing emerging economies, represents a pivotal growth driver for calcined anthracite. Concurrently, a global shift in consumer and industrial preferences towards sustainable and environmentally responsible materials is influencing product development and innovation strategies.
- M&A Activities: The calcined anthracite sector has experienced substantial M&A activity, with an estimated xx Billion in transactions over the past five years. These activities are largely fueled by strategic imperatives for market expansion and the acquisition of advanced technologies. This trend of market consolidation is anticipated to continue, significantly shaping the competitive terrain in the coming years.
Calcined Anthracite Market Industry Trends & Insights
The global Calcined Anthracite market is experiencing robust growth, driven by increasing demand from various industries. The market is projected to achieve a CAGR of xx% during the forecast period (2025-2033), reaching a value of xx Billion by 2033. This growth is fueled by the expansion of the steel industry, particularly in emerging markets with rising infrastructure development. Technological advancements in calcination methods, focusing on energy efficiency and reduced emissions, are also contributing significantly.
Consumer preferences are increasingly shifting towards sustainable and environmentally friendly materials, which is placing pressure on manufacturers to adopt greener production processes. Competitive dynamics are characterized by both price competition and innovation-driven differentiation. Key players are focusing on product diversification, capacity expansion, and strategic partnerships to maintain their market positions. Market penetration of calcined anthracite is highest in the steel industry, with significant growth potential in other niche applications like electrodes and filter media.
Dominant Markets & Segments in Calcined Anthracite Market
The Asia-Pacific region is currently the dominant market for Calcined Anthracite, driven by robust steel production and infrastructure development in countries like China and India.
Dominant Segments:
- Application: Pulverized Coal Injection (PCI) in blast furnaces holds the largest market share, owing to its crucial role in enhancing metallurgical processes.
- Calcination Type: Gas calcination is currently the dominant method, although electrical calcination is gaining traction due to its potential for improved energy efficiency and reduced emissions.
Key Drivers for Dominant Regions/Segments:
- Asia-Pacific: Rapid industrialization, rising steel production, and supportive government policies.
- PCI in Blast Furnaces: Essential role in optimizing ironmaking processes, leading to increased demand.
- Gas Calcination: Established technology with relatively lower initial investment costs.
Calcined Anthracite Market Product Developments
Recent product innovations focus on enhancing the quality and consistency of calcined anthracite, improving its performance characteristics in various applications. Technological advancements in calcination processes are leading to the production of anthracite with superior reactivity, purity, and controlled particle size distribution. This improves its effectiveness in steelmaking and other industrial applications, providing a competitive edge for manufacturers. New applications of calcined anthracite are also being explored in areas like water filtration and energy storage.
Report Scope & Segmentation Analysis
This report segments the Calcined Anthracite market by calcination type (Gas, Electrical) and application (Pulverized Coal Injection (Blast furnace), Basic Oxygen Steel Making (BOS), Electric Arc Furnace, Others (Electrodes, Filter Medium, etc.)). Each segment's market size, growth projections, and competitive dynamics are analyzed in detail. The Gas calcination segment is currently larger but the Electrical calcination segment is expected to exhibit faster growth due to its environmentally friendly profile. The PCI application segment dominates, but other applications are showing promising growth potential.
Key Drivers of Calcined Anthracite Market Growth
The sustained growth of the Calcined Anthracite market is underpinned by a combination of potent factors. The burgeoning steel industry, a primary consumer, continues to exert significant demand for high-quality carbonaceous materials. Furthermore, ongoing global infrastructure development, particularly in rapidly industrializing emerging economies, fuels the need for materials like calcined anthracite. The widespread adoption of advanced calcination technologies, emphasizing improved efficiency and environmental sustainability, plays a crucial role. Finally, supportive government policies that champion industrial development and promote cleaner production methods provide a favorable environment for market expansion.
Challenges in the Calcined Anthracite Market Sector
Challenges include volatile raw material prices, stringent environmental regulations requiring substantial investments in emission control technologies, intense competition from substitute materials in niche applications, and potential supply chain disruptions impacting production and delivery timelines, resulting in xx Billion in lost revenue annually.
Emerging Opportunities in Calcined Anthracite Market
Emerging opportunities lie in developing advanced calcination technologies with higher efficiency and lower emissions; exploring new applications in specialized industries; expanding into geographically untapped markets; and focusing on sustainable sourcing and production practices to meet growing environmental concerns.
Leading Players in the Calcined Anthracite Market Market
- SOUTHERN CARBON & CHEMICAL
- RESORBENT s r o
- Ningxia Carbon Valley International Co Ltd (NORTHWEST INDUSTRY CO LTD)
- Voltcon International PTE Limited
- Henan Star Metallurgy Material Co Ltd
- Black Diamond
- JH CARBON
- Kingstone Group
- Aluminium Rheinfelden GmbH
Key Developments in Calcined Anthracite Market Industry
- 2022 Q4: SOUTHERN CARBON & CHEMICAL announced the successful commissioning of a new, highly efficient calcination facility, boosting their production capabilities and commitment to advanced manufacturing.
- 2023 Q1: China implemented a comprehensive suite of new environmental regulations aimed at curbing industrial pollution, which has spurred the adoption of cleaner production technologies across various sectors, including calcined anthracite.
- 2024 Q3: A significant merger between two key industry players has dramatically reshaped the market share dynamics, leading to a more consolidated competitive landscape. (Detailed implications of this merger are elaborated upon in the comprehensive market report).
Strategic Outlook for Calcined Anthracite Market Market
The Calcined Anthracite market presents a promising outlook for substantial growth, primarily driven by the continued trajectory of industrial expansion, especially within emerging economies. To maintain and enhance their competitive positioning, companies must strategically prioritize technological innovation, embrace and implement sustainable production practices, and forge robust strategic partnerships. The market is poised for further consolidation, with larger, established entities likely to pursue acquisitions of smaller competitors to secure market advantages. Proactive exploration of novel applications and untapped geographical markets will be instrumental in unlocking additional avenues for sustained growth and market leadership.
Calcined Anthracite Market Segmentation
-
1. Calcination Type
- 1.1. Gas
- 1.2. Electrical
-
2. Application
- 2.1. Pulverized Coal Injection (Blast furnace)
- 2.2. Basic Oxygen Steel Making (BOS)
- 2.3. Electric Arc Furnace
- 2.4. Others (Electrodes, Filter Medium, etc.,)
Calcined Anthracite Market Segmentation By Geography
-
1. Asia Pacific
- 1.1. China
- 1.2. India
- 1.3. Japan
- 1.4. South Korea
- 1.5. Rest of Asia Pacific
-
2. North America
- 2.1. United States
- 2.2. Canada
- 2.3. Mexico
-
3. Europe
- 3.1. Germany
- 3.2. United Kingdom
- 3.3. Italy
- 3.4. France
- 3.5. Rest of Europe
-
4. South America
- 4.1. Brazil
- 4.2. Argentina
- 4.3. Rest of South America
-
5. Middle East and Africa
- 5.1. Saudi Arabia
- 5.2. South Africa
- 5.3. Rest of Middle East and Africa
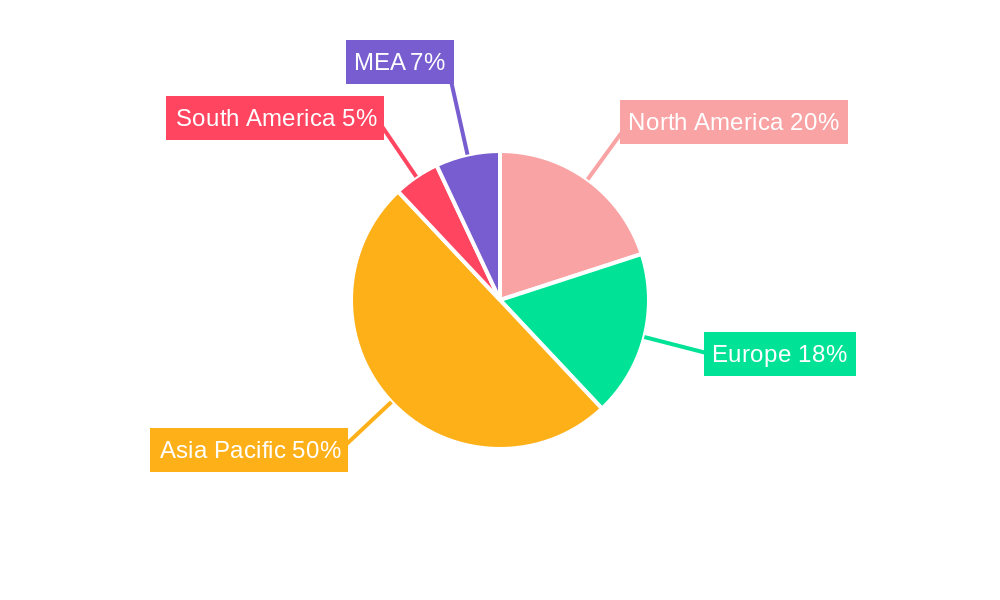
Calcined Anthracite Market Regional Market Share
Geographic Coverage of Calcined Anthracite Market
Calcined Anthracite Market REPORT HIGHLIGHTS
| Aspects | Details |
|---|---|
| Study Period | 2020-2034 |
| Base Year | 2025 |
| Estimated Year | 2026 |
| Forecast Period | 2026-2034 |
| Historical Period | 2020-2025 |
| Growth Rate | CAGR of 1.9% from 2020-2034 |
| Segmentation |
|
Table of Contents
- 1. Introduction
- 1.1. Research Scope
- 1.2. Market Segmentation
- 1.3. Research Objective
- 1.4. Definitions and Assumptions
- 2. Executive Summary
- 2.1. Market Snapshot
- 3. Market Dynamics
- 3.1. Market Drivers
- 3.2. Market Restrains
- 3.3. Market Trends
- 3.4. Market Opportunities
- 4. Market Factor Analysis
- 4.1. Porters Five Forces
- 4.1.1. Bargaining Power of Suppliers
- 4.1.2. Bargaining Power of Buyers
- 4.1.3. Threat of New Entrants
- 4.1.4. Threat of Substitutes
- 4.1.5. Competitive Rivalry
- 4.2. PESTEL analysis
- 4.3. BCG Analysis
- 4.3.1. Stars (High Growth, High Market Share)
- 4.3.2. Cash Cows (Low Growth, High Market Share)
- 4.3.3. Question Mark (High Growth, Low Market Share)
- 4.3.4. Dogs (Low Growth, Low Market Share)
- 4.4. Ansoff Matrix Analysis
- 4.5. Supply Chain Analysis
- 4.6. Regulatory Landscape
- 4.7. Current Market Potential and Opportunity Assessment (TAM–SAM–SOM Framework)
- 4.8. RAX Analyst Note
- 4.1. Porters Five Forces
- 5. Market Analysis, Insights and Forecast 2021-2033
- 5.1. Market Analysis, Insights and Forecast - by Calcination Type
- 5.1.1. Gas
- 5.1.2. Electrical
- 5.2. Market Analysis, Insights and Forecast - by Application
- 5.2.1. Pulverized Coal Injection (Blast furnace)
- 5.2.2. Basic Oxygen Steel Making (BOS)
- 5.2.3. Electric Arc Furnace
- 5.2.4. Others (Electrodes, Filter Medium, etc.,)
- 5.3. Market Analysis, Insights and Forecast - by Region
- 5.3.1. Asia Pacific
- 5.3.2. North America
- 5.3.3. Europe
- 5.3.4. South America
- 5.3.5. Middle East and Africa
- 5.1. Market Analysis, Insights and Forecast - by Calcination Type
- 6. Global Calcined Anthracite Market Analysis, Insights and Forecast, 2021-2033
- 6.1. Market Analysis, Insights and Forecast - by Calcination Type
- 6.1.1. Gas
- 6.1.2. Electrical
- 6.2. Market Analysis, Insights and Forecast - by Application
- 6.2.1. Pulverized Coal Injection (Blast furnace)
- 6.2.2. Basic Oxygen Steel Making (BOS)
- 6.2.3. Electric Arc Furnace
- 6.2.4. Others (Electrodes, Filter Medium, etc.,)
- 6.1. Market Analysis, Insights and Forecast - by Calcination Type
- 7. Asia Pacific Calcined Anthracite Market Analysis, Insights and Forecast, 2020-2032
- 7.1. Market Analysis, Insights and Forecast - by Calcination Type
- 7.1.1. Gas
- 7.1.2. Electrical
- 7.2. Market Analysis, Insights and Forecast - by Application
- 7.2.1. Pulverized Coal Injection (Blast furnace)
- 7.2.2. Basic Oxygen Steel Making (BOS)
- 7.2.3. Electric Arc Furnace
- 7.2.4. Others (Electrodes, Filter Medium, etc.,)
- 7.1. Market Analysis, Insights and Forecast - by Calcination Type
- 8. North America Calcined Anthracite Market Analysis, Insights and Forecast, 2020-2032
- 8.1. Market Analysis, Insights and Forecast - by Calcination Type
- 8.1.1. Gas
- 8.1.2. Electrical
- 8.2. Market Analysis, Insights and Forecast - by Application
- 8.2.1. Pulverized Coal Injection (Blast furnace)
- 8.2.2. Basic Oxygen Steel Making (BOS)
- 8.2.3. Electric Arc Furnace
- 8.2.4. Others (Electrodes, Filter Medium, etc.,)
- 8.1. Market Analysis, Insights and Forecast - by Calcination Type
- 9. Europe Calcined Anthracite Market Analysis, Insights and Forecast, 2020-2032
- 9.1. Market Analysis, Insights and Forecast - by Calcination Type
- 9.1.1. Gas
- 9.1.2. Electrical
- 9.2. Market Analysis, Insights and Forecast - by Application
- 9.2.1. Pulverized Coal Injection (Blast furnace)
- 9.2.2. Basic Oxygen Steel Making (BOS)
- 9.2.3. Electric Arc Furnace
- 9.2.4. Others (Electrodes, Filter Medium, etc.,)
- 9.1. Market Analysis, Insights and Forecast - by Calcination Type
- 10. South America Calcined Anthracite Market Analysis, Insights and Forecast, 2020-2032
- 10.1. Market Analysis, Insights and Forecast - by Calcination Type
- 10.1.1. Gas
- 10.1.2. Electrical
- 10.2. Market Analysis, Insights and Forecast - by Application
- 10.2.1. Pulverized Coal Injection (Blast furnace)
- 10.2.2. Basic Oxygen Steel Making (BOS)
- 10.2.3. Electric Arc Furnace
- 10.2.4. Others (Electrodes, Filter Medium, etc.,)
- 10.1. Market Analysis, Insights and Forecast - by Calcination Type
- 11. Middle East and Africa Calcined Anthracite Market Analysis, Insights and Forecast, 2020-2032
- 11.1. Market Analysis, Insights and Forecast - by Calcination Type
- 11.1.1. Gas
- 11.1.2. Electrical
- 11.2. Market Analysis, Insights and Forecast - by Application
- 11.2.1. Pulverized Coal Injection (Blast furnace)
- 11.2.2. Basic Oxygen Steel Making (BOS)
- 11.2.3. Electric Arc Furnace
- 11.2.4. Others (Electrodes, Filter Medium, etc.,)
- 11.1. Market Analysis, Insights and Forecast - by Calcination Type
- 12. Competitive Analysis
- 12.1. Company Profiles
- 12.1.1 SOUTHERN CARBON & CHEMICAL
- 12.1.1.1. Company Overview
- 12.1.1.2. Products
- 12.1.1.3. Company Financials
- 12.1.1.4. SWOT Analysis
- 12.1.2 RESORBENT s r o
- 12.1.2.1. Company Overview
- 12.1.2.2. Products
- 12.1.2.3. Company Financials
- 12.1.2.4. SWOT Analysis
- 12.1.3 Ningxia carbon valley International Co Ltd (NORTHWEST INDUSTRY CO LTD)
- 12.1.3.1. Company Overview
- 12.1.3.2. Products
- 12.1.3.3. Company Financials
- 12.1.3.4. SWOT Analysis
- 12.1.4 Voltcon International PTE Limited
- 12.1.4.1. Company Overview
- 12.1.4.2. Products
- 12.1.4.3. Company Financials
- 12.1.4.4. SWOT Analysis
- 12.1.5 Henan Star Metallurgy Material Co Ltd
- 12.1.5.1. Company Overview
- 12.1.5.2. Products
- 12.1.5.3. Company Financials
- 12.1.5.4. SWOT Analysis
- 12.1.6 Black Diamond
- 12.1.6.1. Company Overview
- 12.1.6.2. Products
- 12.1.6.3. Company Financials
- 12.1.6.4. SWOT Analysis
- 12.1.7 JH CARBON
- 12.1.7.1. Company Overview
- 12.1.7.2. Products
- 12.1.7.3. Company Financials
- 12.1.7.4. SWOT Analysis
- 12.1.8 Kingstone Group
- 12.1.8.1. Company Overview
- 12.1.8.2. Products
- 12.1.8.3. Company Financials
- 12.1.8.4. SWOT Analysis
- 12.1.9 Aluminium Rheinfelden GmbH
- 12.1.9.1. Company Overview
- 12.1.9.2. Products
- 12.1.9.3. Company Financials
- 12.1.9.4. SWOT Analysis
- 12.1.1 SOUTHERN CARBON & CHEMICAL
- 12.2. Market Entropy
- 12.2.1 Company's Key Areas Served
- 12.2.2 Recent Developments
- 12.3. Company Market Share Analysis 2025
- 12.3.1 Top 5 Companies Market Share Analysis
- 12.3.2 Top 3 Companies Market Share Analysis
- 12.4. List of Potential Customers
- 13. Research Methodology
List of Figures
- Figure 1: Global Calcined Anthracite Market Revenue Breakdown (Billion, %) by Region 2025 & 2033
- Figure 2: Global Calcined Anthracite Market Volume Breakdown (K Tons, %) by Region 2025 & 2033
- Figure 3: Asia Pacific Calcined Anthracite Market Revenue (Billion), by Calcination Type 2025 & 2033
- Figure 4: Asia Pacific Calcined Anthracite Market Volume (K Tons), by Calcination Type 2025 & 2033
- Figure 5: Asia Pacific Calcined Anthracite Market Revenue Share (%), by Calcination Type 2025 & 2033
- Figure 6: Asia Pacific Calcined Anthracite Market Volume Share (%), by Calcination Type 2025 & 2033
- Figure 7: Asia Pacific Calcined Anthracite Market Revenue (Billion), by Application 2025 & 2033
- Figure 8: Asia Pacific Calcined Anthracite Market Volume (K Tons), by Application 2025 & 2033
- Figure 9: Asia Pacific Calcined Anthracite Market Revenue Share (%), by Application 2025 & 2033
- Figure 10: Asia Pacific Calcined Anthracite Market Volume Share (%), by Application 2025 & 2033
- Figure 11: Asia Pacific Calcined Anthracite Market Revenue (Billion), by Country 2025 & 2033
- Figure 12: Asia Pacific Calcined Anthracite Market Volume (K Tons), by Country 2025 & 2033
- Figure 13: Asia Pacific Calcined Anthracite Market Revenue Share (%), by Country 2025 & 2033
- Figure 14: Asia Pacific Calcined Anthracite Market Volume Share (%), by Country 2025 & 2033
- Figure 15: North America Calcined Anthracite Market Revenue (Billion), by Calcination Type 2025 & 2033
- Figure 16: North America Calcined Anthracite Market Volume (K Tons), by Calcination Type 2025 & 2033
- Figure 17: North America Calcined Anthracite Market Revenue Share (%), by Calcination Type 2025 & 2033
- Figure 18: North America Calcined Anthracite Market Volume Share (%), by Calcination Type 2025 & 2033
- Figure 19: North America Calcined Anthracite Market Revenue (Billion), by Application 2025 & 2033
- Figure 20: North America Calcined Anthracite Market Volume (K Tons), by Application 2025 & 2033
- Figure 21: North America Calcined Anthracite Market Revenue Share (%), by Application 2025 & 2033
- Figure 22: North America Calcined Anthracite Market Volume Share (%), by Application 2025 & 2033
- Figure 23: North America Calcined Anthracite Market Revenue (Billion), by Country 2025 & 2033
- Figure 24: North America Calcined Anthracite Market Volume (K Tons), by Country 2025 & 2033
- Figure 25: North America Calcined Anthracite Market Revenue Share (%), by Country 2025 & 2033
- Figure 26: North America Calcined Anthracite Market Volume Share (%), by Country 2025 & 2033
- Figure 27: Europe Calcined Anthracite Market Revenue (Billion), by Calcination Type 2025 & 2033
- Figure 28: Europe Calcined Anthracite Market Volume (K Tons), by Calcination Type 2025 & 2033
- Figure 29: Europe Calcined Anthracite Market Revenue Share (%), by Calcination Type 2025 & 2033
- Figure 30: Europe Calcined Anthracite Market Volume Share (%), by Calcination Type 2025 & 2033
- Figure 31: Europe Calcined Anthracite Market Revenue (Billion), by Application 2025 & 2033
- Figure 32: Europe Calcined Anthracite Market Volume (K Tons), by Application 2025 & 2033
- Figure 33: Europe Calcined Anthracite Market Revenue Share (%), by Application 2025 & 2033
- Figure 34: Europe Calcined Anthracite Market Volume Share (%), by Application 2025 & 2033
- Figure 35: Europe Calcined Anthracite Market Revenue (Billion), by Country 2025 & 2033
- Figure 36: Europe Calcined Anthracite Market Volume (K Tons), by Country 2025 & 2033
- Figure 37: Europe Calcined Anthracite Market Revenue Share (%), by Country 2025 & 2033
- Figure 38: Europe Calcined Anthracite Market Volume Share (%), by Country 2025 & 2033
- Figure 39: South America Calcined Anthracite Market Revenue (Billion), by Calcination Type 2025 & 2033
- Figure 40: South America Calcined Anthracite Market Volume (K Tons), by Calcination Type 2025 & 2033
- Figure 41: South America Calcined Anthracite Market Revenue Share (%), by Calcination Type 2025 & 2033
- Figure 42: South America Calcined Anthracite Market Volume Share (%), by Calcination Type 2025 & 2033
- Figure 43: South America Calcined Anthracite Market Revenue (Billion), by Application 2025 & 2033
- Figure 44: South America Calcined Anthracite Market Volume (K Tons), by Application 2025 & 2033
- Figure 45: South America Calcined Anthracite Market Revenue Share (%), by Application 2025 & 2033
- Figure 46: South America Calcined Anthracite Market Volume Share (%), by Application 2025 & 2033
- Figure 47: South America Calcined Anthracite Market Revenue (Billion), by Country 2025 & 2033
- Figure 48: South America Calcined Anthracite Market Volume (K Tons), by Country 2025 & 2033
- Figure 49: South America Calcined Anthracite Market Revenue Share (%), by Country 2025 & 2033
- Figure 50: South America Calcined Anthracite Market Volume Share (%), by Country 2025 & 2033
- Figure 51: Middle East and Africa Calcined Anthracite Market Revenue (Billion), by Calcination Type 2025 & 2033
- Figure 52: Middle East and Africa Calcined Anthracite Market Volume (K Tons), by Calcination Type 2025 & 2033
- Figure 53: Middle East and Africa Calcined Anthracite Market Revenue Share (%), by Calcination Type 2025 & 2033
- Figure 54: Middle East and Africa Calcined Anthracite Market Volume Share (%), by Calcination Type 2025 & 2033
- Figure 55: Middle East and Africa Calcined Anthracite Market Revenue (Billion), by Application 2025 & 2033
- Figure 56: Middle East and Africa Calcined Anthracite Market Volume (K Tons), by Application 2025 & 2033
- Figure 57: Middle East and Africa Calcined Anthracite Market Revenue Share (%), by Application 2025 & 2033
- Figure 58: Middle East and Africa Calcined Anthracite Market Volume Share (%), by Application 2025 & 2033
- Figure 59: Middle East and Africa Calcined Anthracite Market Revenue (Billion), by Country 2025 & 2033
- Figure 60: Middle East and Africa Calcined Anthracite Market Volume (K Tons), by Country 2025 & 2033
- Figure 61: Middle East and Africa Calcined Anthracite Market Revenue Share (%), by Country 2025 & 2033
- Figure 62: Middle East and Africa Calcined Anthracite Market Volume Share (%), by Country 2025 & 2033
List of Tables
- Table 1: Global Calcined Anthracite Market Revenue Billion Forecast, by Calcination Type 2020 & 2033
- Table 2: Global Calcined Anthracite Market Volume K Tons Forecast, by Calcination Type 2020 & 2033
- Table 3: Global Calcined Anthracite Market Revenue Billion Forecast, by Application 2020 & 2033
- Table 4: Global Calcined Anthracite Market Volume K Tons Forecast, by Application 2020 & 2033
- Table 5: Global Calcined Anthracite Market Revenue Billion Forecast, by Region 2020 & 2033
- Table 6: Global Calcined Anthracite Market Volume K Tons Forecast, by Region 2020 & 2033
- Table 7: Global Calcined Anthracite Market Revenue Billion Forecast, by Calcination Type 2020 & 2033
- Table 8: Global Calcined Anthracite Market Volume K Tons Forecast, by Calcination Type 2020 & 2033
- Table 9: Global Calcined Anthracite Market Revenue Billion Forecast, by Application 2020 & 2033
- Table 10: Global Calcined Anthracite Market Volume K Tons Forecast, by Application 2020 & 2033
- Table 11: Global Calcined Anthracite Market Revenue Billion Forecast, by Country 2020 & 2033
- Table 12: Global Calcined Anthracite Market Volume K Tons Forecast, by Country 2020 & 2033
- Table 13: China Calcined Anthracite Market Revenue (Billion) Forecast, by Application 2020 & 2033
- Table 14: China Calcined Anthracite Market Volume (K Tons) Forecast, by Application 2020 & 2033
- Table 15: India Calcined Anthracite Market Revenue (Billion) Forecast, by Application 2020 & 2033
- Table 16: India Calcined Anthracite Market Volume (K Tons) Forecast, by Application 2020 & 2033
- Table 17: Japan Calcined Anthracite Market Revenue (Billion) Forecast, by Application 2020 & 2033
- Table 18: Japan Calcined Anthracite Market Volume (K Tons) Forecast, by Application 2020 & 2033
- Table 19: South Korea Calcined Anthracite Market Revenue (Billion) Forecast, by Application 2020 & 2033
- Table 20: South Korea Calcined Anthracite Market Volume (K Tons) Forecast, by Application 2020 & 2033
- Table 21: Rest of Asia Pacific Calcined Anthracite Market Revenue (Billion) Forecast, by Application 2020 & 2033
- Table 22: Rest of Asia Pacific Calcined Anthracite Market Volume (K Tons) Forecast, by Application 2020 & 2033
- Table 23: Global Calcined Anthracite Market Revenue Billion Forecast, by Calcination Type 2020 & 2033
- Table 24: Global Calcined Anthracite Market Volume K Tons Forecast, by Calcination Type 2020 & 2033
- Table 25: Global Calcined Anthracite Market Revenue Billion Forecast, by Application 2020 & 2033
- Table 26: Global Calcined Anthracite Market Volume K Tons Forecast, by Application 2020 & 2033
- Table 27: Global Calcined Anthracite Market Revenue Billion Forecast, by Country 2020 & 2033
- Table 28: Global Calcined Anthracite Market Volume K Tons Forecast, by Country 2020 & 2033
- Table 29: United States Calcined Anthracite Market Revenue (Billion) Forecast, by Application 2020 & 2033
- Table 30: United States Calcined Anthracite Market Volume (K Tons) Forecast, by Application 2020 & 2033
- Table 31: Canada Calcined Anthracite Market Revenue (Billion) Forecast, by Application 2020 & 2033
- Table 32: Canada Calcined Anthracite Market Volume (K Tons) Forecast, by Application 2020 & 2033
- Table 33: Mexico Calcined Anthracite Market Revenue (Billion) Forecast, by Application 2020 & 2033
- Table 34: Mexico Calcined Anthracite Market Volume (K Tons) Forecast, by Application 2020 & 2033
- Table 35: Global Calcined Anthracite Market Revenue Billion Forecast, by Calcination Type 2020 & 2033
- Table 36: Global Calcined Anthracite Market Volume K Tons Forecast, by Calcination Type 2020 & 2033
- Table 37: Global Calcined Anthracite Market Revenue Billion Forecast, by Application 2020 & 2033
- Table 38: Global Calcined Anthracite Market Volume K Tons Forecast, by Application 2020 & 2033
- Table 39: Global Calcined Anthracite Market Revenue Billion Forecast, by Country 2020 & 2033
- Table 40: Global Calcined Anthracite Market Volume K Tons Forecast, by Country 2020 & 2033
- Table 41: Germany Calcined Anthracite Market Revenue (Billion) Forecast, by Application 2020 & 2033
- Table 42: Germany Calcined Anthracite Market Volume (K Tons) Forecast, by Application 2020 & 2033
- Table 43: United Kingdom Calcined Anthracite Market Revenue (Billion) Forecast, by Application 2020 & 2033
- Table 44: United Kingdom Calcined Anthracite Market Volume (K Tons) Forecast, by Application 2020 & 2033
- Table 45: Italy Calcined Anthracite Market Revenue (Billion) Forecast, by Application 2020 & 2033
- Table 46: Italy Calcined Anthracite Market Volume (K Tons) Forecast, by Application 2020 & 2033
- Table 47: France Calcined Anthracite Market Revenue (Billion) Forecast, by Application 2020 & 2033
- Table 48: France Calcined Anthracite Market Volume (K Tons) Forecast, by Application 2020 & 2033
- Table 49: Rest of Europe Calcined Anthracite Market Revenue (Billion) Forecast, by Application 2020 & 2033
- Table 50: Rest of Europe Calcined Anthracite Market Volume (K Tons) Forecast, by Application 2020 & 2033
- Table 51: Global Calcined Anthracite Market Revenue Billion Forecast, by Calcination Type 2020 & 2033
- Table 52: Global Calcined Anthracite Market Volume K Tons Forecast, by Calcination Type 2020 & 2033
- Table 53: Global Calcined Anthracite Market Revenue Billion Forecast, by Application 2020 & 2033
- Table 54: Global Calcined Anthracite Market Volume K Tons Forecast, by Application 2020 & 2033
- Table 55: Global Calcined Anthracite Market Revenue Billion Forecast, by Country 2020 & 2033
- Table 56: Global Calcined Anthracite Market Volume K Tons Forecast, by Country 2020 & 2033
- Table 57: Brazil Calcined Anthracite Market Revenue (Billion) Forecast, by Application 2020 & 2033
- Table 58: Brazil Calcined Anthracite Market Volume (K Tons) Forecast, by Application 2020 & 2033
- Table 59: Argentina Calcined Anthracite Market Revenue (Billion) Forecast, by Application 2020 & 2033
- Table 60: Argentina Calcined Anthracite Market Volume (K Tons) Forecast, by Application 2020 & 2033
- Table 61: Rest of South America Calcined Anthracite Market Revenue (Billion) Forecast, by Application 2020 & 2033
- Table 62: Rest of South America Calcined Anthracite Market Volume (K Tons) Forecast, by Application 2020 & 2033
- Table 63: Global Calcined Anthracite Market Revenue Billion Forecast, by Calcination Type 2020 & 2033
- Table 64: Global Calcined Anthracite Market Volume K Tons Forecast, by Calcination Type 2020 & 2033
- Table 65: Global Calcined Anthracite Market Revenue Billion Forecast, by Application 2020 & 2033
- Table 66: Global Calcined Anthracite Market Volume K Tons Forecast, by Application 2020 & 2033
- Table 67: Global Calcined Anthracite Market Revenue Billion Forecast, by Country 2020 & 2033
- Table 68: Global Calcined Anthracite Market Volume K Tons Forecast, by Country 2020 & 2033
- Table 69: Saudi Arabia Calcined Anthracite Market Revenue (Billion) Forecast, by Application 2020 & 2033
- Table 70: Saudi Arabia Calcined Anthracite Market Volume (K Tons) Forecast, by Application 2020 & 2033
- Table 71: South Africa Calcined Anthracite Market Revenue (Billion) Forecast, by Application 2020 & 2033
- Table 72: South Africa Calcined Anthracite Market Volume (K Tons) Forecast, by Application 2020 & 2033
- Table 73: Rest of Middle East and Africa Calcined Anthracite Market Revenue (Billion) Forecast, by Application 2020 & 2033
- Table 74: Rest of Middle East and Africa Calcined Anthracite Market Volume (K Tons) Forecast, by Application 2020 & 2033
Frequently Asked Questions
1. What is the projected Compound Annual Growth Rate (CAGR) of the Calcined Anthracite Market?
The projected CAGR is approximately 1.9%.
2. Which companies are prominent players in the Calcined Anthracite Market?
Key companies in the market include SOUTHERN CARBON & CHEMICAL, RESORBENT s r o, Ningxia carbon valley International Co Ltd (NORTHWEST INDUSTRY CO LTD), Voltcon International PTE Limited, Henan Star Metallurgy Material Co Ltd, Black Diamond, JH CARBON, Kingstone Group, Aluminium Rheinfelden GmbH.
3. What are the main segments of the Calcined Anthracite Market?
The market segments include Calcination Type, Application.
4. Can you provide details about the market size?
The market size is estimated to be USD 3.50 Billion as of 2022.
5. What are some drivers contributing to market growth?
; Growing Demand form Steel Manufacturing Industries; Other Drivers.
6. What are the notable trends driving market growth?
Growing Demand from Steel Manufacturing Industries.
7. Are there any restraints impacting market growth?
; Depletion & Volatile Process of Raw Materials; Unfavorable Conditions Arising Due to the COVID-19 Outbreak.
8. Can you provide examples of recent developments in the market?
N/A
9. What pricing options are available for accessing the report?
Pricing options include single-user, multi-user, and enterprise licenses priced at USD 4750, USD 5250, and USD 8750 respectively.
10. Is the market size provided in terms of value or volume?
The market size is provided in terms of value, measured in Billion and volume, measured in K Tons.
11. Are there any specific market keywords associated with the report?
Yes, the market keyword associated with the report is "Calcined Anthracite Market," which aids in identifying and referencing the specific market segment covered.
12. How do I determine which pricing option suits my needs best?
The pricing options vary based on user requirements and access needs. Individual users may opt for single-user licenses, while businesses requiring broader access may choose multi-user or enterprise licenses for cost-effective access to the report.
13. Are there any additional resources or data provided in the Calcined Anthracite Market report?
While the report offers comprehensive insights, it's advisable to review the specific contents or supplementary materials provided to ascertain if additional resources or data are available.
14. How can I stay updated on further developments or reports in the Calcined Anthracite Market?
To stay informed about further developments, trends, and reports in the Calcined Anthracite Market, consider subscribing to industry newsletters, following relevant companies and organizations, or regularly checking reputable industry news sources and publications.
Methodology
Step 1 - Identification of Relevant Samples Size from Population Database


Step 2 - Approaches for Defining Global Market Size (Value, Volume* & Price*)

Note*: In applicable scenarios
Step 3 - Data Sources
Primary Research
- Web Analytics
- Survey Reports
- Research Institute
- Latest Research Reports
- Opinion Leaders
Secondary Research
- Annual Reports
- White Paper
- Latest Press Release
- Industry Association
- Paid Database
- Investor Presentations

Step 4 - Data Triangulation
Involves using different sources of information in order to increase the validity of a study
These sources are likely to be stakeholders in a program - participants, other researchers, program staff, other community members, and so on.
Then we put all data in single framework & apply various statistical tools to find out the dynamic on the market.
During the analysis stage, feedback from the stakeholder groups would be compared to determine areas of agreement as well as areas of divergence