
Key Insights
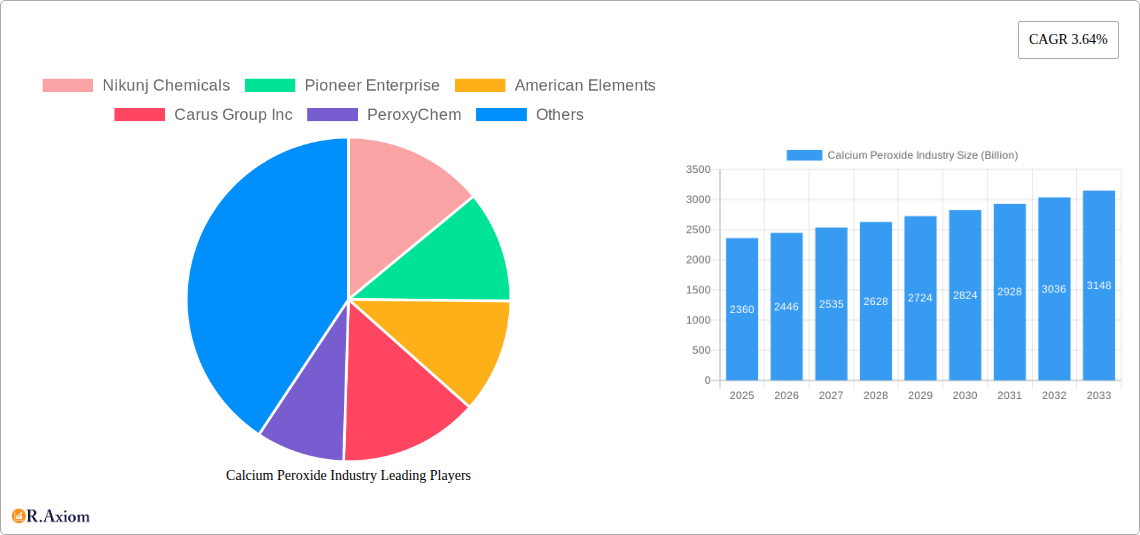
The global calcium peroxide market, valued at $2.36 billion in 2025, is projected to experience steady growth, driven by increasing demand across diverse sectors. The Compound Annual Growth Rate (CAGR) of 3.64% from 2025 to 2033 indicates a consistent expansion, primarily fueled by the rising adoption of calcium peroxide as a bleaching agent in the paper and pulp industry, its use as a seed disinfectant in agriculture, and its role as a dough conditioner in food processing. The food grade segment is expected to maintain a significant market share due to the growing awareness of safe and effective food preservation techniques. Furthermore, the burgeoning pharmaceutical industry and the increasing demand for environmentally friendly oxidizing agents contribute to the market's growth trajectory. However, fluctuations in raw material prices and stringent regulatory norms regarding the use of chemical agents in certain applications could pose challenges to market expansion. The Asia-Pacific region, particularly China and India, is anticipated to show significant growth due to expanding industrial sectors and increasing agricultural activities in these areas. North America and Europe, while mature markets, will continue to contribute substantially to overall revenue due to established industrial processes and consistent demand. Competitive dynamics are shaped by both established players like Solvay SA and PeroxyChem, and emerging regional producers, leading to innovative product development and pricing strategies.
The market segmentation highlights the diverse applications of calcium peroxide. The industrial segment, encompassing applications such as bleaching agents and intermediary chemicals, dominates the market, reflecting high demand in various manufacturing processes. Growth within the food segment is anticipated to be driven by rising consumer preference for natural and effective food preservation methods. Regional growth is expected to be influenced by economic development, government policies related to environmental protection, and the availability of raw materials. The forecast period reveals continued expansion, suggesting the calcium peroxide market is poised for sustained growth and increasing strategic importance across multiple industries.
Calcium Peroxide Industry: A Comprehensive Market Report (2019-2033)
This comprehensive report provides a detailed analysis of the global Calcium Peroxide industry, offering actionable insights for stakeholders across the value chain. The study period spans from 2019 to 2033, with 2025 serving as the base and estimated year. The report covers key segments, leading players, and emerging trends, projecting a robust market expansion in the forecast period (2025-2033). Market values are expressed in billions.
Calcium Peroxide Industry Market Concentration & Innovation
This section analyzes the competitive landscape of the Calcium Peroxide industry, exploring market concentration, innovation drivers, regulatory aspects, substitute products, end-user trends, and mergers & acquisitions (M&A) activities. The global Calcium Peroxide market exhibits a moderately concentrated structure, with several major players holding significant market share. The estimated market share for the top five players in 2025 is approximately xx%. Innovation is driven by the demand for improved product efficacy, enhanced safety features, and sustainable production processes. Stringent regulatory frameworks concerning the handling and use of peroxides influence industry practices. The primary substitute for calcium peroxide is hydrogen peroxide, though calcium peroxide possesses advantages in specific applications due to its slower release of oxygen. End-user trends are shifting towards greater adoption of calcium peroxide in eco-friendly applications, such as organic farming and environmentally conscious industrial processes. M&A activity within the industry has been moderate in recent years, with deal values ranging from xx billion to xx billion. Notable transactions include [Specific examples of M&A activity if available, otherwise mention "limited public information regarding recent significant mergers and acquisitions"].
- Key Metrics:
- Top 5 players market share (2025): xx%
- Average M&A deal value (2019-2024): xx Billion
- Number of M&A deals (2019-2024): xx
Calcium Peroxide Industry Industry Trends & Insights
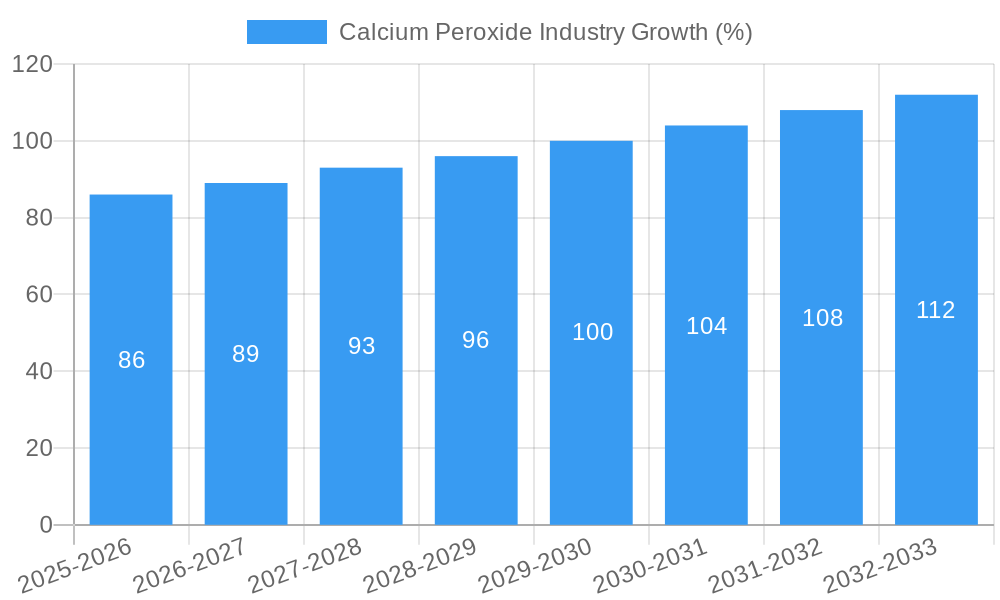
The global Calcium Peroxide market is experiencing substantial growth, driven by increasing demand across various sectors. The Compound Annual Growth Rate (CAGR) for the historical period (2019-2024) was estimated at xx%, and a CAGR of xx% is projected for the forecast period (2025-2033). Technological advancements, particularly in manufacturing processes and application-specific formulations, are contributing significantly to market expansion. Consumer preferences are shifting towards environmentally friendly and sustainable products, leading to a rise in the demand for calcium peroxide in organic farming and related industries. The competitive dynamics are characterized by both intense competition among established players and the emergence of new entrants, particularly in niche markets. Market penetration in key application areas such as food and agriculture shows strong potential for growth, with significant untapped opportunities remaining. Several factors are driving growth: increased demand from developing economies, stricter regulations on harmful chemical usage, and innovation of formulations for specialized applications. The growing awareness of the benefits of environmentally-friendly bleaching and disinfecting agents contributes significantly to market growth.
Dominant Markets & Segments in Calcium Peroxide Industry
The global Calcium Peroxide market is geographically diverse, with significant regional variations in growth rates and market share. [Specify leading region, e.g., North America, Europe, or Asia-Pacific] holds the largest market share in 2025, driven by robust demand from [specify dominant end-user industries and factors like economic strength and stringent environmental regulations].
- Key Drivers:
- Food Grade: Growing demand in the food and beverage industry for natural and effective bleaching and dough conditioning agents.
- Industrial Grade: Significant application in the mining and pulp & paper industries.
- Seed Disinfectant Application: Rising demand for efficient and environmentally friendly seed treatments in agriculture.
- Bleaching Agent Application: Increased utilization in textile and paper industries due to its effectiveness and environmental friendliness.
- Dough Conditioner Application: Expanding demand in the baking industry for improved dough quality and shelf life.
Dominance Analysis: The dominance of [Leading region/country] is attributed to several factors, including established infrastructure, strong economic growth, and favorable regulatory policies that support the adoption of calcium peroxide. The strong presence of key players in this region also contributes to its market leadership. [Mention specific factors based on chosen region, considering economic policies, agricultural practices, infrastructure development, environmental regulations, and any other relevant factors].
Calcium Peroxide Industry Product Developments
Recent advancements in calcium peroxide technology focus on improving particle size distribution for enhanced reactivity and solubility. New formulations cater to specific applications, improving efficacy and addressing safety concerns. For example, micro-encapsulation technologies are being explored to control the release rate of oxygen. These innovations offer distinct competitive advantages, enabling manufacturers to cater to specialized market segments and capture premium pricing. The development of more environmentally friendly and sustainable production processes is also a key focus.
Report Scope & Segmentation Analysis
This report provides a comprehensive segmentation of the Calcium Peroxide market based on Grade (Food, Industrial), Application (Seed Disinfectant, Bleaching Agent, Dough Conditioner, Oxidizing Agent, Intermediary Chemicals, Other Applications), and End-user Industry (Food and Beverages, Agriculture, Mining, Pharmaceuticals, Paper and Pulp, Other End-user Industries). Each segment’s market size and growth projections are analyzed, considering factors such as technological advancements, regulatory changes, and competitive dynamics. The market is expected to witness significant growth across all segments during the forecast period, driven by factors such as rising demand from key end-user industries and technological innovations in manufacturing processes. Competitive intensity varies across segments, with certain applications exhibiting a more concentrated market structure compared to others.
Key Drivers of Calcium Peroxide Industry Growth
The growth of the Calcium Peroxide industry is fueled by several factors, including the increasing demand for environmentally friendly alternatives in various applications, such as organic farming and food processing. Stringent regulations governing the use of harmful chemicals further boost the demand. The growing awareness of the benefits of calcium peroxide as a safe and effective bleaching agent and oxidizing agent is driving its adoption in diverse industrial sectors. The development of innovative formulations and manufacturing processes enhances its competitiveness and expands its applicability.
Challenges in the Calcium Peroxide Industry Sector
The Calcium Peroxide industry faces several challenges, including fluctuations in raw material prices, which can impact profitability. Stringent safety regulations and the associated handling and storage costs present significant operational hurdles. Competition from substitute products, primarily hydrogen peroxide, requires continuous innovation and development of niche applications to maintain market share. Supply chain disruptions, particularly in relation to raw materials, can affect production capacity and lead to price volatility. The industry also experiences competition from newer, more efficient technologies in certain applications, potentially impacting market share.
Emerging Opportunities in Calcium Peroxide Industry
Emerging opportunities exist in expanding applications of calcium peroxide in niche markets, such as specialized agriculture and environmental remediation. The development of advanced formulations and targeted delivery systems presents potential for increased market penetration. The growing focus on sustainability and environmentally friendly practices presents opportunities for developing and promoting sustainable production processes for calcium peroxide. Exploring new applications in areas like water treatment and bioremediation could offer significant growth potential.
Leading Players in the Calcium Peroxide Industry Market
- Nikunj Chemicals
- Pioneer Enterprise
- American Elements
- Carus Group Inc
- PeroxyChem
- Sunway Lab
- Zhengzhou Huize Biochemical Technology Co Ltd
- Solvay SA
- Mahalaxmi Enterprise
- Shangyu Jie Hua Chemical Co
- STP Chem Solutions Co Ltd
- Noshly Pty Ltd
Key Developments in Calcium Peroxide Industry Industry
- 2022-Q4: [Specific development, e.g., Launch of a new, improved formulation by Company X]
- 2023-Q1: [Specific development, e.g., Acquisition of Company Y by Company Z]
- 2023-Q3: [Specific development, e.g., Announcement of a new manufacturing facility by Company A]
- 2024-Q2: [Specific development, if available]
Strategic Outlook for Calcium Peroxide Industry Market
The Calcium Peroxide market is poised for continued growth, driven by the increasing demand from key end-user industries and technological advancements that enhance its efficacy and sustainability. Focus on developing advanced formulations, exploring new applications, and adopting sustainable production practices will be crucial for success. The industry's future prospects remain positive, with significant growth potential in both established and emerging markets. Companies that can successfully navigate the regulatory landscape and innovate effectively will be well-positioned to capitalize on the expanding market opportunities.
Calcium Peroxide Industry Segmentation
-
1. Grade
- 1.1. Food
- 1.2. Industrial
-
2. Application
- 2.1. Seed Disinfectant
- 2.2. Bleaching Agent
- 2.3. Dough Conditioner
- 2.4. Oxidizing Agent
- 2.5. Intermediary Chemicals
- 2.6. Other Applications
-
3. End-user Industry
- 3.1. Food and Beverages
- 3.2. Agriculture
- 3.3. Mining
- 3.4. Pharmaceuticals
- 3.5. Paper and Pulp
- 3.6. Other End-user Industries
Calcium Peroxide Industry Segmentation By Geography
-
1. Asia Pacific
- 1.1. China
- 1.2. India
- 1.3. Japan
- 1.4. South Korea
- 1.5. Rest of Asia Pacific
-
2. North America
- 2.1. United States
- 2.2. Canada
- 2.3. Mexico
-
3. Europe
- 3.1. Germany
- 3.2. United Kingdom
- 3.3. Italy
- 3.4. France
- 3.5. Rest of Europe
-
4. South America
- 4.1. Brazil
- 4.2. Argentina
- 4.3. Rest of South America
-
5. Middle East and Africa
- 5.1. Saudi Arabia
- 5.2. South Africa
- 5.3. Rest of Middle East and Africa

Calcium Peroxide Industry REPORT HIGHLIGHTS
| Aspects | Details |
|---|---|
| Study Period | 2019-2033 |
| Base Year | 2024 |
| Estimated Year | 2025 |
| Forecast Period | 2025-2033 |
| Historical Period | 2019-2024 |
| Growth Rate | CAGR of 3.64% from 2019-2033 |
| Segmentation |
|
Table of Contents
- 1. Introduction
- 1.1. Research Scope
- 1.2. Market Segmentation
- 1.3. Research Methodology
- 1.4. Definitions and Assumptions
- 2. Executive Summary
- 2.1. Introduction
- 3. Market Dynamics
- 3.1. Introduction
- 3.2. Market Drivers
- 3.2.1. ; Increase in Utilization as Dough Conditioner in the Food Industry; Increase in Usage in the Oral Care Industry
- 3.3. Market Restrains
- 3.3.1. ; Potential Hazardous Effects of Calcium Peroxide
- 3.4. Market Trends
- 3.4.1. Increasing Demand from Food and Beverage Industry
- 4. Market Factor Analysis
- 4.1. Porters Five Forces
- 4.2. Supply/Value Chain
- 4.3. PESTEL analysis
- 4.4. Market Entropy
- 4.5. Patent/Trademark Analysis
- 5. Global Calcium Peroxide Industry Analysis, Insights and Forecast, 2019-2031
- 5.1. Market Analysis, Insights and Forecast - by Grade
- 5.1.1. Food
- 5.1.2. Industrial
- 5.2. Market Analysis, Insights and Forecast - by Application
- 5.2.1. Seed Disinfectant
- 5.2.2. Bleaching Agent
- 5.2.3. Dough Conditioner
- 5.2.4. Oxidizing Agent
- 5.2.5. Intermediary Chemicals
- 5.2.6. Other Applications
- 5.3. Market Analysis, Insights and Forecast - by End-user Industry
- 5.3.1. Food and Beverages
- 5.3.2. Agriculture
- 5.3.3. Mining
- 5.3.4. Pharmaceuticals
- 5.3.5. Paper and Pulp
- 5.3.6. Other End-user Industries
- 5.4. Market Analysis, Insights and Forecast - by Region
- 5.4.1. Asia Pacific
- 5.4.2. North America
- 5.4.3. Europe
- 5.4.4. South America
- 5.4.5. Middle East and Africa
- 5.1. Market Analysis, Insights and Forecast - by Grade
- 6. Asia Pacific Calcium Peroxide Industry Analysis, Insights and Forecast, 2019-2031
- 6.1. Market Analysis, Insights and Forecast - by Grade
- 6.1.1. Food
- 6.1.2. Industrial
- 6.2. Market Analysis, Insights and Forecast - by Application
- 6.2.1. Seed Disinfectant
- 6.2.2. Bleaching Agent
- 6.2.3. Dough Conditioner
- 6.2.4. Oxidizing Agent
- 6.2.5. Intermediary Chemicals
- 6.2.6. Other Applications
- 6.3. Market Analysis, Insights and Forecast - by End-user Industry
- 6.3.1. Food and Beverages
- 6.3.2. Agriculture
- 6.3.3. Mining
- 6.3.4. Pharmaceuticals
- 6.3.5. Paper and Pulp
- 6.3.6. Other End-user Industries
- 6.1. Market Analysis, Insights and Forecast - by Grade
- 7. North America Calcium Peroxide Industry Analysis, Insights and Forecast, 2019-2031
- 7.1. Market Analysis, Insights and Forecast - by Grade
- 7.1.1. Food
- 7.1.2. Industrial
- 7.2. Market Analysis, Insights and Forecast - by Application
- 7.2.1. Seed Disinfectant
- 7.2.2. Bleaching Agent
- 7.2.3. Dough Conditioner
- 7.2.4. Oxidizing Agent
- 7.2.5. Intermediary Chemicals
- 7.2.6. Other Applications
- 7.3. Market Analysis, Insights and Forecast - by End-user Industry
- 7.3.1. Food and Beverages
- 7.3.2. Agriculture
- 7.3.3. Mining
- 7.3.4. Pharmaceuticals
- 7.3.5. Paper and Pulp
- 7.3.6. Other End-user Industries
- 7.1. Market Analysis, Insights and Forecast - by Grade
- 8. Europe Calcium Peroxide Industry Analysis, Insights and Forecast, 2019-2031
- 8.1. Market Analysis, Insights and Forecast - by Grade
- 8.1.1. Food
- 8.1.2. Industrial
- 8.2. Market Analysis, Insights and Forecast - by Application
- 8.2.1. Seed Disinfectant
- 8.2.2. Bleaching Agent
- 8.2.3. Dough Conditioner
- 8.2.4. Oxidizing Agent
- 8.2.5. Intermediary Chemicals
- 8.2.6. Other Applications
- 8.3. Market Analysis, Insights and Forecast - by End-user Industry
- 8.3.1. Food and Beverages
- 8.3.2. Agriculture
- 8.3.3. Mining
- 8.3.4. Pharmaceuticals
- 8.3.5. Paper and Pulp
- 8.3.6. Other End-user Industries
- 8.1. Market Analysis, Insights and Forecast - by Grade
- 9. South America Calcium Peroxide Industry Analysis, Insights and Forecast, 2019-2031
- 9.1. Market Analysis, Insights and Forecast - by Grade
- 9.1.1. Food
- 9.1.2. Industrial
- 9.2. Market Analysis, Insights and Forecast - by Application
- 9.2.1. Seed Disinfectant
- 9.2.2. Bleaching Agent
- 9.2.3. Dough Conditioner
- 9.2.4. Oxidizing Agent
- 9.2.5. Intermediary Chemicals
- 9.2.6. Other Applications
- 9.3. Market Analysis, Insights and Forecast - by End-user Industry
- 9.3.1. Food and Beverages
- 9.3.2. Agriculture
- 9.3.3. Mining
- 9.3.4. Pharmaceuticals
- 9.3.5. Paper and Pulp
- 9.3.6. Other End-user Industries
- 9.1. Market Analysis, Insights and Forecast - by Grade
- 10. Middle East and Africa Calcium Peroxide Industry Analysis, Insights and Forecast, 2019-2031
- 10.1. Market Analysis, Insights and Forecast - by Grade
- 10.1.1. Food
- 10.1.2. Industrial
- 10.2. Market Analysis, Insights and Forecast - by Application
- 10.2.1. Seed Disinfectant
- 10.2.2. Bleaching Agent
- 10.2.3. Dough Conditioner
- 10.2.4. Oxidizing Agent
- 10.2.5. Intermediary Chemicals
- 10.2.6. Other Applications
- 10.3. Market Analysis, Insights and Forecast - by End-user Industry
- 10.3.1. Food and Beverages
- 10.3.2. Agriculture
- 10.3.3. Mining
- 10.3.4. Pharmaceuticals
- 10.3.5. Paper and Pulp
- 10.3.6. Other End-user Industries
- 10.1. Market Analysis, Insights and Forecast - by Grade
- 11. North America Calcium Peroxide Industry Analysis, Insights and Forecast, 2019-2031
- 11.1. Market Analysis, Insights and Forecast - By Country/Sub-region
- 11.1.1 United States
- 11.1.2 Canada
- 11.1.3 Mexico
- 12. Europe Calcium Peroxide Industry Analysis, Insights and Forecast, 2019-2031
- 12.1. Market Analysis, Insights and Forecast - By Country/Sub-region
- 12.1.1 Germany
- 12.1.2 France
- 12.1.3 Italy
- 12.1.4 United Kingdom
- 12.1.5 Netherlands
- 12.1.6 Rest of Europe
- 13. Asia Pacific Calcium Peroxide Industry Analysis, Insights and Forecast, 2019-2031
- 13.1. Market Analysis, Insights and Forecast - By Country/Sub-region
- 13.1.1 China
- 13.1.2 Japan
- 13.1.3 India
- 13.1.4 South Korea
- 13.1.5 Taiwan
- 13.1.6 Australia
- 13.1.7 Rest of Asia-Pacific
- 14. South America Calcium Peroxide Industry Analysis, Insights and Forecast, 2019-2031
- 14.1. Market Analysis, Insights and Forecast - By Country/Sub-region
- 14.1.1 Brazil
- 14.1.2 Argentina
- 14.1.3 Rest of South America
- 15. MEA Calcium Peroxide Industry Analysis, Insights and Forecast, 2019-2031
- 15.1. Market Analysis, Insights and Forecast - By Country/Sub-region
- 15.1.1 Middle East
- 15.1.2 Africa
- 16. Competitive Analysis
- 16.1. Global Market Share Analysis 2024
- 16.2. Company Profiles
- 16.2.1 Nikunj Chemicals
- 16.2.1.1. Overview
- 16.2.1.2. Products
- 16.2.1.3. SWOT Analysis
- 16.2.1.4. Recent Developments
- 16.2.1.5. Financials (Based on Availability)
- 16.2.2 Pioneer Enterprise
- 16.2.2.1. Overview
- 16.2.2.2. Products
- 16.2.2.3. SWOT Analysis
- 16.2.2.4. Recent Developments
- 16.2.2.5. Financials (Based on Availability)
- 16.2.3 American Elements
- 16.2.3.1. Overview
- 16.2.3.2. Products
- 16.2.3.3. SWOT Analysis
- 16.2.3.4. Recent Developments
- 16.2.3.5. Financials (Based on Availability)
- 16.2.4 Carus Group Inc
- 16.2.4.1. Overview
- 16.2.4.2. Products
- 16.2.4.3. SWOT Analysis
- 16.2.4.4. Recent Developments
- 16.2.4.5. Financials (Based on Availability)
- 16.2.5 PeroxyChem
- 16.2.5.1. Overview
- 16.2.5.2. Products
- 16.2.5.3. SWOT Analysis
- 16.2.5.4. Recent Developments
- 16.2.5.5. Financials (Based on Availability)
- 16.2.6 Sunway Lab
- 16.2.6.1. Overview
- 16.2.6.2. Products
- 16.2.6.3. SWOT Analysis
- 16.2.6.4. Recent Developments
- 16.2.6.5. Financials (Based on Availability)
- 16.2.7 Zhengzhou Huize Biochemical Technology Co Ltd
- 16.2.7.1. Overview
- 16.2.7.2. Products
- 16.2.7.3. SWOT Analysis
- 16.2.7.4. Recent Developments
- 16.2.7.5. Financials (Based on Availability)
- 16.2.8 Solvay SA
- 16.2.8.1. Overview
- 16.2.8.2. Products
- 16.2.8.3. SWOT Analysis
- 16.2.8.4. Recent Developments
- 16.2.8.5. Financials (Based on Availability)
- 16.2.9 Mahalaxmi Enterprise
- 16.2.9.1. Overview
- 16.2.9.2. Products
- 16.2.9.3. SWOT Analysis
- 16.2.9.4. Recent Developments
- 16.2.9.5. Financials (Based on Availability)
- 16.2.10 Shangyu Jie Hua Chemical Co
- 16.2.10.1. Overview
- 16.2.10.2. Products
- 16.2.10.3. SWOT Analysis
- 16.2.10.4. Recent Developments
- 16.2.10.5. Financials (Based on Availability)
- 16.2.11 STP Chem Solutions Co Ltd
- 16.2.11.1. Overview
- 16.2.11.2. Products
- 16.2.11.3. SWOT Analysis
- 16.2.11.4. Recent Developments
- 16.2.11.5. Financials (Based on Availability)
- 16.2.12 Noshly Pty Ltd
- 16.2.12.1. Overview
- 16.2.12.2. Products
- 16.2.12.3. SWOT Analysis
- 16.2.12.4. Recent Developments
- 16.2.12.5. Financials (Based on Availability)
- 16.2.1 Nikunj Chemicals
List of Figures
- Figure 1: Global Calcium Peroxide Industry Revenue Breakdown (Billion, %) by Region 2024 & 2032
- Figure 2: Global Calcium Peroxide Industry Volume Breakdown (K Tons, %) by Region 2024 & 2032
- Figure 3: North America Calcium Peroxide Industry Revenue (Billion), by Country 2024 & 2032
- Figure 4: North America Calcium Peroxide Industry Volume (K Tons), by Country 2024 & 2032
- Figure 5: North America Calcium Peroxide Industry Revenue Share (%), by Country 2024 & 2032
- Figure 6: North America Calcium Peroxide Industry Volume Share (%), by Country 2024 & 2032
- Figure 7: Europe Calcium Peroxide Industry Revenue (Billion), by Country 2024 & 2032
- Figure 8: Europe Calcium Peroxide Industry Volume (K Tons), by Country 2024 & 2032
- Figure 9: Europe Calcium Peroxide Industry Revenue Share (%), by Country 2024 & 2032
- Figure 10: Europe Calcium Peroxide Industry Volume Share (%), by Country 2024 & 2032
- Figure 11: Asia Pacific Calcium Peroxide Industry Revenue (Billion), by Country 2024 & 2032
- Figure 12: Asia Pacific Calcium Peroxide Industry Volume (K Tons), by Country 2024 & 2032
- Figure 13: Asia Pacific Calcium Peroxide Industry Revenue Share (%), by Country 2024 & 2032
- Figure 14: Asia Pacific Calcium Peroxide Industry Volume Share (%), by Country 2024 & 2032
- Figure 15: South America Calcium Peroxide Industry Revenue (Billion), by Country 2024 & 2032
- Figure 16: South America Calcium Peroxide Industry Volume (K Tons), by Country 2024 & 2032
- Figure 17: South America Calcium Peroxide Industry Revenue Share (%), by Country 2024 & 2032
- Figure 18: South America Calcium Peroxide Industry Volume Share (%), by Country 2024 & 2032
- Figure 19: MEA Calcium Peroxide Industry Revenue (Billion), by Country 2024 & 2032
- Figure 20: MEA Calcium Peroxide Industry Volume (K Tons), by Country 2024 & 2032
- Figure 21: MEA Calcium Peroxide Industry Revenue Share (%), by Country 2024 & 2032
- Figure 22: MEA Calcium Peroxide Industry Volume Share (%), by Country 2024 & 2032
- Figure 23: Asia Pacific Calcium Peroxide Industry Revenue (Billion), by Grade 2024 & 2032
- Figure 24: Asia Pacific Calcium Peroxide Industry Volume (K Tons), by Grade 2024 & 2032
- Figure 25: Asia Pacific Calcium Peroxide Industry Revenue Share (%), by Grade 2024 & 2032
- Figure 26: Asia Pacific Calcium Peroxide Industry Volume Share (%), by Grade 2024 & 2032
- Figure 27: Asia Pacific Calcium Peroxide Industry Revenue (Billion), by Application 2024 & 2032
- Figure 28: Asia Pacific Calcium Peroxide Industry Volume (K Tons), by Application 2024 & 2032
- Figure 29: Asia Pacific Calcium Peroxide Industry Revenue Share (%), by Application 2024 & 2032
- Figure 30: Asia Pacific Calcium Peroxide Industry Volume Share (%), by Application 2024 & 2032
- Figure 31: Asia Pacific Calcium Peroxide Industry Revenue (Billion), by End-user Industry 2024 & 2032
- Figure 32: Asia Pacific Calcium Peroxide Industry Volume (K Tons), by End-user Industry 2024 & 2032
- Figure 33: Asia Pacific Calcium Peroxide Industry Revenue Share (%), by End-user Industry 2024 & 2032
- Figure 34: Asia Pacific Calcium Peroxide Industry Volume Share (%), by End-user Industry 2024 & 2032
- Figure 35: Asia Pacific Calcium Peroxide Industry Revenue (Billion), by Country 2024 & 2032
- Figure 36: Asia Pacific Calcium Peroxide Industry Volume (K Tons), by Country 2024 & 2032
- Figure 37: Asia Pacific Calcium Peroxide Industry Revenue Share (%), by Country 2024 & 2032
- Figure 38: Asia Pacific Calcium Peroxide Industry Volume Share (%), by Country 2024 & 2032
- Figure 39: North America Calcium Peroxide Industry Revenue (Billion), by Grade 2024 & 2032
- Figure 40: North America Calcium Peroxide Industry Volume (K Tons), by Grade 2024 & 2032
- Figure 41: North America Calcium Peroxide Industry Revenue Share (%), by Grade 2024 & 2032
- Figure 42: North America Calcium Peroxide Industry Volume Share (%), by Grade 2024 & 2032
- Figure 43: North America Calcium Peroxide Industry Revenue (Billion), by Application 2024 & 2032
- Figure 44: North America Calcium Peroxide Industry Volume (K Tons), by Application 2024 & 2032
- Figure 45: North America Calcium Peroxide Industry Revenue Share (%), by Application 2024 & 2032
- Figure 46: North America Calcium Peroxide Industry Volume Share (%), by Application 2024 & 2032
- Figure 47: North America Calcium Peroxide Industry Revenue (Billion), by End-user Industry 2024 & 2032
- Figure 48: North America Calcium Peroxide Industry Volume (K Tons), by End-user Industry 2024 & 2032
- Figure 49: North America Calcium Peroxide Industry Revenue Share (%), by End-user Industry 2024 & 2032
- Figure 50: North America Calcium Peroxide Industry Volume Share (%), by End-user Industry 2024 & 2032
- Figure 51: North America Calcium Peroxide Industry Revenue (Billion), by Country 2024 & 2032
- Figure 52: North America Calcium Peroxide Industry Volume (K Tons), by Country 2024 & 2032
- Figure 53: North America Calcium Peroxide Industry Revenue Share (%), by Country 2024 & 2032
- Figure 54: North America Calcium Peroxide Industry Volume Share (%), by Country 2024 & 2032
- Figure 55: Europe Calcium Peroxide Industry Revenue (Billion), by Grade 2024 & 2032
- Figure 56: Europe Calcium Peroxide Industry Volume (K Tons), by Grade 2024 & 2032
- Figure 57: Europe Calcium Peroxide Industry Revenue Share (%), by Grade 2024 & 2032
- Figure 58: Europe Calcium Peroxide Industry Volume Share (%), by Grade 2024 & 2032
- Figure 59: Europe Calcium Peroxide Industry Revenue (Billion), by Application 2024 & 2032
- Figure 60: Europe Calcium Peroxide Industry Volume (K Tons), by Application 2024 & 2032
- Figure 61: Europe Calcium Peroxide Industry Revenue Share (%), by Application 2024 & 2032
- Figure 62: Europe Calcium Peroxide Industry Volume Share (%), by Application 2024 & 2032
- Figure 63: Europe Calcium Peroxide Industry Revenue (Billion), by End-user Industry 2024 & 2032
- Figure 64: Europe Calcium Peroxide Industry Volume (K Tons), by End-user Industry 2024 & 2032
- Figure 65: Europe Calcium Peroxide Industry Revenue Share (%), by End-user Industry 2024 & 2032
- Figure 66: Europe Calcium Peroxide Industry Volume Share (%), by End-user Industry 2024 & 2032
- Figure 67: Europe Calcium Peroxide Industry Revenue (Billion), by Country 2024 & 2032
- Figure 68: Europe Calcium Peroxide Industry Volume (K Tons), by Country 2024 & 2032
- Figure 69: Europe Calcium Peroxide Industry Revenue Share (%), by Country 2024 & 2032
- Figure 70: Europe Calcium Peroxide Industry Volume Share (%), by Country 2024 & 2032
- Figure 71: South America Calcium Peroxide Industry Revenue (Billion), by Grade 2024 & 2032
- Figure 72: South America Calcium Peroxide Industry Volume (K Tons), by Grade 2024 & 2032
- Figure 73: South America Calcium Peroxide Industry Revenue Share (%), by Grade 2024 & 2032
- Figure 74: South America Calcium Peroxide Industry Volume Share (%), by Grade 2024 & 2032
- Figure 75: South America Calcium Peroxide Industry Revenue (Billion), by Application 2024 & 2032
- Figure 76: South America Calcium Peroxide Industry Volume (K Tons), by Application 2024 & 2032
- Figure 77: South America Calcium Peroxide Industry Revenue Share (%), by Application 2024 & 2032
- Figure 78: South America Calcium Peroxide Industry Volume Share (%), by Application 2024 & 2032
- Figure 79: South America Calcium Peroxide Industry Revenue (Billion), by End-user Industry 2024 & 2032
- Figure 80: South America Calcium Peroxide Industry Volume (K Tons), by End-user Industry 2024 & 2032
- Figure 81: South America Calcium Peroxide Industry Revenue Share (%), by End-user Industry 2024 & 2032
- Figure 82: South America Calcium Peroxide Industry Volume Share (%), by End-user Industry 2024 & 2032
- Figure 83: South America Calcium Peroxide Industry Revenue (Billion), by Country 2024 & 2032
- Figure 84: South America Calcium Peroxide Industry Volume (K Tons), by Country 2024 & 2032
- Figure 85: South America Calcium Peroxide Industry Revenue Share (%), by Country 2024 & 2032
- Figure 86: South America Calcium Peroxide Industry Volume Share (%), by Country 2024 & 2032
- Figure 87: Middle East and Africa Calcium Peroxide Industry Revenue (Billion), by Grade 2024 & 2032
- Figure 88: Middle East and Africa Calcium Peroxide Industry Volume (K Tons), by Grade 2024 & 2032
- Figure 89: Middle East and Africa Calcium Peroxide Industry Revenue Share (%), by Grade 2024 & 2032
- Figure 90: Middle East and Africa Calcium Peroxide Industry Volume Share (%), by Grade 2024 & 2032
- Figure 91: Middle East and Africa Calcium Peroxide Industry Revenue (Billion), by Application 2024 & 2032
- Figure 92: Middle East and Africa Calcium Peroxide Industry Volume (K Tons), by Application 2024 & 2032
- Figure 93: Middle East and Africa Calcium Peroxide Industry Revenue Share (%), by Application 2024 & 2032
- Figure 94: Middle East and Africa Calcium Peroxide Industry Volume Share (%), by Application 2024 & 2032
- Figure 95: Middle East and Africa Calcium Peroxide Industry Revenue (Billion), by End-user Industry 2024 & 2032
- Figure 96: Middle East and Africa Calcium Peroxide Industry Volume (K Tons), by End-user Industry 2024 & 2032
- Figure 97: Middle East and Africa Calcium Peroxide Industry Revenue Share (%), by End-user Industry 2024 & 2032
- Figure 98: Middle East and Africa Calcium Peroxide Industry Volume Share (%), by End-user Industry 2024 & 2032
- Figure 99: Middle East and Africa Calcium Peroxide Industry Revenue (Billion), by Country 2024 & 2032
- Figure 100: Middle East and Africa Calcium Peroxide Industry Volume (K Tons), by Country 2024 & 2032
- Figure 101: Middle East and Africa Calcium Peroxide Industry Revenue Share (%), by Country 2024 & 2032
- Figure 102: Middle East and Africa Calcium Peroxide Industry Volume Share (%), by Country 2024 & 2032
List of Tables
- Table 1: Global Calcium Peroxide Industry Revenue Billion Forecast, by Region 2019 & 2032
- Table 2: Global Calcium Peroxide Industry Volume K Tons Forecast, by Region 2019 & 2032
- Table 3: Global Calcium Peroxide Industry Revenue Billion Forecast, by Grade 2019 & 2032
- Table 4: Global Calcium Peroxide Industry Volume K Tons Forecast, by Grade 2019 & 2032
- Table 5: Global Calcium Peroxide Industry Revenue Billion Forecast, by Application 2019 & 2032
- Table 6: Global Calcium Peroxide Industry Volume K Tons Forecast, by Application 2019 & 2032
- Table 7: Global Calcium Peroxide Industry Revenue Billion Forecast, by End-user Industry 2019 & 2032
- Table 8: Global Calcium Peroxide Industry Volume K Tons Forecast, by End-user Industry 2019 & 2032
- Table 9: Global Calcium Peroxide Industry Revenue Billion Forecast, by Region 2019 & 2032
- Table 10: Global Calcium Peroxide Industry Volume K Tons Forecast, by Region 2019 & 2032
- Table 11: Global Calcium Peroxide Industry Revenue Billion Forecast, by Country 2019 & 2032
- Table 12: Global Calcium Peroxide Industry Volume K Tons Forecast, by Country 2019 & 2032
- Table 13: United States Calcium Peroxide Industry Revenue (Billion) Forecast, by Application 2019 & 2032
- Table 14: United States Calcium Peroxide Industry Volume (K Tons) Forecast, by Application 2019 & 2032
- Table 15: Canada Calcium Peroxide Industry Revenue (Billion) Forecast, by Application 2019 & 2032
- Table 16: Canada Calcium Peroxide Industry Volume (K Tons) Forecast, by Application 2019 & 2032
- Table 17: Mexico Calcium Peroxide Industry Revenue (Billion) Forecast, by Application 2019 & 2032
- Table 18: Mexico Calcium Peroxide Industry Volume (K Tons) Forecast, by Application 2019 & 2032
- Table 19: Global Calcium Peroxide Industry Revenue Billion Forecast, by Country 2019 & 2032
- Table 20: Global Calcium Peroxide Industry Volume K Tons Forecast, by Country 2019 & 2032
- Table 21: Germany Calcium Peroxide Industry Revenue (Billion) Forecast, by Application 2019 & 2032
- Table 22: Germany Calcium Peroxide Industry Volume (K Tons) Forecast, by Application 2019 & 2032
- Table 23: France Calcium Peroxide Industry Revenue (Billion) Forecast, by Application 2019 & 2032
- Table 24: France Calcium Peroxide Industry Volume (K Tons) Forecast, by Application 2019 & 2032
- Table 25: Italy Calcium Peroxide Industry Revenue (Billion) Forecast, by Application 2019 & 2032
- Table 26: Italy Calcium Peroxide Industry Volume (K Tons) Forecast, by Application 2019 & 2032
- Table 27: United Kingdom Calcium Peroxide Industry Revenue (Billion) Forecast, by Application 2019 & 2032
- Table 28: United Kingdom Calcium Peroxide Industry Volume (K Tons) Forecast, by Application 2019 & 2032
- Table 29: Netherlands Calcium Peroxide Industry Revenue (Billion) Forecast, by Application 2019 & 2032
- Table 30: Netherlands Calcium Peroxide Industry Volume (K Tons) Forecast, by Application 2019 & 2032
- Table 31: Rest of Europe Calcium Peroxide Industry Revenue (Billion) Forecast, by Application 2019 & 2032
- Table 32: Rest of Europe Calcium Peroxide Industry Volume (K Tons) Forecast, by Application 2019 & 2032
- Table 33: Global Calcium Peroxide Industry Revenue Billion Forecast, by Country 2019 & 2032
- Table 34: Global Calcium Peroxide Industry Volume K Tons Forecast, by Country 2019 & 2032
- Table 35: China Calcium Peroxide Industry Revenue (Billion) Forecast, by Application 2019 & 2032
- Table 36: China Calcium Peroxide Industry Volume (K Tons) Forecast, by Application 2019 & 2032
- Table 37: Japan Calcium Peroxide Industry Revenue (Billion) Forecast, by Application 2019 & 2032
- Table 38: Japan Calcium Peroxide Industry Volume (K Tons) Forecast, by Application 2019 & 2032
- Table 39: India Calcium Peroxide Industry Revenue (Billion) Forecast, by Application 2019 & 2032
- Table 40: India Calcium Peroxide Industry Volume (K Tons) Forecast, by Application 2019 & 2032
- Table 41: South Korea Calcium Peroxide Industry Revenue (Billion) Forecast, by Application 2019 & 2032
- Table 42: South Korea Calcium Peroxide Industry Volume (K Tons) Forecast, by Application 2019 & 2032
- Table 43: Taiwan Calcium Peroxide Industry Revenue (Billion) Forecast, by Application 2019 & 2032
- Table 44: Taiwan Calcium Peroxide Industry Volume (K Tons) Forecast, by Application 2019 & 2032
- Table 45: Australia Calcium Peroxide Industry Revenue (Billion) Forecast, by Application 2019 & 2032
- Table 46: Australia Calcium Peroxide Industry Volume (K Tons) Forecast, by Application 2019 & 2032
- Table 47: Rest of Asia-Pacific Calcium Peroxide Industry Revenue (Billion) Forecast, by Application 2019 & 2032
- Table 48: Rest of Asia-Pacific Calcium Peroxide Industry Volume (K Tons) Forecast, by Application 2019 & 2032
- Table 49: Global Calcium Peroxide Industry Revenue Billion Forecast, by Country 2019 & 2032
- Table 50: Global Calcium Peroxide Industry Volume K Tons Forecast, by Country 2019 & 2032
- Table 51: Brazil Calcium Peroxide Industry Revenue (Billion) Forecast, by Application 2019 & 2032
- Table 52: Brazil Calcium Peroxide Industry Volume (K Tons) Forecast, by Application 2019 & 2032
- Table 53: Argentina Calcium Peroxide Industry Revenue (Billion) Forecast, by Application 2019 & 2032
- Table 54: Argentina Calcium Peroxide Industry Volume (K Tons) Forecast, by Application 2019 & 2032
- Table 55: Rest of South America Calcium Peroxide Industry Revenue (Billion) Forecast, by Application 2019 & 2032
- Table 56: Rest of South America Calcium Peroxide Industry Volume (K Tons) Forecast, by Application 2019 & 2032
- Table 57: Global Calcium Peroxide Industry Revenue Billion Forecast, by Country 2019 & 2032
- Table 58: Global Calcium Peroxide Industry Volume K Tons Forecast, by Country 2019 & 2032
- Table 59: Middle East Calcium Peroxide Industry Revenue (Billion) Forecast, by Application 2019 & 2032
- Table 60: Middle East Calcium Peroxide Industry Volume (K Tons) Forecast, by Application 2019 & 2032
- Table 61: Africa Calcium Peroxide Industry Revenue (Billion) Forecast, by Application 2019 & 2032
- Table 62: Africa Calcium Peroxide Industry Volume (K Tons) Forecast, by Application 2019 & 2032
- Table 63: Global Calcium Peroxide Industry Revenue Billion Forecast, by Grade 2019 & 2032
- Table 64: Global Calcium Peroxide Industry Volume K Tons Forecast, by Grade 2019 & 2032
- Table 65: Global Calcium Peroxide Industry Revenue Billion Forecast, by Application 2019 & 2032
- Table 66: Global Calcium Peroxide Industry Volume K Tons Forecast, by Application 2019 & 2032
- Table 67: Global Calcium Peroxide Industry Revenue Billion Forecast, by End-user Industry 2019 & 2032
- Table 68: Global Calcium Peroxide Industry Volume K Tons Forecast, by End-user Industry 2019 & 2032
- Table 69: Global Calcium Peroxide Industry Revenue Billion Forecast, by Country 2019 & 2032
- Table 70: Global Calcium Peroxide Industry Volume K Tons Forecast, by Country 2019 & 2032
- Table 71: China Calcium Peroxide Industry Revenue (Billion) Forecast, by Application 2019 & 2032
- Table 72: China Calcium Peroxide Industry Volume (K Tons) Forecast, by Application 2019 & 2032
- Table 73: India Calcium Peroxide Industry Revenue (Billion) Forecast, by Application 2019 & 2032
- Table 74: India Calcium Peroxide Industry Volume (K Tons) Forecast, by Application 2019 & 2032
- Table 75: Japan Calcium Peroxide Industry Revenue (Billion) Forecast, by Application 2019 & 2032
- Table 76: Japan Calcium Peroxide Industry Volume (K Tons) Forecast, by Application 2019 & 2032
- Table 77: South Korea Calcium Peroxide Industry Revenue (Billion) Forecast, by Application 2019 & 2032
- Table 78: South Korea Calcium Peroxide Industry Volume (K Tons) Forecast, by Application 2019 & 2032
- Table 79: Rest of Asia Pacific Calcium Peroxide Industry Revenue (Billion) Forecast, by Application 2019 & 2032
- Table 80: Rest of Asia Pacific Calcium Peroxide Industry Volume (K Tons) Forecast, by Application 2019 & 2032
- Table 81: Global Calcium Peroxide Industry Revenue Billion Forecast, by Grade 2019 & 2032
- Table 82: Global Calcium Peroxide Industry Volume K Tons Forecast, by Grade 2019 & 2032
- Table 83: Global Calcium Peroxide Industry Revenue Billion Forecast, by Application 2019 & 2032
- Table 84: Global Calcium Peroxide Industry Volume K Tons Forecast, by Application 2019 & 2032
- Table 85: Global Calcium Peroxide Industry Revenue Billion Forecast, by End-user Industry 2019 & 2032
- Table 86: Global Calcium Peroxide Industry Volume K Tons Forecast, by End-user Industry 2019 & 2032
- Table 87: Global Calcium Peroxide Industry Revenue Billion Forecast, by Country 2019 & 2032
- Table 88: Global Calcium Peroxide Industry Volume K Tons Forecast, by Country 2019 & 2032
- Table 89: United States Calcium Peroxide Industry Revenue (Billion) Forecast, by Application 2019 & 2032
- Table 90: United States Calcium Peroxide Industry Volume (K Tons) Forecast, by Application 2019 & 2032
- Table 91: Canada Calcium Peroxide Industry Revenue (Billion) Forecast, by Application 2019 & 2032
- Table 92: Canada Calcium Peroxide Industry Volume (K Tons) Forecast, by Application 2019 & 2032
- Table 93: Mexico Calcium Peroxide Industry Revenue (Billion) Forecast, by Application 2019 & 2032
- Table 94: Mexico Calcium Peroxide Industry Volume (K Tons) Forecast, by Application 2019 & 2032
- Table 95: Global Calcium Peroxide Industry Revenue Billion Forecast, by Grade 2019 & 2032
- Table 96: Global Calcium Peroxide Industry Volume K Tons Forecast, by Grade 2019 & 2032
- Table 97: Global Calcium Peroxide Industry Revenue Billion Forecast, by Application 2019 & 2032
- Table 98: Global Calcium Peroxide Industry Volume K Tons Forecast, by Application 2019 & 2032
- Table 99: Global Calcium Peroxide Industry Revenue Billion Forecast, by End-user Industry 2019 & 2032
- Table 100: Global Calcium Peroxide Industry Volume K Tons Forecast, by End-user Industry 2019 & 2032
- Table 101: Global Calcium Peroxide Industry Revenue Billion Forecast, by Country 2019 & 2032
- Table 102: Global Calcium Peroxide Industry Volume K Tons Forecast, by Country 2019 & 2032
- Table 103: Germany Calcium Peroxide Industry Revenue (Billion) Forecast, by Application 2019 & 2032
- Table 104: Germany Calcium Peroxide Industry Volume (K Tons) Forecast, by Application 2019 & 2032
- Table 105: United Kingdom Calcium Peroxide Industry Revenue (Billion) Forecast, by Application 2019 & 2032
- Table 106: United Kingdom Calcium Peroxide Industry Volume (K Tons) Forecast, by Application 2019 & 2032
- Table 107: Italy Calcium Peroxide Industry Revenue (Billion) Forecast, by Application 2019 & 2032
- Table 108: Italy Calcium Peroxide Industry Volume (K Tons) Forecast, by Application 2019 & 2032
- Table 109: France Calcium Peroxide Industry Revenue (Billion) Forecast, by Application 2019 & 2032
- Table 110: France Calcium Peroxide Industry Volume (K Tons) Forecast, by Application 2019 & 2032
- Table 111: Rest of Europe Calcium Peroxide Industry Revenue (Billion) Forecast, by Application 2019 & 2032
- Table 112: Rest of Europe Calcium Peroxide Industry Volume (K Tons) Forecast, by Application 2019 & 2032
- Table 113: Global Calcium Peroxide Industry Revenue Billion Forecast, by Grade 2019 & 2032
- Table 114: Global Calcium Peroxide Industry Volume K Tons Forecast, by Grade 2019 & 2032
- Table 115: Global Calcium Peroxide Industry Revenue Billion Forecast, by Application 2019 & 2032
- Table 116: Global Calcium Peroxide Industry Volume K Tons Forecast, by Application 2019 & 2032
- Table 117: Global Calcium Peroxide Industry Revenue Billion Forecast, by End-user Industry 2019 & 2032
- Table 118: Global Calcium Peroxide Industry Volume K Tons Forecast, by End-user Industry 2019 & 2032
- Table 119: Global Calcium Peroxide Industry Revenue Billion Forecast, by Country 2019 & 2032
- Table 120: Global Calcium Peroxide Industry Volume K Tons Forecast, by Country 2019 & 2032
- Table 121: Brazil Calcium Peroxide Industry Revenue (Billion) Forecast, by Application 2019 & 2032
- Table 122: Brazil Calcium Peroxide Industry Volume (K Tons) Forecast, by Application 2019 & 2032
- Table 123: Argentina Calcium Peroxide Industry Revenue (Billion) Forecast, by Application 2019 & 2032
- Table 124: Argentina Calcium Peroxide Industry Volume (K Tons) Forecast, by Application 2019 & 2032
- Table 125: Rest of South America Calcium Peroxide Industry Revenue (Billion) Forecast, by Application 2019 & 2032
- Table 126: Rest of South America Calcium Peroxide Industry Volume (K Tons) Forecast, by Application 2019 & 2032
- Table 127: Global Calcium Peroxide Industry Revenue Billion Forecast, by Grade 2019 & 2032
- Table 128: Global Calcium Peroxide Industry Volume K Tons Forecast, by Grade 2019 & 2032
- Table 129: Global Calcium Peroxide Industry Revenue Billion Forecast, by Application 2019 & 2032
- Table 130: Global Calcium Peroxide Industry Volume K Tons Forecast, by Application 2019 & 2032
- Table 131: Global Calcium Peroxide Industry Revenue Billion Forecast, by End-user Industry 2019 & 2032
- Table 132: Global Calcium Peroxide Industry Volume K Tons Forecast, by End-user Industry 2019 & 2032
- Table 133: Global Calcium Peroxide Industry Revenue Billion Forecast, by Country 2019 & 2032
- Table 134: Global Calcium Peroxide Industry Volume K Tons Forecast, by Country 2019 & 2032
- Table 135: Saudi Arabia Calcium Peroxide Industry Revenue (Billion) Forecast, by Application 2019 & 2032
- Table 136: Saudi Arabia Calcium Peroxide Industry Volume (K Tons) Forecast, by Application 2019 & 2032
- Table 137: South Africa Calcium Peroxide Industry Revenue (Billion) Forecast, by Application 2019 & 2032
- Table 138: South Africa Calcium Peroxide Industry Volume (K Tons) Forecast, by Application 2019 & 2032
- Table 139: Rest of Middle East and Africa Calcium Peroxide Industry Revenue (Billion) Forecast, by Application 2019 & 2032
- Table 140: Rest of Middle East and Africa Calcium Peroxide Industry Volume (K Tons) Forecast, by Application 2019 & 2032
Frequently Asked Questions
1. What is the projected Compound Annual Growth Rate (CAGR) of the Calcium Peroxide Industry?
The projected CAGR is approximately 3.64%.
2. Which companies are prominent players in the Calcium Peroxide Industry?
Key companies in the market include Nikunj Chemicals, Pioneer Enterprise, American Elements, Carus Group Inc, PeroxyChem, Sunway Lab, Zhengzhou Huize Biochemical Technology Co Ltd, Solvay SA, Mahalaxmi Enterprise, Shangyu Jie Hua Chemical Co, STP Chem Solutions Co Ltd, Noshly Pty Ltd.
3. What are the main segments of the Calcium Peroxide Industry?
The market segments include Grade, Application, End-user Industry.
4. Can you provide details about the market size?
The market size is estimated to be USD 2.36 Billion as of 2022.
5. What are some drivers contributing to market growth?
; Increase in Utilization as Dough Conditioner in the Food Industry; Increase in Usage in the Oral Care Industry.
6. What are the notable trends driving market growth?
Increasing Demand from Food and Beverage Industry.
7. Are there any restraints impacting market growth?
; Potential Hazardous Effects of Calcium Peroxide.
8. Can you provide examples of recent developments in the market?
N/A
9. What pricing options are available for accessing the report?
Pricing options include single-user, multi-user, and enterprise licenses priced at USD 4750, USD 5250, and USD 8750 respectively.
10. Is the market size provided in terms of value or volume?
The market size is provided in terms of value, measured in Billion and volume, measured in K Tons.
11. Are there any specific market keywords associated with the report?
Yes, the market keyword associated with the report is "Calcium Peroxide Industry," which aids in identifying and referencing the specific market segment covered.
12. How do I determine which pricing option suits my needs best?
The pricing options vary based on user requirements and access needs. Individual users may opt for single-user licenses, while businesses requiring broader access may choose multi-user or enterprise licenses for cost-effective access to the report.
13. Are there any additional resources or data provided in the Calcium Peroxide Industry report?
While the report offers comprehensive insights, it's advisable to review the specific contents or supplementary materials provided to ascertain if additional resources or data are available.
14. How can I stay updated on further developments or reports in the Calcium Peroxide Industry?
To stay informed about further developments, trends, and reports in the Calcium Peroxide Industry, consider subscribing to industry newsletters, following relevant companies and organizations, or regularly checking reputable industry news sources and publications.
Methodology
Step 1 - Identification of Relevant Samples Size from Population Database


Step 2 - Approaches for Defining Global Market Size (Value, Volume* & Price*)

Note*: In applicable scenarios
Step 3 - Data Sources
Primary Research
- Web Analytics
- Survey Reports
- Research Institute
- Latest Research Reports
- Opinion Leaders
Secondary Research
- Annual Reports
- White Paper
- Latest Press Release
- Industry Association
- Paid Database
- Investor Presentations

Step 4 - Data Triangulation
Involves using different sources of information in order to increase the validity of a study
These sources are likely to be stakeholders in a program - participants, other researchers, program staff, other community members, and so on.
Then we put all data in single framework & apply various statistical tools to find out the dynamic on the market.
During the analysis stage, feedback from the stakeholder groups would be compared to determine areas of agreement as well as areas of divergence


