

Key Insights
The global calcium propionate market is demonstrating robust growth, primarily driven by its widespread use as an effective food preservative in the bakery and dairy sectors. The market's projected Compound Annual Growth Rate (CAGR) of 6.1% indicates a strong upward trend, anticipated to continue through 2033. Key growth catalysts include escalating demand for processed foods with extended shelf life, a rising global population requiring enhanced food production and preservation, and stringent food safety regulations that favor natural preservatives like calcium propionate. The pharmaceutical industry also contributes significantly, capitalizing on its antifungal and antimicrobial properties. With a 2025 estimated market size of $383.54 million, the market is poised for sustained expansion. Market segmentation highlights the food and beverage sector as the dominant contributor, followed by pharmaceutical and animal feed applications. Geographically, North America, Europe, and Asia Pacific are key regions, with China and India emerging as significant markets within the Asia Pacific. Potential restraints include fluctuating raw material prices and the emergence of alternative preservatives. The competitive landscape is fragmented, featuring prominent companies such as Henan Chemsino Industry Co Ltd, Puratos, and Kemin Industries Inc., actively engaging in innovation and strategic partnerships.
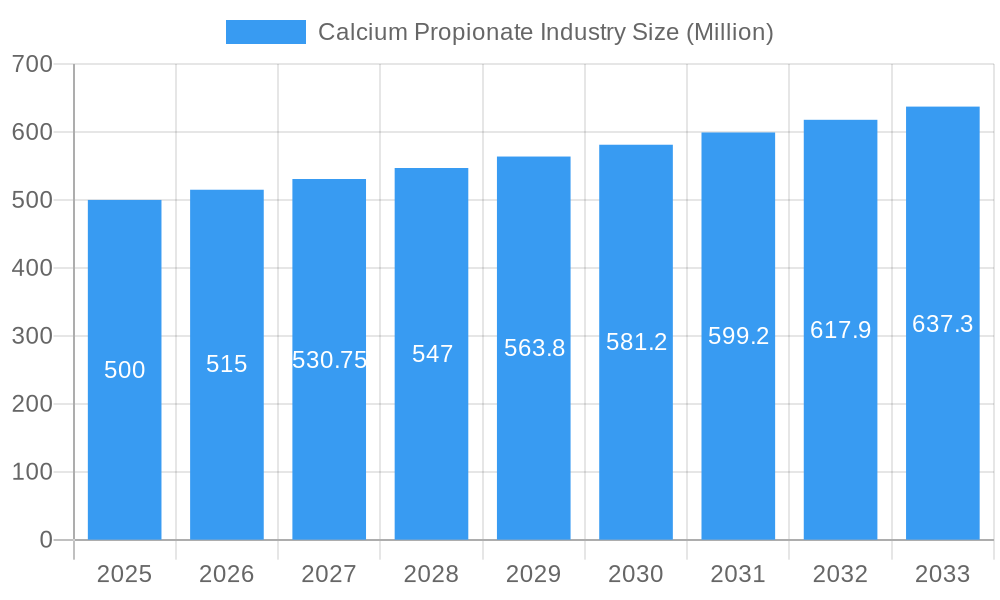
Calcium Propionate Industry Market Size (In Million)
The calcium propionate market's future outlook is highly promising, supported by continuous expansion in food processing, increasing consumer preference for convenience foods, and an unwavering commitment to food safety. Industry players are expected to prioritize the development of sustainable and cost-effective production methods, alongside exploring novel applications to broaden market penetration. Regional expansion, particularly in emerging economies with burgeoning food industries, will be critical for sustained market growth. The potential for increased adoption in niche segments, such as personal care products, may further contribute to market expansion in the coming years. Successfully navigating challenges related to raw material costs and evolving regulatory landscapes will be paramount for industry participants seeking sustained market success.
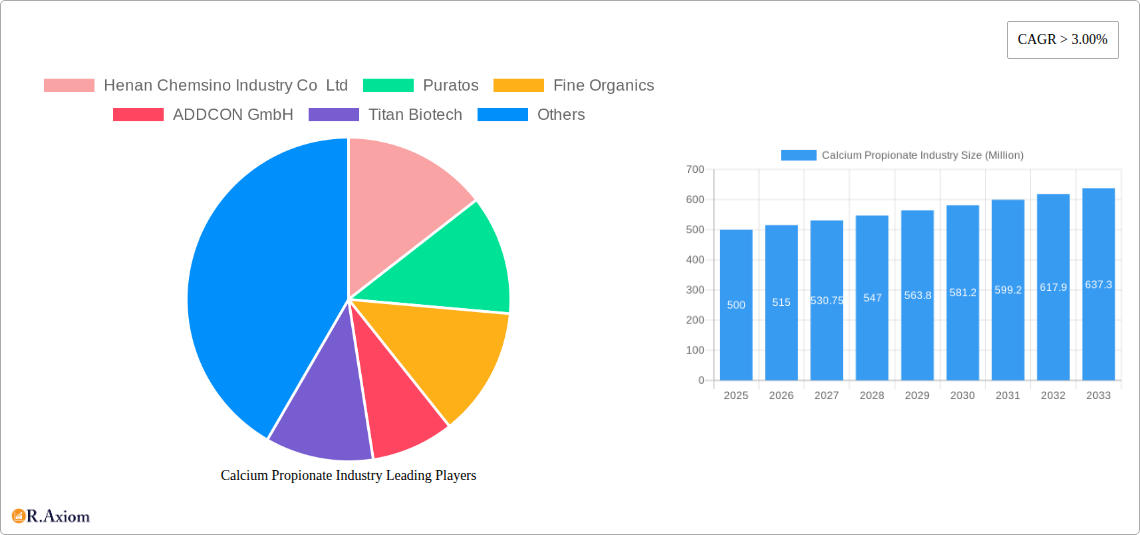
Calcium Propionate Industry Company Market Share
This comprehensive report offers an in-depth analysis of the global calcium propionate industry, covering market size, segmentation, key players, growth drivers, challenges, and future opportunities. The study period spans from 2019 to 2033, with 2025 identified as the base year. This research is invaluable for industry stakeholders, investors, and businesses aiming to understand and capitalize on the dynamic evolution of this essential market.
Calcium Propionate Industry Market Concentration & Innovation
The calcium propionate market exhibits a moderately concentrated landscape, with several major players holding significant market share. While precise market share figures for each company are not publicly available and would require primary research to determine accurately, we estimate that the top 10 companies account for approximately 70% of the global market, with smaller players contributing to the remaining 30%. This concentration is partly due to the significant capital investment required for production and the established distribution networks of major players.
Innovation within the industry is driven by the increasing demand for clean-label and natural preservatives. Regulatory pressures to reduce the use of synthetic additives further stimulate innovation, leading to the development of new production methods and alternative preservative solutions. Recent mergers and acquisitions (M&A) activities, although specific deal values are unavailable (xx Million) , indicate consolidation within the industry. Companies are seeking to expand their product portfolios, geographic reach, and production capacity through these strategic alliances. Key M&A activities are difficult to analyze fully without dedicated market research and specific company disclosures. The regulatory landscape varies across regions, influencing both product formulations and market access. The increasing preference for natural preservatives creates opportunities for companies focusing on sustainable and eco-friendly production methods. Finally, consumer demand for longer shelf-life products in the food and beverage sector fuels innovation in calcium propionate applications.
Calcium Propionate Industry Industry Trends & Insights
The global calcium propionate market is projected to experience robust growth throughout the forecast period (2025-2033). Driven by rising demand from the food and beverage, animal feed, and pharmaceutical sectors, we project a Compound Annual Growth Rate (CAGR) of approximately xx% during this period. This growth reflects the increasing consumer preference for processed foods with extended shelf life, creating high demand for effective preservatives like calcium propionate. The market penetration rate is already high in developed regions, but significant growth potential exists in emerging economies with developing food processing industries. Technological advancements in production processes have also improved efficiency and reduced costs, further boosting market expansion. However, growing awareness of artificial preservatives' potential health effects poses a challenge, requiring manufacturers to emphasize the safety and efficacy of calcium propionate. The increasing adoption of clean-label practices in food production presents both an opportunity and a challenge, prompting innovation in production methods. Intense competition among key players necessitates continuous product development and strategic partnerships to maintain market share.
Dominant Markets & Segments in Calcium Propionate Industry
The food and beverage segment represents the largest application area for calcium propionate, accounting for the lion's share of global demand (estimated at xx Million). This dominance is fueled by the significant role of calcium propionate in extending the shelf life of baked goods, dairy products, and other processed foods.
- Key Drivers for Food & Beverage Dominance:
- Growing demand for processed and convenient foods
- Increasing consumer preference for longer shelf-life products
- Stringent food safety regulations promoting the use of preservatives
- Well-established distribution channels for calcium propionate in the food industry
The animal feed segment also shows strong growth potential, driven by the increasing demand for animal protein globally. Pharmaceutical applications are relatively smaller but exhibit a steady growth trajectory. The personal care segment displays relatively limited use but could see future growth with the development of novel formulations. Other applications, including industrial uses, make up a smaller but significant portion of the total market. Regional dominance varies; developed regions with robust food processing industries (e.g., North America, Europe) currently hold larger market shares, while emerging markets in Asia and Latin America exhibit significant growth potential due to rapidly expanding food and beverage industries.
Calcium Propionate Industry Product Developments
Recent advancements focus on developing calcium propionate with improved functionality and cleaner labels. The development of cultured calcium propionate, as seen with BioVeritas' innovation, provides a more natural alternative, attracting health-conscious consumers and meeting the increasing demand for clean-label ingredients. This represents a significant shift toward sustainable and eco-friendly solutions within the industry, enhancing market fit and competitiveness.
Report Scope & Segmentation Analysis
This report segments the calcium propionate market based on application:
Pharmaceutical: This segment utilizes calcium propionate for its antifungal and antimicrobial properties in various pharmaceutical formulations. Growth is projected to be moderate, driven by the pharmaceutical industry's demand for effective and safe preservatives. Market size is estimated at xx Million in 2025.
Food and Beverage: This segment dominates the market, with growth driven by the increasing demand for processed and packaged foods. Market size is estimated at xx Million in 2025, showing substantial growth potential in the forecast period.
Animal Feed: This segment exhibits significant growth potential, fueled by the increasing global demand for animal protein. The market is expected to grow at xx Million in 2025, driven by the need for effective preservation in animal feed.
Personal Care: This segment's adoption is currently limited, but innovations in natural preservatives might expand its use. The market size is estimated at xx Million in 2025.
Other Applications: This segment includes various industrial applications for calcium propionate and accounts for a smaller portion of the overall market. The market size is estimated at xx Million in 2025.
Key Drivers of Calcium Propionate Industry Growth
The calcium propionate industry’s growth is driven by several factors. Firstly, the ever-increasing demand for processed foods and extended shelf life products fuels the need for effective preservatives. Secondly, the expanding animal feed industry creates a substantial demand for calcium propionate to ensure the quality and safety of animal feed. Finally, technological advances in production, leading to cost reductions and higher efficiency, also stimulate market growth.
Challenges in the Calcium Propionate Industry Sector
The industry faces challenges, including fluctuating raw material prices, which directly impact production costs. Stricter food safety regulations require companies to invest in compliance, and consumer preference for natural alternatives creates competitive pressure. Supply chain disruptions can affect production and delivery schedules, influencing market stability. The projected impact of these challenges on overall market growth is difficult to quantify precisely, requiring advanced market analysis (estimated at xx% reduction in potential growth).
Emerging Opportunities in Calcium Propionate Industry
Emerging opportunities include the growing demand for clean-label and naturally derived preservatives, creating a demand for innovative and sustainable production methods. The expansion of the food processing industry in developing economies presents a significant growth opportunity. Moreover, research and development efforts focusing on novel applications and improved formulations can create new market niches.
Leading Players in the Calcium Propionate Industry Market
- Henan Chemsino Industry Co Ltd
- Puratos
- Fine Organics
- ADDCON GmbH
- Titan Biotech
- Pestell Nutrition Inc
- Agailenobel
- Perstorp Holding AB
- Jainex Speciality Chemicals
- Impextraco NV
- Kemin Industries Inc
- Niacet A Kerry Company
- Macco Organiques Inc
- BioVeritas
Key Developments in Calcium Propionate Industry Industry
March 2023: BioVeritas invented a clean-label mold inhibitor using its proprietary BioVeritas Process. This cultured calcium propionate extract extends shelf life by nearly 30%, challenging traditional petrochemical-derived alternatives and disrupting the market.
April 2022: Perstorp announced plans to increase carboxylic acid production capacity by 70,000 tons/year, significantly boosting its calcium propionate output starting as early as 2024. This expansion indicates confidence in the market's future growth and potential for increased competition.
Strategic Outlook for Calcium Propionate Industry Market
The calcium propionate market is poised for continued growth, driven by increasing demand from key application segments and the ongoing development of innovative, sustainable products. The focus on clean-label alternatives presents significant opportunities for companies that can deliver high-quality, naturally derived preservatives. The market's future success hinges on adapting to evolving consumer preferences and regulatory landscapes, emphasizing sustainability and innovation.
Calcium Propionate Industry Segmentation
-
1. Application
- 1.1. Pharmaceutical
- 1.2. Food and Beverage
- 1.3. Animal Feed
- 1.4. Personal Care
- 1.5. Other Applications
Calcium Propionate Industry Segmentation By Geography
-
1. Asia Pacific
- 1.1. China
- 1.2. India
- 1.3. Japan
- 1.4. South Korea
- 1.5. Rest of Asia Pacific
-
2. North America
- 2.1. United States
- 2.2. Canada
- 2.3. Mexico
-
3. Europe
- 3.1. Germany
- 3.2. United Kingdom
- 3.3. Italy
- 3.4. France
- 3.5. Rest of Europe
-
4. South America
- 4.1. Brazil
- 4.2. Argentina
- 4.3. Rest of South America
-
5. Middle East and Africa
- 5.1. Saudi Arabia
- 5.2. South Africa
- 5.3. Rest of Middle East and Africa
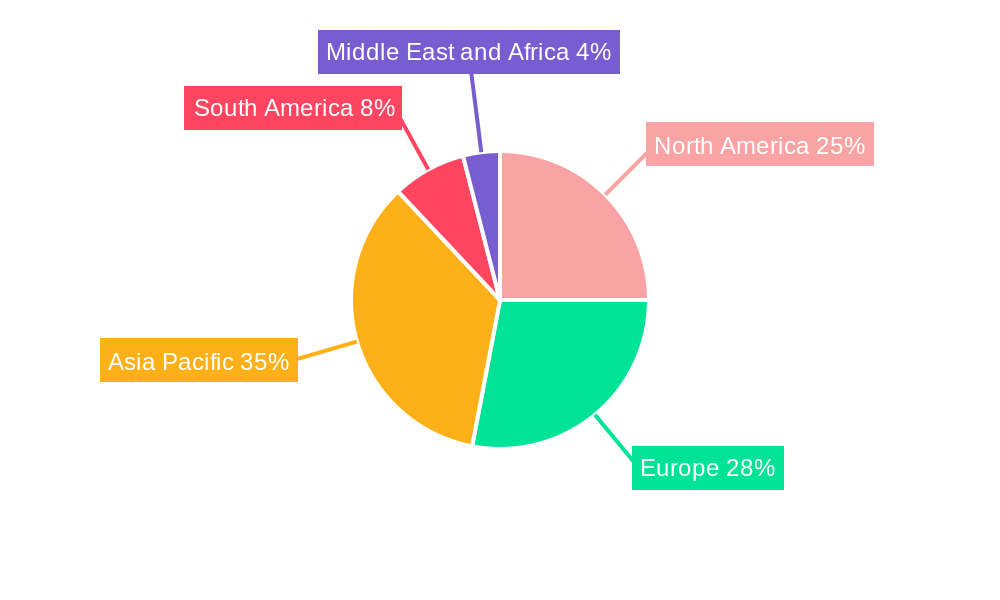
Calcium Propionate Industry Regional Market Share
Geographic Coverage of Calcium Propionate Industry
Calcium Propionate Industry REPORT HIGHLIGHTS
| Aspects | Details |
|---|---|
| Study Period | 2020-2034 |
| Base Year | 2025 |
| Estimated Year | 2026 |
| Forecast Period | 2026-2034 |
| Historical Period | 2020-2025 |
| Growth Rate | CAGR of 6.1% from 2020-2034 |
| Segmentation |
|
Table of Contents
- 1. Introduction
- 1.1. Research Scope
- 1.2. Market Segmentation
- 1.3. Research Objective
- 1.4. Definitions and Assumptions
- 2. Executive Summary
- 2.1. Market Snapshot
- 3. Market Dynamics
- 3.1. Market Drivers
- 3.2. Market Restrains
- 3.3. Market Trends
- 3.4. Market Opportunities
- 4. Market Factor Analysis
- 4.1. Porters Five Forces
- 4.1.1. Bargaining Power of Suppliers
- 4.1.2. Bargaining Power of Buyers
- 4.1.3. Threat of New Entrants
- 4.1.4. Threat of Substitutes
- 4.1.5. Competitive Rivalry
- 4.2. PESTEL analysis
- 4.3. BCG Analysis
- 4.3.1. Stars (High Growth, High Market Share)
- 4.3.2. Cash Cows (Low Growth, High Market Share)
- 4.3.3. Question Mark (High Growth, Low Market Share)
- 4.3.4. Dogs (Low Growth, Low Market Share)
- 4.4. Ansoff Matrix Analysis
- 4.5. Supply Chain Analysis
- 4.6. Regulatory Landscape
- 4.7. Current Market Potential and Opportunity Assessment (TAM–SAM–SOM Framework)
- 4.8. RAX Analyst Note
- 4.1. Porters Five Forces
- 5. Market Analysis, Insights and Forecast 2021-2033
- 5.1. Market Analysis, Insights and Forecast - by Application
- 5.1.1. Pharmaceutical
- 5.1.2. Food and Beverage
- 5.1.3. Animal Feed
- 5.1.4. Personal Care
- 5.1.5. Other Applications
- 5.2. Market Analysis, Insights and Forecast - by Region
- 5.2.1. Asia Pacific
- 5.2.2. North America
- 5.2.3. Europe
- 5.2.4. South America
- 5.2.5. Middle East and Africa
- 5.1. Market Analysis, Insights and Forecast - by Application
- 6. Global Calcium Propionate Industry Analysis, Insights and Forecast, 2021-2033
- 6.1. Market Analysis, Insights and Forecast - by Application
- 6.1.1. Pharmaceutical
- 6.1.2. Food and Beverage
- 6.1.3. Animal Feed
- 6.1.4. Personal Care
- 6.1.5. Other Applications
- 6.1. Market Analysis, Insights and Forecast - by Application
- 7. Asia Pacific Calcium Propionate Industry Analysis, Insights and Forecast, 2020-2032
- 7.1. Market Analysis, Insights and Forecast - by Application
- 7.1.1. Pharmaceutical
- 7.1.2. Food and Beverage
- 7.1.3. Animal Feed
- 7.1.4. Personal Care
- 7.1.5. Other Applications
- 7.1. Market Analysis, Insights and Forecast - by Application
- 8. North America Calcium Propionate Industry Analysis, Insights and Forecast, 2020-2032
- 8.1. Market Analysis, Insights and Forecast - by Application
- 8.1.1. Pharmaceutical
- 8.1.2. Food and Beverage
- 8.1.3. Animal Feed
- 8.1.4. Personal Care
- 8.1.5. Other Applications
- 8.1. Market Analysis, Insights and Forecast - by Application
- 9. Europe Calcium Propionate Industry Analysis, Insights and Forecast, 2020-2032
- 9.1. Market Analysis, Insights and Forecast - by Application
- 9.1.1. Pharmaceutical
- 9.1.2. Food and Beverage
- 9.1.3. Animal Feed
- 9.1.4. Personal Care
- 9.1.5. Other Applications
- 9.1. Market Analysis, Insights and Forecast - by Application
- 10. South America Calcium Propionate Industry Analysis, Insights and Forecast, 2020-2032
- 10.1. Market Analysis, Insights and Forecast - by Application
- 10.1.1. Pharmaceutical
- 10.1.2. Food and Beverage
- 10.1.3. Animal Feed
- 10.1.4. Personal Care
- 10.1.5. Other Applications
- 10.1. Market Analysis, Insights and Forecast - by Application
- 11. Middle East and Africa Calcium Propionate Industry Analysis, Insights and Forecast, 2020-2032
- 11.1. Market Analysis, Insights and Forecast - by Application
- 11.1.1. Pharmaceutical
- 11.1.2. Food and Beverage
- 11.1.3. Animal Feed
- 11.1.4. Personal Care
- 11.1.5. Other Applications
- 11.1. Market Analysis, Insights and Forecast - by Application
- 12. Competitive Analysis
- 12.1. Company Profiles
- 12.1.1 Henan Chemsino Industry Co Ltd
- 12.1.1.1. Company Overview
- 12.1.1.2. Products
- 12.1.1.3. Company Financials
- 12.1.1.4. SWOT Analysis
- 12.1.2 Puratos
- 12.1.2.1. Company Overview
- 12.1.2.2. Products
- 12.1.2.3. Company Financials
- 12.1.2.4. SWOT Analysis
- 12.1.3 Fine Organics
- 12.1.3.1. Company Overview
- 12.1.3.2. Products
- 12.1.3.3. Company Financials
- 12.1.3.4. SWOT Analysis
- 12.1.4 ADDCON GmbH
- 12.1.4.1. Company Overview
- 12.1.4.2. Products
- 12.1.4.3. Company Financials
- 12.1.4.4. SWOT Analysis
- 12.1.5 Titan Biotech
- 12.1.5.1. Company Overview
- 12.1.5.2. Products
- 12.1.5.3. Company Financials
- 12.1.5.4. SWOT Analysis
- 12.1.6 Pestell Nutrition Inc
- 12.1.6.1. Company Overview
- 12.1.6.2. Products
- 12.1.6.3. Company Financials
- 12.1.6.4. SWOT Analysis
- 12.1.7 Agailenobel
- 12.1.7.1. Company Overview
- 12.1.7.2. Products
- 12.1.7.3. Company Financials
- 12.1.7.4. SWOT Analysis
- 12.1.8 Perstorp Holding AB
- 12.1.8.1. Company Overview
- 12.1.8.2. Products
- 12.1.8.3. Company Financials
- 12.1.8.4. SWOT Analysis
- 12.1.9 Jainex Speciality Chemicals
- 12.1.9.1. Company Overview
- 12.1.9.2. Products
- 12.1.9.3. Company Financials
- 12.1.9.4. SWOT Analysis
- 12.1.10 Impextraco NV
- 12.1.10.1. Company Overview
- 12.1.10.2. Products
- 12.1.10.3. Company Financials
- 12.1.10.4. SWOT Analysis
- 12.1.11 Kemin Industries Inc
- 12.1.11.1. Company Overview
- 12.1.11.2. Products
- 12.1.11.3. Company Financials
- 12.1.11.4. SWOT Analysis
- 12.1.12 Niacet A Kerry Company
- 12.1.12.1. Company Overview
- 12.1.12.2. Products
- 12.1.12.3. Company Financials
- 12.1.12.4. SWOT Analysis
- 12.1.13 Macco Organiques Inc
- 12.1.13.1. Company Overview
- 12.1.13.2. Products
- 12.1.13.3. Company Financials
- 12.1.13.4. SWOT Analysis
- 12.1.14 BioVeritas*List Not Exhaustive
- 12.1.14.1. Company Overview
- 12.1.14.2. Products
- 12.1.14.3. Company Financials
- 12.1.14.4. SWOT Analysis
- 12.1.1 Henan Chemsino Industry Co Ltd
- 12.2. Market Entropy
- 12.2.1 Company's Key Areas Served
- 12.2.2 Recent Developments
- 12.3. Company Market Share Analysis 2025
- 12.3.1 Top 5 Companies Market Share Analysis
- 12.3.2 Top 3 Companies Market Share Analysis
- 12.4. List of Potential Customers
- 13. Research Methodology
List of Figures
- Figure 1: Global Calcium Propionate Industry Revenue Breakdown (million, %) by Region 2025 & 2033
- Figure 2: Asia Pacific Calcium Propionate Industry Revenue (million), by Application 2025 & 2033
- Figure 3: Asia Pacific Calcium Propionate Industry Revenue Share (%), by Application 2025 & 2033
- Figure 4: Asia Pacific Calcium Propionate Industry Revenue (million), by Country 2025 & 2033
- Figure 5: Asia Pacific Calcium Propionate Industry Revenue Share (%), by Country 2025 & 2033
- Figure 6: North America Calcium Propionate Industry Revenue (million), by Application 2025 & 2033
- Figure 7: North America Calcium Propionate Industry Revenue Share (%), by Application 2025 & 2033
- Figure 8: North America Calcium Propionate Industry Revenue (million), by Country 2025 & 2033
- Figure 9: North America Calcium Propionate Industry Revenue Share (%), by Country 2025 & 2033
- Figure 10: Europe Calcium Propionate Industry Revenue (million), by Application 2025 & 2033
- Figure 11: Europe Calcium Propionate Industry Revenue Share (%), by Application 2025 & 2033
- Figure 12: Europe Calcium Propionate Industry Revenue (million), by Country 2025 & 2033
- Figure 13: Europe Calcium Propionate Industry Revenue Share (%), by Country 2025 & 2033
- Figure 14: South America Calcium Propionate Industry Revenue (million), by Application 2025 & 2033
- Figure 15: South America Calcium Propionate Industry Revenue Share (%), by Application 2025 & 2033
- Figure 16: South America Calcium Propionate Industry Revenue (million), by Country 2025 & 2033
- Figure 17: South America Calcium Propionate Industry Revenue Share (%), by Country 2025 & 2033
- Figure 18: Middle East and Africa Calcium Propionate Industry Revenue (million), by Application 2025 & 2033
- Figure 19: Middle East and Africa Calcium Propionate Industry Revenue Share (%), by Application 2025 & 2033
- Figure 20: Middle East and Africa Calcium Propionate Industry Revenue (million), by Country 2025 & 2033
- Figure 21: Middle East and Africa Calcium Propionate Industry Revenue Share (%), by Country 2025 & 2033
List of Tables
- Table 1: Global Calcium Propionate Industry Revenue million Forecast, by Application 2020 & 2033
- Table 2: Global Calcium Propionate Industry Revenue million Forecast, by Region 2020 & 2033
- Table 3: Global Calcium Propionate Industry Revenue million Forecast, by Application 2020 & 2033
- Table 4: Global Calcium Propionate Industry Revenue million Forecast, by Country 2020 & 2033
- Table 5: China Calcium Propionate Industry Revenue (million) Forecast, by Application 2020 & 2033
- Table 6: India Calcium Propionate Industry Revenue (million) Forecast, by Application 2020 & 2033
- Table 7: Japan Calcium Propionate Industry Revenue (million) Forecast, by Application 2020 & 2033
- Table 8: South Korea Calcium Propionate Industry Revenue (million) Forecast, by Application 2020 & 2033
- Table 9: Rest of Asia Pacific Calcium Propionate Industry Revenue (million) Forecast, by Application 2020 & 2033
- Table 10: Global Calcium Propionate Industry Revenue million Forecast, by Application 2020 & 2033
- Table 11: Global Calcium Propionate Industry Revenue million Forecast, by Country 2020 & 2033
- Table 12: United States Calcium Propionate Industry Revenue (million) Forecast, by Application 2020 & 2033
- Table 13: Canada Calcium Propionate Industry Revenue (million) Forecast, by Application 2020 & 2033
- Table 14: Mexico Calcium Propionate Industry Revenue (million) Forecast, by Application 2020 & 2033
- Table 15: Global Calcium Propionate Industry Revenue million Forecast, by Application 2020 & 2033
- Table 16: Global Calcium Propionate Industry Revenue million Forecast, by Country 2020 & 2033
- Table 17: Germany Calcium Propionate Industry Revenue (million) Forecast, by Application 2020 & 2033
- Table 18: United Kingdom Calcium Propionate Industry Revenue (million) Forecast, by Application 2020 & 2033
- Table 19: Italy Calcium Propionate Industry Revenue (million) Forecast, by Application 2020 & 2033
- Table 20: France Calcium Propionate Industry Revenue (million) Forecast, by Application 2020 & 2033
- Table 21: Rest of Europe Calcium Propionate Industry Revenue (million) Forecast, by Application 2020 & 2033
- Table 22: Global Calcium Propionate Industry Revenue million Forecast, by Application 2020 & 2033
- Table 23: Global Calcium Propionate Industry Revenue million Forecast, by Country 2020 & 2033
- Table 24: Brazil Calcium Propionate Industry Revenue (million) Forecast, by Application 2020 & 2033
- Table 25: Argentina Calcium Propionate Industry Revenue (million) Forecast, by Application 2020 & 2033
- Table 26: Rest of South America Calcium Propionate Industry Revenue (million) Forecast, by Application 2020 & 2033
- Table 27: Global Calcium Propionate Industry Revenue million Forecast, by Application 2020 & 2033
- Table 28: Global Calcium Propionate Industry Revenue million Forecast, by Country 2020 & 2033
- Table 29: Saudi Arabia Calcium Propionate Industry Revenue (million) Forecast, by Application 2020 & 2033
- Table 30: South Africa Calcium Propionate Industry Revenue (million) Forecast, by Application 2020 & 2033
- Table 31: Rest of Middle East and Africa Calcium Propionate Industry Revenue (million) Forecast, by Application 2020 & 2033
Frequently Asked Questions
1. What is the projected Compound Annual Growth Rate (CAGR) of the Calcium Propionate Industry?
The projected CAGR is approximately 6.1%.
2. Which companies are prominent players in the Calcium Propionate Industry?
Key companies in the market include Henan Chemsino Industry Co Ltd, Puratos, Fine Organics, ADDCON GmbH, Titan Biotech, Pestell Nutrition Inc, Agailenobel, Perstorp Holding AB, Jainex Speciality Chemicals, Impextraco NV, Kemin Industries Inc, Niacet A Kerry Company, Macco Organiques Inc, BioVeritas*List Not Exhaustive.
3. What are the main segments of the Calcium Propionate Industry?
The market segments include Application.
4. Can you provide details about the market size?
The market size is estimated to be USD 383.54 million as of 2022.
5. What are some drivers contributing to market growth?
Increasing Demand for Food Additives; Other Drivers.
6. What are the notable trends driving market growth?
Increasing Demand from the Food and Beverage Sector.
7. Are there any restraints impacting market growth?
Growing Demand for Preservative-less Food Products; Other Restraints.
8. Can you provide examples of recent developments in the market?
March 2023: BioVeritas invented a clean-label mold inhibitor created through the BioVeritas Process. The BioVeritas calcium propionate cultured extract extended its shelf life by an average of nearly 30% compared to petrochemical-derived calcium propionate.
9. What pricing options are available for accessing the report?
Pricing options include single-user, multi-user, and enterprise licenses priced at USD 4750, USD 5250, and USD 8750 respectively.
10. Is the market size provided in terms of value or volume?
The market size is provided in terms of value, measured in million.
11. Are there any specific market keywords associated with the report?
Yes, the market keyword associated with the report is "Calcium Propionate Industry," which aids in identifying and referencing the specific market segment covered.
12. How do I determine which pricing option suits my needs best?
The pricing options vary based on user requirements and access needs. Individual users may opt for single-user licenses, while businesses requiring broader access may choose multi-user or enterprise licenses for cost-effective access to the report.
13. Are there any additional resources or data provided in the Calcium Propionate Industry report?
While the report offers comprehensive insights, it's advisable to review the specific contents or supplementary materials provided to ascertain if additional resources or data are available.
14. How can I stay updated on further developments or reports in the Calcium Propionate Industry?
To stay informed about further developments, trends, and reports in the Calcium Propionate Industry, consider subscribing to industry newsletters, following relevant companies and organizations, or regularly checking reputable industry news sources and publications.
Methodology
Step 1 - Identification of Relevant Samples Size from Population Database


Step 2 - Approaches for Defining Global Market Size (Value, Volume* & Price*)

Note*: In applicable scenarios
Step 3 - Data Sources
Primary Research
- Web Analytics
- Survey Reports
- Research Institute
- Latest Research Reports
- Opinion Leaders
Secondary Research
- Annual Reports
- White Paper
- Latest Press Release
- Industry Association
- Paid Database
- Investor Presentations

Step 4 - Data Triangulation
Involves using different sources of information in order to increase the validity of a study
These sources are likely to be stakeholders in a program - participants, other researchers, program staff, other community members, and so on.
Then we put all data in single framework & apply various statistical tools to find out the dynamic on the market.
During the analysis stage, feedback from the stakeholder groups would be compared to determine areas of agreement as well as areas of divergence