

Key Insights
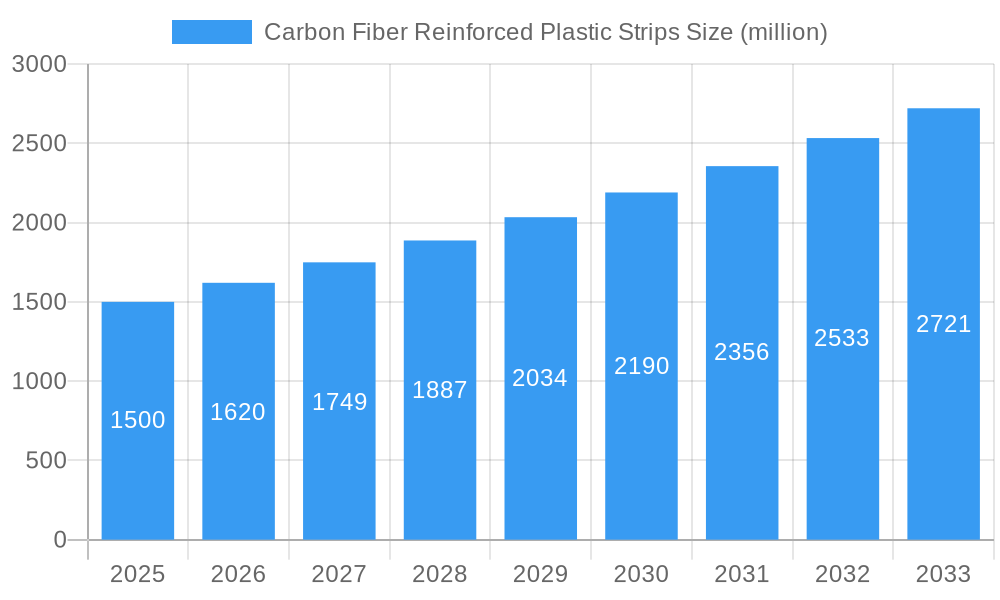
The global market for carbon fiber reinforced plastic (CFRP) strips is experiencing robust growth, driven by increasing demand across diverse sectors. The automotive industry, a major consumer, is leveraging CFRP strips for lightweighting vehicles to improve fuel efficiency and performance, aligning with global sustainability initiatives. Furthermore, the aerospace industry utilizes these strips for structural components, benefiting from their high strength-to-weight ratio. The construction and sporting goods industries are also contributing to market expansion, utilizing CFRP strips for durable and lightweight applications in building materials and high-performance equipment, respectively. While the market faces constraints such as high production costs and the complex manufacturing process involved, ongoing technological advancements are mitigating these challenges, leading to increased affordability and accessibility. We estimate the market size in 2025 to be approximately $1.5 billion, with a Compound Annual Growth Rate (CAGR) of 8% projected through 2033. This growth is fueled by the aforementioned factors, along with ongoing research and development into new applications and improved manufacturing techniques.
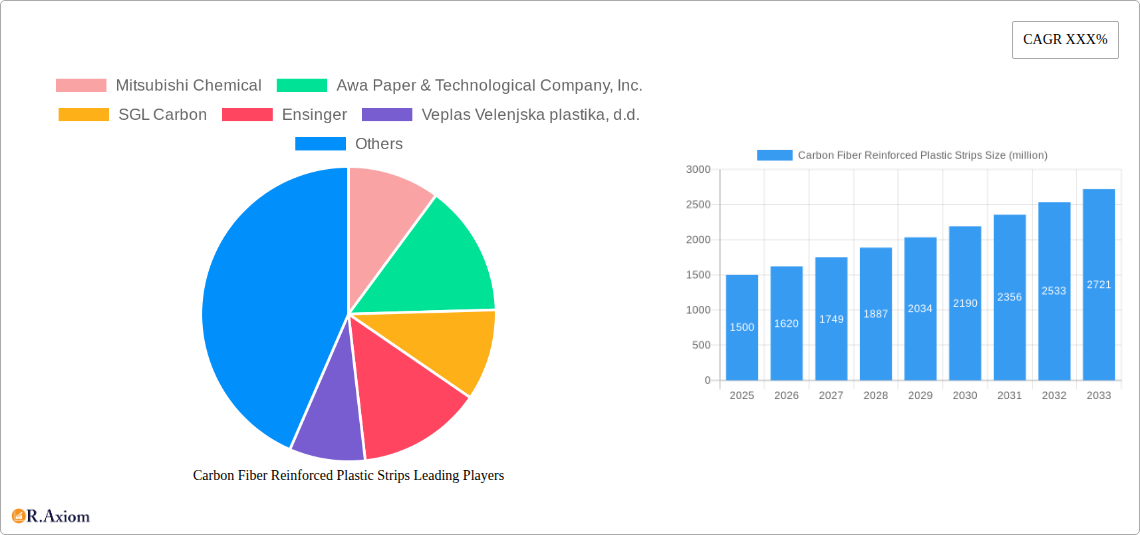
Carbon Fiber Reinforced Plastic Strips Market Size (In Billion)
The competitive landscape is characterized by a mix of established players and emerging companies. Major players such as Mitsubishi Chemical, SGL Carbon, and Toray dominate the market, leveraging their extensive experience and technological capabilities. However, smaller companies and startups are also contributing significantly through innovation and specialization in niche applications. Regional variations in market growth are expected, with North America and Europe anticipated to maintain a significant share due to established manufacturing bases and high demand. However, regions like Asia-Pacific are projected to witness faster growth due to burgeoning automotive and infrastructure development. This dynamic market demands continuous innovation and adaptation to maintain competitiveness and capitalize on emerging opportunities. Continued investment in research and development, alongside strategic partnerships and collaborations, will be crucial for sustained growth in the CFRP strips market.
Carbon Fiber Reinforced Plastic Strips Company Market Share
This comprehensive report provides an in-depth analysis of the global Carbon Fiber Reinforced Plastic (CFRP) Strips market, offering invaluable insights for stakeholders across the value chain. Covering the period 2019-2033, with a focus on the forecast period 2025-2033 and a base year of 2025, this report meticulously examines market dynamics, competitive landscapes, and future growth prospects. The report projects a market valued at $XX million in 2025, expected to reach $XX million by 2033, exhibiting a CAGR of XX%.
Carbon Fiber Reinforced Plastic Strips Market Concentration & Innovation
This section analyzes the market concentration, focusing on key players like Mitsubishi Chemical, Awa Paper & Technological Company, Inc., SGL Carbon, Ensinger, Veplas Velenjska plastika, d.d., Carbon Light, Easy Composites, Horse construction, Sika Group, Union Composites Changzhou Co., Ltd., and TORAY. Market share data reveals a moderately concentrated market, with the top five players holding approximately XX% of the global market share in 2025. Innovation is driven by the increasing demand for lightweight, high-strength materials in diverse industries.
- Market Concentration: The market is moderately concentrated, with the top 5 players accounting for approximately XX% of the market share in 2025.
- Innovation Drivers: Lightweighting trends across various industries, advancements in resin systems, and the development of specialized CFRP strips for niche applications are driving innovation.
- Regulatory Frameworks: Environmental regulations promoting sustainable materials and safety standards related to composite materials are influencing market developments.
- Product Substitutes: Alternatives like aluminum and steel are facing competition due to CFRP's superior strength-to-weight ratio, but their lower cost remains a factor.
- End-User Trends: Growing adoption in automotive, aerospace, and construction sectors is a key market driver.
- M&A Activities: Over the historical period (2019-2024), approximately $XX million was invested in M&A activities within the CFRP strips market, with a notable increase in strategic partnerships and joint ventures.
Carbon Fiber Reinforced Plastic Strips Industry Trends & Insights
The CFRP strips market is experiencing robust growth, propelled by several key factors. Technological advancements, particularly in resin formulations and manufacturing processes, are leading to improved performance characteristics and cost reductions. The increasing adoption of CFRP strips in various applications, driven by the need for lightweighting and enhanced structural integrity, fuels market expansion. Consumer preference for sustainable and high-performance materials further contributes to market growth. Competitive dynamics are shaped by the ongoing innovations and expansions of key players. The automotive sector, with its push for fuel efficiency and electric vehicle development, presents a significant growth opportunity, accounting for approximately XX% of the market in 2025.
Dominant Markets & Segments in Carbon Fiber Reinforced Plastic Strips
The Asia-Pacific region, particularly China and Japan, holds a dominant position in the CFRP strips market, accounting for approximately XX% of the global market share in 2025.
- Key Drivers in Asia-Pacific:
- Favorable government policies promoting advanced materials adoption.
- Rapid growth of automotive and electronics industries.
- Significant investments in infrastructure development.
- Dominance Analysis: Asia-Pacific's dominance stems from its large manufacturing base, supportive government initiatives, and strong demand from major end-use sectors. North America and Europe also represent significant markets.
Carbon Fiber Reinforced Plastic Strips Product Developments
Recent innovations include the development of high-modulus CFRP strips with enhanced mechanical properties and improved resin systems offering better durability and processability. These advancements cater to the growing demand for lightweighting and high-performance applications in automotive, aerospace, and sports equipment. The introduction of tailored fiber architectures and surface treatments further enhances the performance and usability of CFRP strips.
Report Scope & Segmentation Analysis
This report segments the market based on fiber type (carbon fiber type, surface treatment), resin type (epoxy, polyurethane), application (automotive, aerospace, construction, others), and region (North America, Europe, Asia-Pacific, Rest of World). Each segment presents unique growth dynamics and competitive landscapes. For instance, the automotive segment is projected to exhibit the highest CAGR during the forecast period, driven by increasing demand for lightweight vehicles. The epoxy resin segment currently dominates, but polyurethane is experiencing significant growth due to its enhanced properties.
Key Drivers of Carbon Fiber Reinforced Plastic Strips Growth
The market growth is driven by technological advancements leading to improved material properties and cost reductions, alongside increasing demand for lightweight materials across diverse sectors, particularly automotive and aerospace. Stringent environmental regulations promoting sustainable materials further bolster market growth.
Challenges in the Carbon Fiber Reinforced Plastic Strips Sector
The high cost of raw materials, including carbon fiber and resins, poses a significant challenge. Supply chain disruptions and the complexities of manufacturing CFRP strips can also impact market growth. Intense competition among established players and the emergence of new entrants creates pressure on pricing and profitability.
Emerging Opportunities in Carbon Fiber Reinforced Plastic Strips
Emerging opportunities lie in the development of specialized CFRP strips for niche applications, such as in renewable energy technologies (e.g., wind turbine blades) and advanced medical devices. The utilization of recycled carbon fiber in producing strips will gain traction as sustainable alternatives are prioritized. The expansion into new geographic markets, particularly in developing economies, presents significant growth potential.
Leading Players in the Carbon Fiber Reinforced Plastic Strips Market
- Mitsubishi Chemical
- Awa Paper & Technological Company, Inc.
- SGL Carbon
- Ensinger
- Veplas Velenjska plastika, d.d.
- Carbon Light
- Easy Composites
- Horse construction
- Sika Group
- Union Composites Changzhou Co., Ltd.
- TORAY
Key Developments in Carbon Fiber Reinforced Plastic Strips Industry
- 2022 Q4: Mitsubishi Chemical announced a new resin system enhancing the performance of CFRP strips.
- 2023 Q1: SGL Carbon invested in a new manufacturing facility expanding its production capacity.
- 2023 Q3: A strategic partnership was formed between Ensinger and a major automotive manufacturer for joint development of advanced CFRP strips.
- (Further developments will be added to the final report)
Strategic Outlook for Carbon Fiber Reinforced Plastic Strips Market
The CFRP strips market is poised for continued strong growth, driven by technological advancements, increasing demand from various sectors, and favorable government policies. The focus on lightweighting, sustainability, and improved performance characteristics will continue to drive innovation and market expansion, presenting significant opportunities for established players and new entrants alike.
Carbon Fiber Reinforced Plastic Strips Segmentation
-
1. Application
- 1.1. Civil Engineering
- 1.2. Automotive
- 1.3. Marine Engineering
- 1.4. Aerospace
-
2. Type
- 2.1. Epoxy Resin Base
- 2.2. Polyester Resin Base
- 2.3. Vinyl Ester Resin Base
Carbon Fiber Reinforced Plastic Strips Segmentation By Geography
-
1. North America
- 1.1. United States
- 1.2. Canada
- 1.3. Mexico
-
2. South America
- 2.1. Brazil
- 2.2. Argentina
- 2.3. Rest of South America
-
3. Europe
- 3.1. United Kingdom
- 3.2. Germany
- 3.3. France
- 3.4. Italy
- 3.5. Spain
- 3.6. Russia
- 3.7. Benelux
- 3.8. Nordics
- 3.9. Rest of Europe
-
4. Middle East & Africa
- 4.1. Turkey
- 4.2. Israel
- 4.3. GCC
- 4.4. North Africa
- 4.5. South Africa
- 4.6. Rest of Middle East & Africa
-
5. Asia Pacific
- 5.1. China
- 5.2. India
- 5.3. Japan
- 5.4. South Korea
- 5.5. ASEAN
- 5.6. Oceania
- 5.7. Rest of Asia Pacific

Carbon Fiber Reinforced Plastic Strips Regional Market Share
Geographic Coverage of Carbon Fiber Reinforced Plastic Strips
Carbon Fiber Reinforced Plastic Strips REPORT HIGHLIGHTS
| Aspects | Details |
|---|---|
| Study Period | 2020-2034 |
| Base Year | 2025 |
| Estimated Year | 2026 |
| Forecast Period | 2026-2034 |
| Historical Period | 2020-2025 |
| Growth Rate | CAGR of XXX% from 2020-2034 |
| Segmentation |
|
Table of Contents
- 1. Introduction
- 1.1. Research Scope
- 1.2. Market Segmentation
- 1.3. Research Objective
- 1.4. Definitions and Assumptions
- 2. Executive Summary
- 2.1. Market Snapshot
- 3. Market Dynamics
- 3.1. Market Drivers
- 3.2. Market Restrains
- 3.3. Market Trends
- 3.4. Market Opportunities
- 4. Market Factor Analysis
- 4.1. Porters Five Forces
- 4.1.1. Bargaining Power of Suppliers
- 4.1.2. Bargaining Power of Buyers
- 4.1.3. Threat of New Entrants
- 4.1.4. Threat of Substitutes
- 4.1.5. Competitive Rivalry
- 4.2. PESTEL analysis
- 4.3. BCG Analysis
- 4.3.1. Stars (High Growth, High Market Share)
- 4.3.2. Cash Cows (Low Growth, High Market Share)
- 4.3.3. Question Mark (High Growth, Low Market Share)
- 4.3.4. Dogs (Low Growth, Low Market Share)
- 4.4. Ansoff Matrix Analysis
- 4.5. Supply Chain Analysis
- 4.6. Regulatory Landscape
- 4.7. Current Market Potential and Opportunity Assessment (TAM–SAM–SOM Framework)
- 4.8. RAX Analyst Note
- 4.1. Porters Five Forces
- 5. Market Analysis, Insights and Forecast 2021-2033
- 5.1. Market Analysis, Insights and Forecast - by Application
- 5.1.1. Civil Engineering
- 5.1.2. Automotive
- 5.1.3. Marine Engineering
- 5.1.4. Aerospace
- 5.2. Market Analysis, Insights and Forecast - by Type
- 5.2.1. Epoxy Resin Base
- 5.2.2. Polyester Resin Base
- 5.2.3. Vinyl Ester Resin Base
- 5.3. Market Analysis, Insights and Forecast - by Region
- 5.3.1. North America
- 5.3.2. South America
- 5.3.3. Europe
- 5.3.4. Middle East & Africa
- 5.3.5. Asia Pacific
- 5.1. Market Analysis, Insights and Forecast - by Application
- 6. Global Carbon Fiber Reinforced Plastic Strips Analysis, Insights and Forecast, 2021-2033
- 6.1. Market Analysis, Insights and Forecast - by Application
- 6.1.1. Civil Engineering
- 6.1.2. Automotive
- 6.1.3. Marine Engineering
- 6.1.4. Aerospace
- 6.2. Market Analysis, Insights and Forecast - by Type
- 6.2.1. Epoxy Resin Base
- 6.2.2. Polyester Resin Base
- 6.2.3. Vinyl Ester Resin Base
- 6.1. Market Analysis, Insights and Forecast - by Application
- 7. North America Carbon Fiber Reinforced Plastic Strips Analysis, Insights and Forecast, 2020-2032
- 7.1. Market Analysis, Insights and Forecast - by Application
- 7.1.1. Civil Engineering
- 7.1.2. Automotive
- 7.1.3. Marine Engineering
- 7.1.4. Aerospace
- 7.2. Market Analysis, Insights and Forecast - by Type
- 7.2.1. Epoxy Resin Base
- 7.2.2. Polyester Resin Base
- 7.2.3. Vinyl Ester Resin Base
- 7.1. Market Analysis, Insights and Forecast - by Application
- 8. South America Carbon Fiber Reinforced Plastic Strips Analysis, Insights and Forecast, 2020-2032
- 8.1. Market Analysis, Insights and Forecast - by Application
- 8.1.1. Civil Engineering
- 8.1.2. Automotive
- 8.1.3. Marine Engineering
- 8.1.4. Aerospace
- 8.2. Market Analysis, Insights and Forecast - by Type
- 8.2.1. Epoxy Resin Base
- 8.2.2. Polyester Resin Base
- 8.2.3. Vinyl Ester Resin Base
- 8.1. Market Analysis, Insights and Forecast - by Application
- 9. Europe Carbon Fiber Reinforced Plastic Strips Analysis, Insights and Forecast, 2020-2032
- 9.1. Market Analysis, Insights and Forecast - by Application
- 9.1.1. Civil Engineering
- 9.1.2. Automotive
- 9.1.3. Marine Engineering
- 9.1.4. Aerospace
- 9.2. Market Analysis, Insights and Forecast - by Type
- 9.2.1. Epoxy Resin Base
- 9.2.2. Polyester Resin Base
- 9.2.3. Vinyl Ester Resin Base
- 9.1. Market Analysis, Insights and Forecast - by Application
- 10. Middle East & Africa Carbon Fiber Reinforced Plastic Strips Analysis, Insights and Forecast, 2020-2032
- 10.1. Market Analysis, Insights and Forecast - by Application
- 10.1.1. Civil Engineering
- 10.1.2. Automotive
- 10.1.3. Marine Engineering
- 10.1.4. Aerospace
- 10.2. Market Analysis, Insights and Forecast - by Type
- 10.2.1. Epoxy Resin Base
- 10.2.2. Polyester Resin Base
- 10.2.3. Vinyl Ester Resin Base
- 10.1. Market Analysis, Insights and Forecast - by Application
- 11. Asia Pacific Carbon Fiber Reinforced Plastic Strips Analysis, Insights and Forecast, 2020-2032
- 11.1. Market Analysis, Insights and Forecast - by Application
- 11.1.1. Civil Engineering
- 11.1.2. Automotive
- 11.1.3. Marine Engineering
- 11.1.4. Aerospace
- 11.2. Market Analysis, Insights and Forecast - by Type
- 11.2.1. Epoxy Resin Base
- 11.2.2. Polyester Resin Base
- 11.2.3. Vinyl Ester Resin Base
- 11.1. Market Analysis, Insights and Forecast - by Application
- 12. Competitive Analysis
- 12.1. Company Profiles
- 12.1.1 Mitsubishi Chemical
- 12.1.1.1. Company Overview
- 12.1.1.2. Products
- 12.1.1.3. Company Financials
- 12.1.1.4. SWOT Analysis
- 12.1.2 Awa Paper & Technological Company Inc.
- 12.1.2.1. Company Overview
- 12.1.2.2. Products
- 12.1.2.3. Company Financials
- 12.1.2.4. SWOT Analysis
- 12.1.3 SGL Carbon
- 12.1.3.1. Company Overview
- 12.1.3.2. Products
- 12.1.3.3. Company Financials
- 12.1.3.4. SWOT Analysis
- 12.1.4 Ensinger
- 12.1.4.1. Company Overview
- 12.1.4.2. Products
- 12.1.4.3. Company Financials
- 12.1.4.4. SWOT Analysis
- 12.1.5 Veplas Velenjska plastika d.d.
- 12.1.5.1. Company Overview
- 12.1.5.2. Products
- 12.1.5.3. Company Financials
- 12.1.5.4. SWOT Analysis
- 12.1.6 Carbon Light
- 12.1.6.1. Company Overview
- 12.1.6.2. Products
- 12.1.6.3. Company Financials
- 12.1.6.4. SWOT Analysis
- 12.1.7 Easy Composites
- 12.1.7.1. Company Overview
- 12.1.7.2. Products
- 12.1.7.3. Company Financials
- 12.1.7.4. SWOT Analysis
- 12.1.8 Horse construction
- 12.1.8.1. Company Overview
- 12.1.8.2. Products
- 12.1.8.3. Company Financials
- 12.1.8.4. SWOT Analysis
- 12.1.9 Sika Group
- 12.1.9.1. Company Overview
- 12.1.9.2. Products
- 12.1.9.3. Company Financials
- 12.1.9.4. SWOT Analysis
- 12.1.10 Union Composites Changzhou Co. Ltd.
- 12.1.10.1. Company Overview
- 12.1.10.2. Products
- 12.1.10.3. Company Financials
- 12.1.10.4. SWOT Analysis
- 12.1.11 TORAY
- 12.1.11.1. Company Overview
- 12.1.11.2. Products
- 12.1.11.3. Company Financials
- 12.1.11.4. SWOT Analysis
- 12.1.1 Mitsubishi Chemical
- 12.2. Market Entropy
- 12.2.1 Company's Key Areas Served
- 12.2.2 Recent Developments
- 12.3. Company Market Share Analysis 2025
- 12.3.1 Top 5 Companies Market Share Analysis
- 12.3.2 Top 3 Companies Market Share Analysis
- 12.4. List of Potential Customers
- 13. Research Methodology
List of Figures
- Figure 1: Global Carbon Fiber Reinforced Plastic Strips Revenue Breakdown (million, %) by Region 2025 & 2033
- Figure 2: Global Carbon Fiber Reinforced Plastic Strips Volume Breakdown (K, %) by Region 2025 & 2033
- Figure 3: North America Carbon Fiber Reinforced Plastic Strips Revenue (million), by Application 2025 & 2033
- Figure 4: North America Carbon Fiber Reinforced Plastic Strips Volume (K), by Application 2025 & 2033
- Figure 5: North America Carbon Fiber Reinforced Plastic Strips Revenue Share (%), by Application 2025 & 2033
- Figure 6: North America Carbon Fiber Reinforced Plastic Strips Volume Share (%), by Application 2025 & 2033
- Figure 7: North America Carbon Fiber Reinforced Plastic Strips Revenue (million), by Type 2025 & 2033
- Figure 8: North America Carbon Fiber Reinforced Plastic Strips Volume (K), by Type 2025 & 2033
- Figure 9: North America Carbon Fiber Reinforced Plastic Strips Revenue Share (%), by Type 2025 & 2033
- Figure 10: North America Carbon Fiber Reinforced Plastic Strips Volume Share (%), by Type 2025 & 2033
- Figure 11: North America Carbon Fiber Reinforced Plastic Strips Revenue (million), by Country 2025 & 2033
- Figure 12: North America Carbon Fiber Reinforced Plastic Strips Volume (K), by Country 2025 & 2033
- Figure 13: North America Carbon Fiber Reinforced Plastic Strips Revenue Share (%), by Country 2025 & 2033
- Figure 14: North America Carbon Fiber Reinforced Plastic Strips Volume Share (%), by Country 2025 & 2033
- Figure 15: South America Carbon Fiber Reinforced Plastic Strips Revenue (million), by Application 2025 & 2033
- Figure 16: South America Carbon Fiber Reinforced Plastic Strips Volume (K), by Application 2025 & 2033
- Figure 17: South America Carbon Fiber Reinforced Plastic Strips Revenue Share (%), by Application 2025 & 2033
- Figure 18: South America Carbon Fiber Reinforced Plastic Strips Volume Share (%), by Application 2025 & 2033
- Figure 19: South America Carbon Fiber Reinforced Plastic Strips Revenue (million), by Type 2025 & 2033
- Figure 20: South America Carbon Fiber Reinforced Plastic Strips Volume (K), by Type 2025 & 2033
- Figure 21: South America Carbon Fiber Reinforced Plastic Strips Revenue Share (%), by Type 2025 & 2033
- Figure 22: South America Carbon Fiber Reinforced Plastic Strips Volume Share (%), by Type 2025 & 2033
- Figure 23: South America Carbon Fiber Reinforced Plastic Strips Revenue (million), by Country 2025 & 2033
- Figure 24: South America Carbon Fiber Reinforced Plastic Strips Volume (K), by Country 2025 & 2033
- Figure 25: South America Carbon Fiber Reinforced Plastic Strips Revenue Share (%), by Country 2025 & 2033
- Figure 26: South America Carbon Fiber Reinforced Plastic Strips Volume Share (%), by Country 2025 & 2033
- Figure 27: Europe Carbon Fiber Reinforced Plastic Strips Revenue (million), by Application 2025 & 2033
- Figure 28: Europe Carbon Fiber Reinforced Plastic Strips Volume (K), by Application 2025 & 2033
- Figure 29: Europe Carbon Fiber Reinforced Plastic Strips Revenue Share (%), by Application 2025 & 2033
- Figure 30: Europe Carbon Fiber Reinforced Plastic Strips Volume Share (%), by Application 2025 & 2033
- Figure 31: Europe Carbon Fiber Reinforced Plastic Strips Revenue (million), by Type 2025 & 2033
- Figure 32: Europe Carbon Fiber Reinforced Plastic Strips Volume (K), by Type 2025 & 2033
- Figure 33: Europe Carbon Fiber Reinforced Plastic Strips Revenue Share (%), by Type 2025 & 2033
- Figure 34: Europe Carbon Fiber Reinforced Plastic Strips Volume Share (%), by Type 2025 & 2033
- Figure 35: Europe Carbon Fiber Reinforced Plastic Strips Revenue (million), by Country 2025 & 2033
- Figure 36: Europe Carbon Fiber Reinforced Plastic Strips Volume (K), by Country 2025 & 2033
- Figure 37: Europe Carbon Fiber Reinforced Plastic Strips Revenue Share (%), by Country 2025 & 2033
- Figure 38: Europe Carbon Fiber Reinforced Plastic Strips Volume Share (%), by Country 2025 & 2033
- Figure 39: Middle East & Africa Carbon Fiber Reinforced Plastic Strips Revenue (million), by Application 2025 & 2033
- Figure 40: Middle East & Africa Carbon Fiber Reinforced Plastic Strips Volume (K), by Application 2025 & 2033
- Figure 41: Middle East & Africa Carbon Fiber Reinforced Plastic Strips Revenue Share (%), by Application 2025 & 2033
- Figure 42: Middle East & Africa Carbon Fiber Reinforced Plastic Strips Volume Share (%), by Application 2025 & 2033
- Figure 43: Middle East & Africa Carbon Fiber Reinforced Plastic Strips Revenue (million), by Type 2025 & 2033
- Figure 44: Middle East & Africa Carbon Fiber Reinforced Plastic Strips Volume (K), by Type 2025 & 2033
- Figure 45: Middle East & Africa Carbon Fiber Reinforced Plastic Strips Revenue Share (%), by Type 2025 & 2033
- Figure 46: Middle East & Africa Carbon Fiber Reinforced Plastic Strips Volume Share (%), by Type 2025 & 2033
- Figure 47: Middle East & Africa Carbon Fiber Reinforced Plastic Strips Revenue (million), by Country 2025 & 2033
- Figure 48: Middle East & Africa Carbon Fiber Reinforced Plastic Strips Volume (K), by Country 2025 & 2033
- Figure 49: Middle East & Africa Carbon Fiber Reinforced Plastic Strips Revenue Share (%), by Country 2025 & 2033
- Figure 50: Middle East & Africa Carbon Fiber Reinforced Plastic Strips Volume Share (%), by Country 2025 & 2033
- Figure 51: Asia Pacific Carbon Fiber Reinforced Plastic Strips Revenue (million), by Application 2025 & 2033
- Figure 52: Asia Pacific Carbon Fiber Reinforced Plastic Strips Volume (K), by Application 2025 & 2033
- Figure 53: Asia Pacific Carbon Fiber Reinforced Plastic Strips Revenue Share (%), by Application 2025 & 2033
- Figure 54: Asia Pacific Carbon Fiber Reinforced Plastic Strips Volume Share (%), by Application 2025 & 2033
- Figure 55: Asia Pacific Carbon Fiber Reinforced Plastic Strips Revenue (million), by Type 2025 & 2033
- Figure 56: Asia Pacific Carbon Fiber Reinforced Plastic Strips Volume (K), by Type 2025 & 2033
- Figure 57: Asia Pacific Carbon Fiber Reinforced Plastic Strips Revenue Share (%), by Type 2025 & 2033
- Figure 58: Asia Pacific Carbon Fiber Reinforced Plastic Strips Volume Share (%), by Type 2025 & 2033
- Figure 59: Asia Pacific Carbon Fiber Reinforced Plastic Strips Revenue (million), by Country 2025 & 2033
- Figure 60: Asia Pacific Carbon Fiber Reinforced Plastic Strips Volume (K), by Country 2025 & 2033
- Figure 61: Asia Pacific Carbon Fiber Reinforced Plastic Strips Revenue Share (%), by Country 2025 & 2033
- Figure 62: Asia Pacific Carbon Fiber Reinforced Plastic Strips Volume Share (%), by Country 2025 & 2033
List of Tables
- Table 1: Global Carbon Fiber Reinforced Plastic Strips Revenue million Forecast, by Application 2020 & 2033
- Table 2: Global Carbon Fiber Reinforced Plastic Strips Volume K Forecast, by Application 2020 & 2033
- Table 3: Global Carbon Fiber Reinforced Plastic Strips Revenue million Forecast, by Type 2020 & 2033
- Table 4: Global Carbon Fiber Reinforced Plastic Strips Volume K Forecast, by Type 2020 & 2033
- Table 5: Global Carbon Fiber Reinforced Plastic Strips Revenue million Forecast, by Region 2020 & 2033
- Table 6: Global Carbon Fiber Reinforced Plastic Strips Volume K Forecast, by Region 2020 & 2033
- Table 7: Global Carbon Fiber Reinforced Plastic Strips Revenue million Forecast, by Application 2020 & 2033
- Table 8: Global Carbon Fiber Reinforced Plastic Strips Volume K Forecast, by Application 2020 & 2033
- Table 9: Global Carbon Fiber Reinforced Plastic Strips Revenue million Forecast, by Type 2020 & 2033
- Table 10: Global Carbon Fiber Reinforced Plastic Strips Volume K Forecast, by Type 2020 & 2033
- Table 11: Global Carbon Fiber Reinforced Plastic Strips Revenue million Forecast, by Country 2020 & 2033
- Table 12: Global Carbon Fiber Reinforced Plastic Strips Volume K Forecast, by Country 2020 & 2033
- Table 13: United States Carbon Fiber Reinforced Plastic Strips Revenue (million) Forecast, by Application 2020 & 2033
- Table 14: United States Carbon Fiber Reinforced Plastic Strips Volume (K) Forecast, by Application 2020 & 2033
- Table 15: Canada Carbon Fiber Reinforced Plastic Strips Revenue (million) Forecast, by Application 2020 & 2033
- Table 16: Canada Carbon Fiber Reinforced Plastic Strips Volume (K) Forecast, by Application 2020 & 2033
- Table 17: Mexico Carbon Fiber Reinforced Plastic Strips Revenue (million) Forecast, by Application 2020 & 2033
- Table 18: Mexico Carbon Fiber Reinforced Plastic Strips Volume (K) Forecast, by Application 2020 & 2033
- Table 19: Global Carbon Fiber Reinforced Plastic Strips Revenue million Forecast, by Application 2020 & 2033
- Table 20: Global Carbon Fiber Reinforced Plastic Strips Volume K Forecast, by Application 2020 & 2033
- Table 21: Global Carbon Fiber Reinforced Plastic Strips Revenue million Forecast, by Type 2020 & 2033
- Table 22: Global Carbon Fiber Reinforced Plastic Strips Volume K Forecast, by Type 2020 & 2033
- Table 23: Global Carbon Fiber Reinforced Plastic Strips Revenue million Forecast, by Country 2020 & 2033
- Table 24: Global Carbon Fiber Reinforced Plastic Strips Volume K Forecast, by Country 2020 & 2033
- Table 25: Brazil Carbon Fiber Reinforced Plastic Strips Revenue (million) Forecast, by Application 2020 & 2033
- Table 26: Brazil Carbon Fiber Reinforced Plastic Strips Volume (K) Forecast, by Application 2020 & 2033
- Table 27: Argentina Carbon Fiber Reinforced Plastic Strips Revenue (million) Forecast, by Application 2020 & 2033
- Table 28: Argentina Carbon Fiber Reinforced Plastic Strips Volume (K) Forecast, by Application 2020 & 2033
- Table 29: Rest of South America Carbon Fiber Reinforced Plastic Strips Revenue (million) Forecast, by Application 2020 & 2033
- Table 30: Rest of South America Carbon Fiber Reinforced Plastic Strips Volume (K) Forecast, by Application 2020 & 2033
- Table 31: Global Carbon Fiber Reinforced Plastic Strips Revenue million Forecast, by Application 2020 & 2033
- Table 32: Global Carbon Fiber Reinforced Plastic Strips Volume K Forecast, by Application 2020 & 2033
- Table 33: Global Carbon Fiber Reinforced Plastic Strips Revenue million Forecast, by Type 2020 & 2033
- Table 34: Global Carbon Fiber Reinforced Plastic Strips Volume K Forecast, by Type 2020 & 2033
- Table 35: Global Carbon Fiber Reinforced Plastic Strips Revenue million Forecast, by Country 2020 & 2033
- Table 36: Global Carbon Fiber Reinforced Plastic Strips Volume K Forecast, by Country 2020 & 2033
- Table 37: United Kingdom Carbon Fiber Reinforced Plastic Strips Revenue (million) Forecast, by Application 2020 & 2033
- Table 38: United Kingdom Carbon Fiber Reinforced Plastic Strips Volume (K) Forecast, by Application 2020 & 2033
- Table 39: Germany Carbon Fiber Reinforced Plastic Strips Revenue (million) Forecast, by Application 2020 & 2033
- Table 40: Germany Carbon Fiber Reinforced Plastic Strips Volume (K) Forecast, by Application 2020 & 2033
- Table 41: France Carbon Fiber Reinforced Plastic Strips Revenue (million) Forecast, by Application 2020 & 2033
- Table 42: France Carbon Fiber Reinforced Plastic Strips Volume (K) Forecast, by Application 2020 & 2033
- Table 43: Italy Carbon Fiber Reinforced Plastic Strips Revenue (million) Forecast, by Application 2020 & 2033
- Table 44: Italy Carbon Fiber Reinforced Plastic Strips Volume (K) Forecast, by Application 2020 & 2033
- Table 45: Spain Carbon Fiber Reinforced Plastic Strips Revenue (million) Forecast, by Application 2020 & 2033
- Table 46: Spain Carbon Fiber Reinforced Plastic Strips Volume (K) Forecast, by Application 2020 & 2033
- Table 47: Russia Carbon Fiber Reinforced Plastic Strips Revenue (million) Forecast, by Application 2020 & 2033
- Table 48: Russia Carbon Fiber Reinforced Plastic Strips Volume (K) Forecast, by Application 2020 & 2033
- Table 49: Benelux Carbon Fiber Reinforced Plastic Strips Revenue (million) Forecast, by Application 2020 & 2033
- Table 50: Benelux Carbon Fiber Reinforced Plastic Strips Volume (K) Forecast, by Application 2020 & 2033
- Table 51: Nordics Carbon Fiber Reinforced Plastic Strips Revenue (million) Forecast, by Application 2020 & 2033
- Table 52: Nordics Carbon Fiber Reinforced Plastic Strips Volume (K) Forecast, by Application 2020 & 2033
- Table 53: Rest of Europe Carbon Fiber Reinforced Plastic Strips Revenue (million) Forecast, by Application 2020 & 2033
- Table 54: Rest of Europe Carbon Fiber Reinforced Plastic Strips Volume (K) Forecast, by Application 2020 & 2033
- Table 55: Global Carbon Fiber Reinforced Plastic Strips Revenue million Forecast, by Application 2020 & 2033
- Table 56: Global Carbon Fiber Reinforced Plastic Strips Volume K Forecast, by Application 2020 & 2033
- Table 57: Global Carbon Fiber Reinforced Plastic Strips Revenue million Forecast, by Type 2020 & 2033
- Table 58: Global Carbon Fiber Reinforced Plastic Strips Volume K Forecast, by Type 2020 & 2033
- Table 59: Global Carbon Fiber Reinforced Plastic Strips Revenue million Forecast, by Country 2020 & 2033
- Table 60: Global Carbon Fiber Reinforced Plastic Strips Volume K Forecast, by Country 2020 & 2033
- Table 61: Turkey Carbon Fiber Reinforced Plastic Strips Revenue (million) Forecast, by Application 2020 & 2033
- Table 62: Turkey Carbon Fiber Reinforced Plastic Strips Volume (K) Forecast, by Application 2020 & 2033
- Table 63: Israel Carbon Fiber Reinforced Plastic Strips Revenue (million) Forecast, by Application 2020 & 2033
- Table 64: Israel Carbon Fiber Reinforced Plastic Strips Volume (K) Forecast, by Application 2020 & 2033
- Table 65: GCC Carbon Fiber Reinforced Plastic Strips Revenue (million) Forecast, by Application 2020 & 2033
- Table 66: GCC Carbon Fiber Reinforced Plastic Strips Volume (K) Forecast, by Application 2020 & 2033
- Table 67: North Africa Carbon Fiber Reinforced Plastic Strips Revenue (million) Forecast, by Application 2020 & 2033
- Table 68: North Africa Carbon Fiber Reinforced Plastic Strips Volume (K) Forecast, by Application 2020 & 2033
- Table 69: South Africa Carbon Fiber Reinforced Plastic Strips Revenue (million) Forecast, by Application 2020 & 2033
- Table 70: South Africa Carbon Fiber Reinforced Plastic Strips Volume (K) Forecast, by Application 2020 & 2033
- Table 71: Rest of Middle East & Africa Carbon Fiber Reinforced Plastic Strips Revenue (million) Forecast, by Application 2020 & 2033
- Table 72: Rest of Middle East & Africa Carbon Fiber Reinforced Plastic Strips Volume (K) Forecast, by Application 2020 & 2033
- Table 73: Global Carbon Fiber Reinforced Plastic Strips Revenue million Forecast, by Application 2020 & 2033
- Table 74: Global Carbon Fiber Reinforced Plastic Strips Volume K Forecast, by Application 2020 & 2033
- Table 75: Global Carbon Fiber Reinforced Plastic Strips Revenue million Forecast, by Type 2020 & 2033
- Table 76: Global Carbon Fiber Reinforced Plastic Strips Volume K Forecast, by Type 2020 & 2033
- Table 77: Global Carbon Fiber Reinforced Plastic Strips Revenue million Forecast, by Country 2020 & 2033
- Table 78: Global Carbon Fiber Reinforced Plastic Strips Volume K Forecast, by Country 2020 & 2033
- Table 79: China Carbon Fiber Reinforced Plastic Strips Revenue (million) Forecast, by Application 2020 & 2033
- Table 80: China Carbon Fiber Reinforced Plastic Strips Volume (K) Forecast, by Application 2020 & 2033
- Table 81: India Carbon Fiber Reinforced Plastic Strips Revenue (million) Forecast, by Application 2020 & 2033
- Table 82: India Carbon Fiber Reinforced Plastic Strips Volume (K) Forecast, by Application 2020 & 2033
- Table 83: Japan Carbon Fiber Reinforced Plastic Strips Revenue (million) Forecast, by Application 2020 & 2033
- Table 84: Japan Carbon Fiber Reinforced Plastic Strips Volume (K) Forecast, by Application 2020 & 2033
- Table 85: South Korea Carbon Fiber Reinforced Plastic Strips Revenue (million) Forecast, by Application 2020 & 2033
- Table 86: South Korea Carbon Fiber Reinforced Plastic Strips Volume (K) Forecast, by Application 2020 & 2033
- Table 87: ASEAN Carbon Fiber Reinforced Plastic Strips Revenue (million) Forecast, by Application 2020 & 2033
- Table 88: ASEAN Carbon Fiber Reinforced Plastic Strips Volume (K) Forecast, by Application 2020 & 2033
- Table 89: Oceania Carbon Fiber Reinforced Plastic Strips Revenue (million) Forecast, by Application 2020 & 2033
- Table 90: Oceania Carbon Fiber Reinforced Plastic Strips Volume (K) Forecast, by Application 2020 & 2033
- Table 91: Rest of Asia Pacific Carbon Fiber Reinforced Plastic Strips Revenue (million) Forecast, by Application 2020 & 2033
- Table 92: Rest of Asia Pacific Carbon Fiber Reinforced Plastic Strips Volume (K) Forecast, by Application 2020 & 2033
Frequently Asked Questions
1. What is the projected Compound Annual Growth Rate (CAGR) of the Carbon Fiber Reinforced Plastic Strips?
The projected CAGR is approximately XXX%.
2. Which companies are prominent players in the Carbon Fiber Reinforced Plastic Strips?
Key companies in the market include Mitsubishi Chemical, Awa Paper & Technological Company, Inc., SGL Carbon, Ensinger, Veplas Velenjska plastika, d.d., Carbon Light, Easy Composites, Horse construction, Sika Group, Union Composites Changzhou Co., Ltd., TORAY.
3. What are the main segments of the Carbon Fiber Reinforced Plastic Strips?
The market segments include Application, Type.
4. Can you provide details about the market size?
The market size is estimated to be USD XXX million as of 2022.
5. What are some drivers contributing to market growth?
N/A
6. What are the notable trends driving market growth?
N/A
7. Are there any restraints impacting market growth?
N/A
8. Can you provide examples of recent developments in the market?
N/A
9. What pricing options are available for accessing the report?
Pricing options include single-user, multi-user, and enterprise licenses priced at USD 3950.00, USD 5925.00, and USD 7900.00 respectively.
10. Is the market size provided in terms of value or volume?
The market size is provided in terms of value, measured in million and volume, measured in K.
11. Are there any specific market keywords associated with the report?
Yes, the market keyword associated with the report is "Carbon Fiber Reinforced Plastic Strips," which aids in identifying and referencing the specific market segment covered.
12. How do I determine which pricing option suits my needs best?
The pricing options vary based on user requirements and access needs. Individual users may opt for single-user licenses, while businesses requiring broader access may choose multi-user or enterprise licenses for cost-effective access to the report.
13. Are there any additional resources or data provided in the Carbon Fiber Reinforced Plastic Strips report?
While the report offers comprehensive insights, it's advisable to review the specific contents or supplementary materials provided to ascertain if additional resources or data are available.
14. How can I stay updated on further developments or reports in the Carbon Fiber Reinforced Plastic Strips?
To stay informed about further developments, trends, and reports in the Carbon Fiber Reinforced Plastic Strips, consider subscribing to industry newsletters, following relevant companies and organizations, or regularly checking reputable industry news sources and publications.
Methodology
Step 1 - Identification of Relevant Samples Size from Population Database


Step 2 - Approaches for Defining Global Market Size (Value, Volume* & Price*)

Note*: In applicable scenarios
Step 3 - Data Sources
Primary Research
- Web Analytics
- Survey Reports
- Research Institute
- Latest Research Reports
- Opinion Leaders
Secondary Research
- Annual Reports
- White Paper
- Latest Press Release
- Industry Association
- Paid Database
- Investor Presentations

Step 4 - Data Triangulation
Involves using different sources of information in order to increase the validity of a study
These sources are likely to be stakeholders in a program - participants, other researchers, program staff, other community members, and so on.
Then we put all data in single framework & apply various statistical tools to find out the dynamic on the market.
During the analysis stage, feedback from the stakeholder groups would be compared to determine areas of agreement as well as areas of divergence