Key Insights
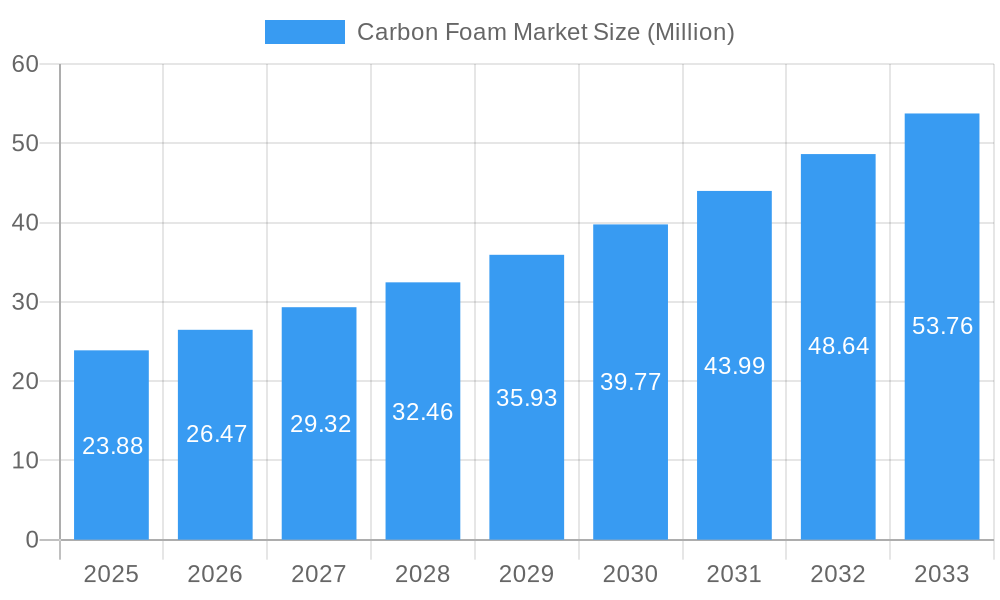
The global carbon foam market, valued at $23.88 million in 2025, is poised for robust growth, exhibiting a Compound Annual Growth Rate (CAGR) of 10.73% from 2025 to 2033. This expansion is driven by the increasing demand across diverse end-use industries, particularly aerospace and defense, where lightweight yet strong materials are crucial for performance and fuel efficiency. The automotive sector also presents significant growth opportunities, as manufacturers strive to improve vehicle fuel economy and reduce emissions through the incorporation of lighter-weight components. Furthermore, the building and construction industry is increasingly adopting carbon foams for insulation and structural applications, leveraging their superior thermal and acoustic properties. The market is segmented by type (graphitic and non-graphitic) and end-user industry, allowing for a granular understanding of specific application demands and market dynamics. While the market faces certain restraints, such as the high initial cost of production and the relatively nascent technological development in some applications, the overall growth outlook remains extremely positive. Technological advancements leading to improved manufacturing processes and wider application development will be instrumental in shaping future market expansion. The Asia-Pacific region, specifically China and India, is expected to be a key driver of growth, owing to robust infrastructure development and industrial expansion. North America and Europe will also contribute significantly, driven by the continued adoption of carbon foams in high-value applications like aerospace and automotive.
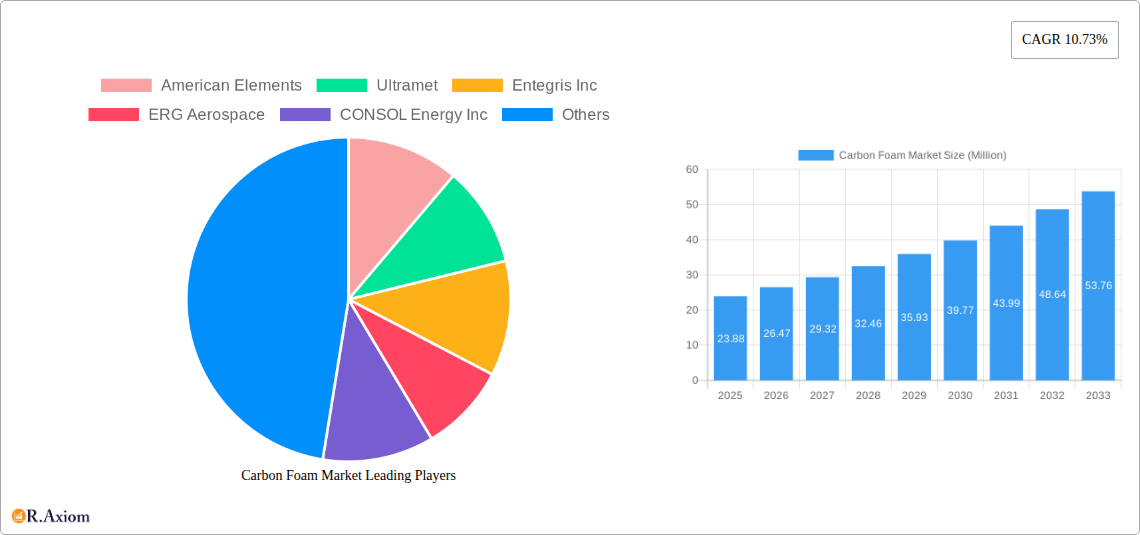
Carbon Foam Market Market Size (In Million)
The market's growth trajectory is further fueled by the rising awareness of sustainability and environmental concerns. Carbon foams offer advantages in terms of energy efficiency and recyclability, which resonates with the global push toward environmentally friendly materials. Moreover, ongoing research and development efforts are focused on improving the performance characteristics of carbon foams, such as enhancing their strength-to-weight ratio, thermal conductivity, and acoustic insulation properties. This continuous innovation is expected to unlock new application areas and propel the market's growth beyond the forecast period. Competition among key players such as American Elements, Ultramet, and Entegris Inc. is driving innovation and is likely to result in increased market penetration and the development of more cost-effective production methods. The diversification into new applications within the industrial sector will provide new revenue streams and solidify the long-term viability of this promising material.
Carbon Foam Market Company Market Share
This in-depth report provides a comprehensive analysis of the global Carbon Foam market, offering valuable insights into market dynamics, growth drivers, competitive landscape, and future opportunities. The study covers the period from 2019 to 2033, with a focus on the forecast period of 2025-2033, and uses 2025 as the base year. This report is crucial for industry stakeholders, investors, and strategic decision-makers seeking to understand and capitalize on the evolving carbon foam landscape.
Carbon Foam Market Concentration & Innovation
This section analyzes the market concentration, highlighting the leading players and their respective market shares. Innovation drivers, including advancements in material science and manufacturing techniques, are examined. The influence of regulatory frameworks, the presence of substitute materials, evolving end-user trends, and recent mergers and acquisitions (M&A) activities are also detailed. Market share data reveals a moderately fragmented market, with no single dominant player commanding over xx%. M&A activity has been relatively modest in recent years, with total deal values estimated at xx Million in 2024. Key innovation drivers include the development of lightweight, high-strength materials for aerospace and automotive applications. Stricter environmental regulations are also pushing innovation towards sustainable and eco-friendly carbon foam production methods.
- Market share analysis of top 5 players: American Elements (xx%), Ultramet (xx%), Entegris Inc (xx%), ERG Aerospace (xx%), CONSOL Energy Inc (xx%). (Note: Percentages are estimates due to limited publicly available data)
- M&A activity overview: xx major deals in the last five years, totaling xx Million.
- Analysis of regulatory frameworks impacting market growth: Focus on environmental regulations and safety standards.
- Identification of key product substitutes and their market impact: Assessment of competitive pressures from alternative materials.
Carbon Foam Market Industry Trends & Insights
The global carbon foam market is experiencing significant growth, driven by increasing demand across diverse end-user industries. The market is projected to achieve a CAGR of xx% during the forecast period (2025-2033), reaching a market value of xx Million by 2033. This growth is fueled by factors such as the rising adoption of lightweight materials in aerospace and automotive sectors, expanding construction activities globally, and the increasing use of carbon foam in electrical and industrial applications. Technological advancements, such as improved production methods and enhanced material properties, are further contributing to market expansion. However, competitive pressures and raw material price fluctuations pose challenges to sustained growth. Market penetration in key end-user segments such as aerospace and automotive is expected to increase significantly over the forecast period, reaching xx% and xx%, respectively, by 2033.
Dominant Markets & Segments in Carbon Foam Market
The report identifies key regional and segment dominance within the carbon foam market. The region of [insert dominant region, e.g., North America] currently holds the largest market share, driven by strong demand from the aerospace and automotive sectors and favorable economic conditions. [Insert dominant country, e.g., United States] is the leading national market within this region. Within the product type segment, graphitic carbon foam accounts for the larger share due to its superior properties, while the non-graphitic segment is experiencing faster growth. In terms of end-user industries, aerospace and defense lead the market due to the high value placed on lightweight materials, followed by the automotive industry's demand for improved fuel efficiency.
Key Drivers for Dominant Region/Country:
- Strong aerospace and automotive industries
- Government support for technological advancements
- Favorable economic conditions
- Robust infrastructure
Dominant Segments and their Drivers:
- Graphitic Carbon Foam: Superior properties and performance drive demand in high-value applications.
- Aerospace and Defense: Lightweighting requirements and performance advantages are primary drivers.
Carbon Foam Market Product Developments
Recent product developments focus on enhancing the performance and versatility of carbon foam. Innovations include the development of carbon foam with tailored porosity and improved mechanical properties. This enables wider applications across diverse industries. Companies are focusing on cost-effective manufacturing processes and expanding the range of available material properties to cater to specific application needs. This improved market fit is driving increased adoption and market growth. A notable development is the creation of carbon foam from oil refining waste, as reported in November 2023 by scientists from the Institute of Catalysts in Russia.
Report Scope & Segmentation Analysis
This report segments the carbon foam market based on type (graphitic and non-graphitic) and end-user industry (aerospace and defense, building and construction, automotive, electrical, industrial, and other end-user industries). Each segment is analyzed in terms of its market size, growth projections, and competitive dynamics. For example, the graphitic carbon foam segment is projected to grow at a CAGR of xx% during the forecast period, driven by its superior properties. The aerospace and defense segment is expected to demonstrate the highest growth rate among end-user industries due to the increasing demand for lightweight and high-strength materials.
Key Drivers of Carbon Foam Market Growth
The growth of the carbon foam market is propelled by several key factors. Technological advancements lead to improved material properties and manufacturing processes, reducing production costs and expanding applications. The rising demand for lightweight materials across various industries, particularly aerospace and automotive, boosts market growth. Stringent environmental regulations encourage the adoption of sustainable materials, favoring carbon foam's role in reducing carbon footprints. Government initiatives supporting technological innovation and infrastructure development further stimulate market expansion.
Challenges in the Carbon Foam Market Sector
Several challenges hinder the growth of the carbon foam market. High production costs compared to traditional materials limit widespread adoption, especially in price-sensitive industries. The complexity of manufacturing processes and the availability of skilled labor pose obstacles to scaling production. Competition from alternative lightweight materials, such as polymers and composites, impacts market share. Supply chain disruptions can affect the availability of raw materials and production timelines, impacting overall market growth.
Emerging Opportunities in Carbon Foam Market
Several emerging opportunities exist for growth within the carbon foam market. Expansion into new and niche applications, such as energy storage and biomedical devices, offers significant potential. Advancements in material science and nanotechnology are leading to the development of novel carbon foam with enhanced properties and functionalities. The growing awareness of sustainability and environmental concerns further promotes the adoption of carbon foam as an eco-friendly material. Government incentives and funding for research and development in sustainable materials create favorable market conditions.
Leading Players in the Carbon Foam Market Market
- American Elements
- Ultramet
- Entegris Inc
- ERG Aerospace
- CONSOL Energy Inc
- Carbon-Core Corporation
- Xiamen Zopin New Material Limited
- Koppers Inc
- Firefly International Energy
Key Developments in Carbon Foam Market Industry
- November 2023: Scientists from the Institute of Catalysts of the Siberian branch of the Russian Academy of Sciences successfully obtained carbon foam from oil refining waste, eliminating the need for foaming agents. This breakthrough could significantly reduce production costs and environmental impact, potentially disrupting market dynamics and boosting growth.
Strategic Outlook for Carbon Foam Market Market
The carbon foam market is poised for sustained growth driven by technological innovation, expanding applications across various industries, and increasing demand for lightweight and sustainable materials. Strategic partnerships and collaborations among industry players will be crucial for accelerating market expansion. Focus on research and development to enhance material properties and explore new applications will further drive market growth. The market presents significant opportunities for companies that can effectively address the challenges of high production costs and improve the scalability of manufacturing processes.
Carbon Foam Market Segmentation
-
1. Type
- 1.1. Graphitic
- 1.2. Non-graphitic
-
2. End-user Industry
- 2.1. Aerospace and Defense
- 2.2. Building and Construction
- 2.3. Automotive
- 2.4. Electrical
- 2.5. Industrial
- 2.6. Other End-user Industries
Carbon Foam Market Segmentation By Geography
-
1. Asia Pacific
- 1.1. China
- 1.2. India
- 1.3. Japan
- 1.4. South Korea
- 1.5. Malaysia
- 1.6. Thailand
- 1.7. Indonesia
- 1.8. Vietnam
- 1.9. Rest of Asia Pacific
-
2. North America
- 2.1. United States
- 2.2. Canada
- 2.3. Mexico
-
3. Europe
- 3.1. Germany
- 3.2. United Kingdom
- 3.3. France
- 3.4. Italy
- 3.5. Spain
- 3.6. Nordic
- 3.7. Turkey
- 3.8. Russia
- 3.9. Rest of Europe
-
4. South America
- 4.1. Brazil
- 4.2. Argentina
- 4.3. Rest of South America
-
5. Middle East and Africa
- 5.1. Saudi Arabia
- 5.2. South Africa
- 5.3. Rest of Middle East and Africa
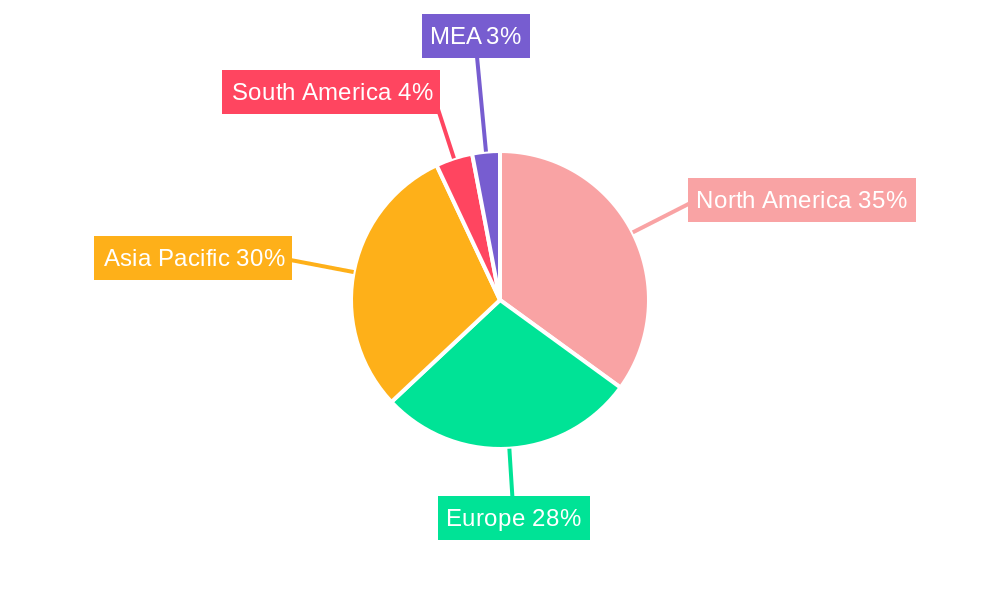
Carbon Foam Market Regional Market Share
Geographic Coverage of Carbon Foam Market
Carbon Foam Market REPORT HIGHLIGHTS
| Aspects | Details |
|---|---|
| Study Period | 2020-2034 |
| Base Year | 2025 |
| Estimated Year | 2026 |
| Forecast Period | 2026-2034 |
| Historical Period | 2020-2025 |
| Growth Rate | CAGR of 10.73% from 2020-2034 |
| Segmentation |
|
Table of Contents
- 1. Introduction
- 1.1. Research Scope
- 1.2. Market Segmentation
- 1.3. Research Objective
- 1.4. Definitions and Assumptions
- 2. Executive Summary
- 2.1. Market Snapshot
- 3. Market Dynamics
- 3.1. Market Drivers
- 3.2. Market Restrains
- 3.3. Market Trends
- 3.4. Market Opportunities
- 4. Market Factor Analysis
- 4.1. Porters Five Forces
- 4.1.1. Bargaining Power of Suppliers
- 4.1.2. Bargaining Power of Buyers
- 4.1.3. Threat of New Entrants
- 4.1.4. Threat of Substitutes
- 4.1.5. Competitive Rivalry
- 4.2. PESTEL analysis
- 4.3. BCG Analysis
- 4.3.1. Stars (High Growth, High Market Share)
- 4.3.2. Cash Cows (Low Growth, High Market Share)
- 4.3.3. Question Mark (High Growth, Low Market Share)
- 4.3.4. Dogs (Low Growth, Low Market Share)
- 4.4. Ansoff Matrix Analysis
- 4.5. Supply Chain Analysis
- 4.6. Regulatory Landscape
- 4.7. Current Market Potential and Opportunity Assessment (TAM–SAM–SOM Framework)
- 4.8. RAX Analyst Note
- 4.1. Porters Five Forces
- 5. Market Analysis, Insights and Forecast 2021-2033
- 5.1. Market Analysis, Insights and Forecast - by Type
- 5.1.1. Graphitic
- 5.1.2. Non-graphitic
- 5.2. Market Analysis, Insights and Forecast - by End-user Industry
- 5.2.1. Aerospace and Defense
- 5.2.2. Building and Construction
- 5.2.3. Automotive
- 5.2.4. Electrical
- 5.2.5. Industrial
- 5.2.6. Other End-user Industries
- 5.3. Market Analysis, Insights and Forecast - by Region
- 5.3.1. Asia Pacific
- 5.3.2. North America
- 5.3.3. Europe
- 5.3.4. South America
- 5.3.5. Middle East and Africa
- 5.1. Market Analysis, Insights and Forecast - by Type
- 6. Global Carbon Foam Market Analysis, Insights and Forecast, 2021-2033
- 6.1. Market Analysis, Insights and Forecast - by Type
- 6.1.1. Graphitic
- 6.1.2. Non-graphitic
- 6.2. Market Analysis, Insights and Forecast - by End-user Industry
- 6.2.1. Aerospace and Defense
- 6.2.2. Building and Construction
- 6.2.3. Automotive
- 6.2.4. Electrical
- 6.2.5. Industrial
- 6.2.6. Other End-user Industries
- 6.1. Market Analysis, Insights and Forecast - by Type
- 7. Asia Pacific Carbon Foam Market Analysis, Insights and Forecast, 2020-2032
- 7.1. Market Analysis, Insights and Forecast - by Type
- 7.1.1. Graphitic
- 7.1.2. Non-graphitic
- 7.2. Market Analysis, Insights and Forecast - by End-user Industry
- 7.2.1. Aerospace and Defense
- 7.2.2. Building and Construction
- 7.2.3. Automotive
- 7.2.4. Electrical
- 7.2.5. Industrial
- 7.2.6. Other End-user Industries
- 7.1. Market Analysis, Insights and Forecast - by Type
- 8. North America Carbon Foam Market Analysis, Insights and Forecast, 2020-2032
- 8.1. Market Analysis, Insights and Forecast - by Type
- 8.1.1. Graphitic
- 8.1.2. Non-graphitic
- 8.2. Market Analysis, Insights and Forecast - by End-user Industry
- 8.2.1. Aerospace and Defense
- 8.2.2. Building and Construction
- 8.2.3. Automotive
- 8.2.4. Electrical
- 8.2.5. Industrial
- 8.2.6. Other End-user Industries
- 8.1. Market Analysis, Insights and Forecast - by Type
- 9. Europe Carbon Foam Market Analysis, Insights and Forecast, 2020-2032
- 9.1. Market Analysis, Insights and Forecast - by Type
- 9.1.1. Graphitic
- 9.1.2. Non-graphitic
- 9.2. Market Analysis, Insights and Forecast - by End-user Industry
- 9.2.1. Aerospace and Defense
- 9.2.2. Building and Construction
- 9.2.3. Automotive
- 9.2.4. Electrical
- 9.2.5. Industrial
- 9.2.6. Other End-user Industries
- 9.1. Market Analysis, Insights and Forecast - by Type
- 10. South America Carbon Foam Market Analysis, Insights and Forecast, 2020-2032
- 10.1. Market Analysis, Insights and Forecast - by Type
- 10.1.1. Graphitic
- 10.1.2. Non-graphitic
- 10.2. Market Analysis, Insights and Forecast - by End-user Industry
- 10.2.1. Aerospace and Defense
- 10.2.2. Building and Construction
- 10.2.3. Automotive
- 10.2.4. Electrical
- 10.2.5. Industrial
- 10.2.6. Other End-user Industries
- 10.1. Market Analysis, Insights and Forecast - by Type
- 11. Middle East and Africa Carbon Foam Market Analysis, Insights and Forecast, 2020-2032
- 11.1. Market Analysis, Insights and Forecast - by Type
- 11.1.1. Graphitic
- 11.1.2. Non-graphitic
- 11.2. Market Analysis, Insights and Forecast - by End-user Industry
- 11.2.1. Aerospace and Defense
- 11.2.2. Building and Construction
- 11.2.3. Automotive
- 11.2.4. Electrical
- 11.2.5. Industrial
- 11.2.6. Other End-user Industries
- 11.1. Market Analysis, Insights and Forecast - by Type
- 12. Competitive Analysis
- 12.1. Company Profiles
- 12.1.1 American Elements
- 12.1.1.1. Company Overview
- 12.1.1.2. Products
- 12.1.1.3. Company Financials
- 12.1.1.4. SWOT Analysis
- 12.1.2 Ultramet
- 12.1.2.1. Company Overview
- 12.1.2.2. Products
- 12.1.2.3. Company Financials
- 12.1.2.4. SWOT Analysis
- 12.1.3 Entegris Inc
- 12.1.3.1. Company Overview
- 12.1.3.2. Products
- 12.1.3.3. Company Financials
- 12.1.3.4. SWOT Analysis
- 12.1.4 ERG Aerospace
- 12.1.4.1. Company Overview
- 12.1.4.2. Products
- 12.1.4.3. Company Financials
- 12.1.4.4. SWOT Analysis
- 12.1.5 CONSOL Energy Inc
- 12.1.5.1. Company Overview
- 12.1.5.2. Products
- 12.1.5.3. Company Financials
- 12.1.5.4. SWOT Analysis
- 12.1.6 Carbon-Core Corporation
- 12.1.6.1. Company Overview
- 12.1.6.2. Products
- 12.1.6.3. Company Financials
- 12.1.6.4. SWOT Analysis
- 12.1.7 Xiamen Zopin New Material Limited
- 12.1.7.1. Company Overview
- 12.1.7.2. Products
- 12.1.7.3. Company Financials
- 12.1.7.4. SWOT Analysis
- 12.1.8 Koppers Inc
- 12.1.8.1. Company Overview
- 12.1.8.2. Products
- 12.1.8.3. Company Financials
- 12.1.8.4. SWOT Analysis
- 12.1.9 Firefly International Energy
- 12.1.9.1. Company Overview
- 12.1.9.2. Products
- 12.1.9.3. Company Financials
- 12.1.9.4. SWOT Analysis
- 12.1.1 American Elements
- 12.2. Market Entropy
- 12.2.1 Company's Key Areas Served
- 12.2.2 Recent Developments
- 12.3. Company Market Share Analysis 2025
- 12.3.1 Top 5 Companies Market Share Analysis
- 12.3.2 Top 3 Companies Market Share Analysis
- 12.4. List of Potential Customers
- 13. Research Methodology
List of Figures
- Figure 1: Global Carbon Foam Market Revenue Breakdown (Million, %) by Region 2025 & 2033
- Figure 2: Global Carbon Foam Market Volume Breakdown (Square Meters, %) by Region 2025 & 2033
- Figure 3: Asia Pacific Carbon Foam Market Revenue (Million), by Type 2025 & 2033
- Figure 4: Asia Pacific Carbon Foam Market Volume (Square Meters), by Type 2025 & 2033
- Figure 5: Asia Pacific Carbon Foam Market Revenue Share (%), by Type 2025 & 2033
- Figure 6: Asia Pacific Carbon Foam Market Volume Share (%), by Type 2025 & 2033
- Figure 7: Asia Pacific Carbon Foam Market Revenue (Million), by End-user Industry 2025 & 2033
- Figure 8: Asia Pacific Carbon Foam Market Volume (Square Meters), by End-user Industry 2025 & 2033
- Figure 9: Asia Pacific Carbon Foam Market Revenue Share (%), by End-user Industry 2025 & 2033
- Figure 10: Asia Pacific Carbon Foam Market Volume Share (%), by End-user Industry 2025 & 2033
- Figure 11: Asia Pacific Carbon Foam Market Revenue (Million), by Country 2025 & 2033
- Figure 12: Asia Pacific Carbon Foam Market Volume (Square Meters), by Country 2025 & 2033
- Figure 13: Asia Pacific Carbon Foam Market Revenue Share (%), by Country 2025 & 2033
- Figure 14: Asia Pacific Carbon Foam Market Volume Share (%), by Country 2025 & 2033
- Figure 15: North America Carbon Foam Market Revenue (Million), by Type 2025 & 2033
- Figure 16: North America Carbon Foam Market Volume (Square Meters), by Type 2025 & 2033
- Figure 17: North America Carbon Foam Market Revenue Share (%), by Type 2025 & 2033
- Figure 18: North America Carbon Foam Market Volume Share (%), by Type 2025 & 2033
- Figure 19: North America Carbon Foam Market Revenue (Million), by End-user Industry 2025 & 2033
- Figure 20: North America Carbon Foam Market Volume (Square Meters), by End-user Industry 2025 & 2033
- Figure 21: North America Carbon Foam Market Revenue Share (%), by End-user Industry 2025 & 2033
- Figure 22: North America Carbon Foam Market Volume Share (%), by End-user Industry 2025 & 2033
- Figure 23: North America Carbon Foam Market Revenue (Million), by Country 2025 & 2033
- Figure 24: North America Carbon Foam Market Volume (Square Meters), by Country 2025 & 2033
- Figure 25: North America Carbon Foam Market Revenue Share (%), by Country 2025 & 2033
- Figure 26: North America Carbon Foam Market Volume Share (%), by Country 2025 & 2033
- Figure 27: Europe Carbon Foam Market Revenue (Million), by Type 2025 & 2033
- Figure 28: Europe Carbon Foam Market Volume (Square Meters), by Type 2025 & 2033
- Figure 29: Europe Carbon Foam Market Revenue Share (%), by Type 2025 & 2033
- Figure 30: Europe Carbon Foam Market Volume Share (%), by Type 2025 & 2033
- Figure 31: Europe Carbon Foam Market Revenue (Million), by End-user Industry 2025 & 2033
- Figure 32: Europe Carbon Foam Market Volume (Square Meters), by End-user Industry 2025 & 2033
- Figure 33: Europe Carbon Foam Market Revenue Share (%), by End-user Industry 2025 & 2033
- Figure 34: Europe Carbon Foam Market Volume Share (%), by End-user Industry 2025 & 2033
- Figure 35: Europe Carbon Foam Market Revenue (Million), by Country 2025 & 2033
- Figure 36: Europe Carbon Foam Market Volume (Square Meters), by Country 2025 & 2033
- Figure 37: Europe Carbon Foam Market Revenue Share (%), by Country 2025 & 2033
- Figure 38: Europe Carbon Foam Market Volume Share (%), by Country 2025 & 2033
- Figure 39: South America Carbon Foam Market Revenue (Million), by Type 2025 & 2033
- Figure 40: South America Carbon Foam Market Volume (Square Meters), by Type 2025 & 2033
- Figure 41: South America Carbon Foam Market Revenue Share (%), by Type 2025 & 2033
- Figure 42: South America Carbon Foam Market Volume Share (%), by Type 2025 & 2033
- Figure 43: South America Carbon Foam Market Revenue (Million), by End-user Industry 2025 & 2033
- Figure 44: South America Carbon Foam Market Volume (Square Meters), by End-user Industry 2025 & 2033
- Figure 45: South America Carbon Foam Market Revenue Share (%), by End-user Industry 2025 & 2033
- Figure 46: South America Carbon Foam Market Volume Share (%), by End-user Industry 2025 & 2033
- Figure 47: South America Carbon Foam Market Revenue (Million), by Country 2025 & 2033
- Figure 48: South America Carbon Foam Market Volume (Square Meters), by Country 2025 & 2033
- Figure 49: South America Carbon Foam Market Revenue Share (%), by Country 2025 & 2033
- Figure 50: South America Carbon Foam Market Volume Share (%), by Country 2025 & 2033
- Figure 51: Middle East and Africa Carbon Foam Market Revenue (Million), by Type 2025 & 2033
- Figure 52: Middle East and Africa Carbon Foam Market Volume (Square Meters), by Type 2025 & 2033
- Figure 53: Middle East and Africa Carbon Foam Market Revenue Share (%), by Type 2025 & 2033
- Figure 54: Middle East and Africa Carbon Foam Market Volume Share (%), by Type 2025 & 2033
- Figure 55: Middle East and Africa Carbon Foam Market Revenue (Million), by End-user Industry 2025 & 2033
- Figure 56: Middle East and Africa Carbon Foam Market Volume (Square Meters), by End-user Industry 2025 & 2033
- Figure 57: Middle East and Africa Carbon Foam Market Revenue Share (%), by End-user Industry 2025 & 2033
- Figure 58: Middle East and Africa Carbon Foam Market Volume Share (%), by End-user Industry 2025 & 2033
- Figure 59: Middle East and Africa Carbon Foam Market Revenue (Million), by Country 2025 & 2033
- Figure 60: Middle East and Africa Carbon Foam Market Volume (Square Meters), by Country 2025 & 2033
- Figure 61: Middle East and Africa Carbon Foam Market Revenue Share (%), by Country 2025 & 2033
- Figure 62: Middle East and Africa Carbon Foam Market Volume Share (%), by Country 2025 & 2033
List of Tables
- Table 1: Global Carbon Foam Market Revenue Million Forecast, by Type 2020 & 2033
- Table 2: Global Carbon Foam Market Volume Square Meters Forecast, by Type 2020 & 2033
- Table 3: Global Carbon Foam Market Revenue Million Forecast, by End-user Industry 2020 & 2033
- Table 4: Global Carbon Foam Market Volume Square Meters Forecast, by End-user Industry 2020 & 2033
- Table 5: Global Carbon Foam Market Revenue Million Forecast, by Region 2020 & 2033
- Table 6: Global Carbon Foam Market Volume Square Meters Forecast, by Region 2020 & 2033
- Table 7: Global Carbon Foam Market Revenue Million Forecast, by Type 2020 & 2033
- Table 8: Global Carbon Foam Market Volume Square Meters Forecast, by Type 2020 & 2033
- Table 9: Global Carbon Foam Market Revenue Million Forecast, by End-user Industry 2020 & 2033
- Table 10: Global Carbon Foam Market Volume Square Meters Forecast, by End-user Industry 2020 & 2033
- Table 11: Global Carbon Foam Market Revenue Million Forecast, by Country 2020 & 2033
- Table 12: Global Carbon Foam Market Volume Square Meters Forecast, by Country 2020 & 2033
- Table 13: China Carbon Foam Market Revenue (Million) Forecast, by Application 2020 & 2033
- Table 14: China Carbon Foam Market Volume (Square Meters) Forecast, by Application 2020 & 2033
- Table 15: India Carbon Foam Market Revenue (Million) Forecast, by Application 2020 & 2033
- Table 16: India Carbon Foam Market Volume (Square Meters) Forecast, by Application 2020 & 2033
- Table 17: Japan Carbon Foam Market Revenue (Million) Forecast, by Application 2020 & 2033
- Table 18: Japan Carbon Foam Market Volume (Square Meters) Forecast, by Application 2020 & 2033
- Table 19: South Korea Carbon Foam Market Revenue (Million) Forecast, by Application 2020 & 2033
- Table 20: South Korea Carbon Foam Market Volume (Square Meters) Forecast, by Application 2020 & 2033
- Table 21: Malaysia Carbon Foam Market Revenue (Million) Forecast, by Application 2020 & 2033
- Table 22: Malaysia Carbon Foam Market Volume (Square Meters) Forecast, by Application 2020 & 2033
- Table 23: Thailand Carbon Foam Market Revenue (Million) Forecast, by Application 2020 & 2033
- Table 24: Thailand Carbon Foam Market Volume (Square Meters) Forecast, by Application 2020 & 2033
- Table 25: Indonesia Carbon Foam Market Revenue (Million) Forecast, by Application 2020 & 2033
- Table 26: Indonesia Carbon Foam Market Volume (Square Meters) Forecast, by Application 2020 & 2033
- Table 27: Vietnam Carbon Foam Market Revenue (Million) Forecast, by Application 2020 & 2033
- Table 28: Vietnam Carbon Foam Market Volume (Square Meters) Forecast, by Application 2020 & 2033
- Table 29: Rest of Asia Pacific Carbon Foam Market Revenue (Million) Forecast, by Application 2020 & 2033
- Table 30: Rest of Asia Pacific Carbon Foam Market Volume (Square Meters) Forecast, by Application 2020 & 2033
- Table 31: Global Carbon Foam Market Revenue Million Forecast, by Type 2020 & 2033
- Table 32: Global Carbon Foam Market Volume Square Meters Forecast, by Type 2020 & 2033
- Table 33: Global Carbon Foam Market Revenue Million Forecast, by End-user Industry 2020 & 2033
- Table 34: Global Carbon Foam Market Volume Square Meters Forecast, by End-user Industry 2020 & 2033
- Table 35: Global Carbon Foam Market Revenue Million Forecast, by Country 2020 & 2033
- Table 36: Global Carbon Foam Market Volume Square Meters Forecast, by Country 2020 & 2033
- Table 37: United States Carbon Foam Market Revenue (Million) Forecast, by Application 2020 & 2033
- Table 38: United States Carbon Foam Market Volume (Square Meters) Forecast, by Application 2020 & 2033
- Table 39: Canada Carbon Foam Market Revenue (Million) Forecast, by Application 2020 & 2033
- Table 40: Canada Carbon Foam Market Volume (Square Meters) Forecast, by Application 2020 & 2033
- Table 41: Mexico Carbon Foam Market Revenue (Million) Forecast, by Application 2020 & 2033
- Table 42: Mexico Carbon Foam Market Volume (Square Meters) Forecast, by Application 2020 & 2033
- Table 43: Global Carbon Foam Market Revenue Million Forecast, by Type 2020 & 2033
- Table 44: Global Carbon Foam Market Volume Square Meters Forecast, by Type 2020 & 2033
- Table 45: Global Carbon Foam Market Revenue Million Forecast, by End-user Industry 2020 & 2033
- Table 46: Global Carbon Foam Market Volume Square Meters Forecast, by End-user Industry 2020 & 2033
- Table 47: Global Carbon Foam Market Revenue Million Forecast, by Country 2020 & 2033
- Table 48: Global Carbon Foam Market Volume Square Meters Forecast, by Country 2020 & 2033
- Table 49: Germany Carbon Foam Market Revenue (Million) Forecast, by Application 2020 & 2033
- Table 50: Germany Carbon Foam Market Volume (Square Meters) Forecast, by Application 2020 & 2033
- Table 51: United Kingdom Carbon Foam Market Revenue (Million) Forecast, by Application 2020 & 2033
- Table 52: United Kingdom Carbon Foam Market Volume (Square Meters) Forecast, by Application 2020 & 2033
- Table 53: France Carbon Foam Market Revenue (Million) Forecast, by Application 2020 & 2033
- Table 54: France Carbon Foam Market Volume (Square Meters) Forecast, by Application 2020 & 2033
- Table 55: Italy Carbon Foam Market Revenue (Million) Forecast, by Application 2020 & 2033
- Table 56: Italy Carbon Foam Market Volume (Square Meters) Forecast, by Application 2020 & 2033
- Table 57: Spain Carbon Foam Market Revenue (Million) Forecast, by Application 2020 & 2033
- Table 58: Spain Carbon Foam Market Volume (Square Meters) Forecast, by Application 2020 & 2033
- Table 59: Nordic Carbon Foam Market Revenue (Million) Forecast, by Application 2020 & 2033
- Table 60: Nordic Carbon Foam Market Volume (Square Meters) Forecast, by Application 2020 & 2033
- Table 61: Turkey Carbon Foam Market Revenue (Million) Forecast, by Application 2020 & 2033
- Table 62: Turkey Carbon Foam Market Volume (Square Meters) Forecast, by Application 2020 & 2033
- Table 63: Russia Carbon Foam Market Revenue (Million) Forecast, by Application 2020 & 2033
- Table 64: Russia Carbon Foam Market Volume (Square Meters) Forecast, by Application 2020 & 2033
- Table 65: Rest of Europe Carbon Foam Market Revenue (Million) Forecast, by Application 2020 & 2033
- Table 66: Rest of Europe Carbon Foam Market Volume (Square Meters) Forecast, by Application 2020 & 2033
- Table 67: Global Carbon Foam Market Revenue Million Forecast, by Type 2020 & 2033
- Table 68: Global Carbon Foam Market Volume Square Meters Forecast, by Type 2020 & 2033
- Table 69: Global Carbon Foam Market Revenue Million Forecast, by End-user Industry 2020 & 2033
- Table 70: Global Carbon Foam Market Volume Square Meters Forecast, by End-user Industry 2020 & 2033
- Table 71: Global Carbon Foam Market Revenue Million Forecast, by Country 2020 & 2033
- Table 72: Global Carbon Foam Market Volume Square Meters Forecast, by Country 2020 & 2033
- Table 73: Brazil Carbon Foam Market Revenue (Million) Forecast, by Application 2020 & 2033
- Table 74: Brazil Carbon Foam Market Volume (Square Meters) Forecast, by Application 2020 & 2033
- Table 75: Argentina Carbon Foam Market Revenue (Million) Forecast, by Application 2020 & 2033
- Table 76: Argentina Carbon Foam Market Volume (Square Meters) Forecast, by Application 2020 & 2033
- Table 77: Rest of South America Carbon Foam Market Revenue (Million) Forecast, by Application 2020 & 2033
- Table 78: Rest of South America Carbon Foam Market Volume (Square Meters) Forecast, by Application 2020 & 2033
- Table 79: Global Carbon Foam Market Revenue Million Forecast, by Type 2020 & 2033
- Table 80: Global Carbon Foam Market Volume Square Meters Forecast, by Type 2020 & 2033
- Table 81: Global Carbon Foam Market Revenue Million Forecast, by End-user Industry 2020 & 2033
- Table 82: Global Carbon Foam Market Volume Square Meters Forecast, by End-user Industry 2020 & 2033
- Table 83: Global Carbon Foam Market Revenue Million Forecast, by Country 2020 & 2033
- Table 84: Global Carbon Foam Market Volume Square Meters Forecast, by Country 2020 & 2033
- Table 85: Saudi Arabia Carbon Foam Market Revenue (Million) Forecast, by Application 2020 & 2033
- Table 86: Saudi Arabia Carbon Foam Market Volume (Square Meters) Forecast, by Application 2020 & 2033
- Table 87: South Africa Carbon Foam Market Revenue (Million) Forecast, by Application 2020 & 2033
- Table 88: South Africa Carbon Foam Market Volume (Square Meters) Forecast, by Application 2020 & 2033
- Table 89: Rest of Middle East and Africa Carbon Foam Market Revenue (Million) Forecast, by Application 2020 & 2033
- Table 90: Rest of Middle East and Africa Carbon Foam Market Volume (Square Meters) Forecast, by Application 2020 & 2033
Frequently Asked Questions
1. What is the projected Compound Annual Growth Rate (CAGR) of the Carbon Foam Market?
The projected CAGR is approximately 10.73%.
2. Which companies are prominent players in the Carbon Foam Market?
Key companies in the market include American Elements, Ultramet, Entegris Inc, ERG Aerospace, CONSOL Energy Inc, Carbon-Core Corporation, Xiamen Zopin New Material Limited, Koppers Inc, Firefly International Energy.
3. What are the main segments of the Carbon Foam Market?
The market segments include Type, End-user Industry.
4. Can you provide details about the market size?
The market size is estimated to be USD 23.88 Million as of 2022.
5. What are some drivers contributing to market growth?
Increasing Usage in the Aerospace and Defense Industry; Environmental Concerns and a Push for Sustainable Solutions; Others.
6. What are the notable trends driving market growth?
The Usage of Carbon Foam is Increasing in the Aerospace and Defense Industry.
7. Are there any restraints impacting market growth?
The High Cost of the Production Process of Carbon Foam; Others.
8. Can you provide examples of recent developments in the market?
November 2023: Carbon foam was obtained by scientists from the Institute of Catalysts of the Siberian branch of the Russian Academy of Sciences. The raw material for the new material is oil refining waste. The synthesis of this material does not need foaming agents.
9. What pricing options are available for accessing the report?
Pricing options include single-user, multi-user, and enterprise licenses priced at USD 4750, USD 5250, and USD 8750 respectively.
10. Is the market size provided in terms of value or volume?
The market size is provided in terms of value, measured in Million and volume, measured in Square Meters.
11. Are there any specific market keywords associated with the report?
Yes, the market keyword associated with the report is "Carbon Foam Market," which aids in identifying and referencing the specific market segment covered.
12. How do I determine which pricing option suits my needs best?
The pricing options vary based on user requirements and access needs. Individual users may opt for single-user licenses, while businesses requiring broader access may choose multi-user or enterprise licenses for cost-effective access to the report.
13. Are there any additional resources or data provided in the Carbon Foam Market report?
While the report offers comprehensive insights, it's advisable to review the specific contents or supplementary materials provided to ascertain if additional resources or data are available.
14. How can I stay updated on further developments or reports in the Carbon Foam Market?
To stay informed about further developments, trends, and reports in the Carbon Foam Market, consider subscribing to industry newsletters, following relevant companies and organizations, or regularly checking reputable industry news sources and publications.
Methodology
Step 1 - Identification of Relevant Samples Size from Population Database


Step 2 - Approaches for Defining Global Market Size (Value, Volume* & Price*)

Note*: In applicable scenarios
Step 3 - Data Sources
Primary Research
- Web Analytics
- Survey Reports
- Research Institute
- Latest Research Reports
- Opinion Leaders
Secondary Research
- Annual Reports
- White Paper
- Latest Press Release
- Industry Association
- Paid Database
- Investor Presentations

Step 4 - Data Triangulation
Involves using different sources of information in order to increase the validity of a study
These sources are likely to be stakeholders in a program - participants, other researchers, program staff, other community members, and so on.
Then we put all data in single framework & apply various statistical tools to find out the dynamic on the market.
During the analysis stage, feedback from the stakeholder groups would be compared to determine areas of agreement as well as areas of divergence

