Key Insights
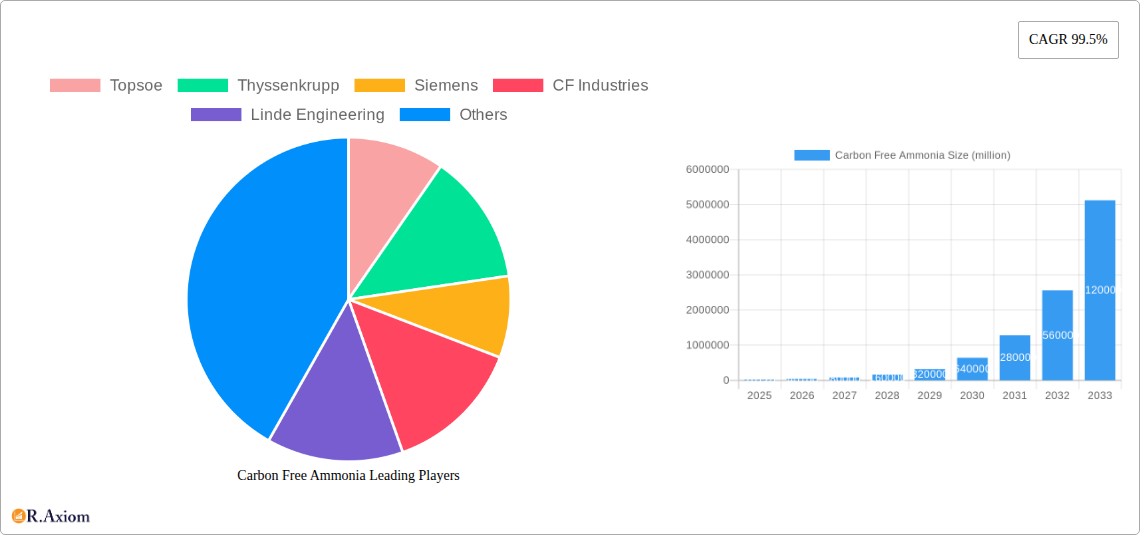
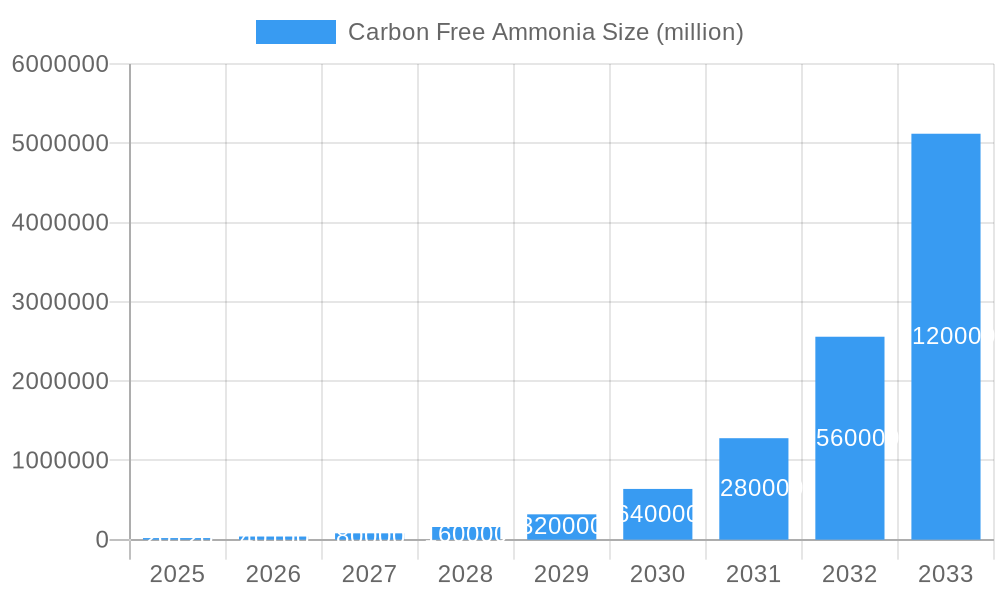
The carbon-free ammonia market is experiencing explosive growth, driven by the urgent need to decarbonize the fertilizer industry and the burgeoning green hydrogen sector. With a market size of $20,120 million in 2025 and a remarkable Compound Annual Growth Rate (CAGR) of 99.5%, the market is poised for substantial expansion through 2033. This rapid growth is fueled by increasing government regulations aimed at reducing greenhouse gas emissions, coupled with growing corporate commitments to achieving net-zero targets. Major players like Topsoe, Thyssenkrupp, Siemens, CF Industries, Linde Engineering, Vestas, and Nanjing Kapsom are actively investing in research and development, driving innovation in production technologies and creating a more competitive landscape. The market is segmented by production method (e.g., electrolysis, photoelectrochemical), application (fertilizer, fuel), and geography, offering diverse investment and growth opportunities. Challenges remain, however, including the high capital costs associated with green ammonia production and the need for robust infrastructure to support hydrogen supply chains. Despite these hurdles, the long-term outlook for carbon-free ammonia is exceptionally positive, driven by its crucial role in achieving global climate goals.
Carbon Free Ammonia Market Size (In Billion)
The forecast period of 2025-2033 anticipates continued, albeit potentially slightly moderated, growth. While maintaining a CAGR of 99.5% throughout the entire forecast period may be unrealistic, a conservative projection suggests a significant expansion, reflecting the market's inherent dynamism. Factors such as technological advancements, economies of scale in production, and further policy support will influence the actual CAGR. Market segmentation will likely evolve as specific production methods and applications gain traction, leading to shifts in market share among the key players and creating niche opportunities for emerging companies. Geographical distribution will also play a significant role, with regions having access to abundant renewable energy resources experiencing faster growth. Comprehensive analysis of these factors is crucial for stakeholders to navigate this rapidly evolving market and capitalize on its substantial potential.
Carbon Free Ammonia Company Market Share
Carbon Free Ammonia Market: A Comprehensive Report (2019-2033)
This comprehensive report provides an in-depth analysis of the burgeoning Carbon Free Ammonia (CFA) market, offering invaluable insights for industry stakeholders, investors, and policymakers. The study period covers 2019-2033, with a base year of 2025 and a forecast period of 2025-2033. The report leverages extensive primary and secondary research to deliver actionable intelligence, including detailed market sizing, segmentation, growth projections, and competitive landscape analysis. This report is indispensable for navigating the complexities of this rapidly evolving sector and capitalizing on emerging opportunities. The market is expected to reach xx million by 2033, demonstrating a significant CAGR of xx% during the forecast period.
Carbon Free Ammonia Market Concentration & Innovation
This section analyzes the market concentration, innovation drivers, regulatory landscape, and competitive dynamics within the CFA market. The report explores the market share held by key players like Topsoe, Thyssenkrupp, Siemens, CF Industries, Linde Engineering, Vestas, and Nanjing Kapsom, highlighting their strategic initiatives and market positions. Furthermore, it examines the impact of mergers and acquisitions (M&A) activities, quantifying deal values in millions where possible. For example, the report might detail an M&A deal valued at $xx million impacting market share dynamics. The analysis includes an assessment of regulatory frameworks influencing innovation, the emergence of substitute products, and evolving end-user trends shaping market demand. The report also includes an examination of the innovation landscape with a detailed breakdown of R&D investments, patent filings, and technological advancements driving market growth.
- Market Concentration: Detailed analysis of market share distribution among key players.
- Innovation Drivers: Exploration of technological advancements, R&D investments, and government policies promoting CFA development.
- Regulatory Frameworks: Analysis of global and regional regulations impacting CFA production and deployment.
- Product Substitutes: Assessment of alternative technologies and their potential impact on market share.
- End-User Trends: Examination of changing consumer preferences and their implications for CFA demand.
- M&A Activities: Analysis of recent mergers and acquisitions, including deal values and their effect on market consolidation.
Carbon Free Ammonia Industry Trends & Insights
This section delves into the key trends and insights shaping the CFA market. It explores the market growth drivers, such as the increasing demand for clean energy and stringent environmental regulations. The analysis further examines technological disruptions, focusing on advancements in production methods, energy efficiency, and cost reductions. The report assesses consumer preferences for sustainable products and their impact on market demand. It also analyzes the competitive dynamics, including pricing strategies, partnerships, and new market entrants. The report uses specific metrics like CAGR to illustrate the market's growth trajectory and analyzes market penetration rates across different segments. The impact of global events and economic factors on the market's growth are also carefully considered.
Dominant Markets & Segments in Carbon Free Ammonia
This section identifies the leading regions, countries, and segments within the CFA market. A detailed analysis of market dominance is provided, highlighting the key drivers behind the leading regions' success. These drivers can include supportive economic policies, well-established infrastructure, and favorable regulatory environments. The analysis will cover the significant factors influencing market growth and penetration in each prominent region.
- Leading Region/Country: Identification of the dominant market and reasons for its leadership (e.g., policy support, infrastructure, resource availability).
- Key Drivers: Detailed breakdown of economic, political, and technological factors driving growth in dominant segments.
- Dominance Analysis: In-depth explanation of the factors contributing to the market leadership of specific regions or segments.
Carbon Free Ammonia Product Developments
This section summarizes the latest product innovations, applications, and competitive advantages of CFA products. It emphasizes technological trends, such as advancements in production technologies and the development of new applications. The analysis focuses on how these innovations are addressing market needs and creating competitive advantages for industry players. The section also covers the market fit of new products and their potential impact on the overall market.
Report Scope & Segmentation Analysis
This section provides a detailed breakdown of market segmentation by various factors such as production method, application, and end-use industry. Each segment's growth projections, market size, and competitive dynamics are discussed. The report also analyzes the interplay between different segments and their contributions to the overall market growth. For each segment, the report will provide a specific market size in millions for the base year (2025) and forecasts for the period 2025-2033.
Key Drivers of Carbon Free Ammonia Growth
This section outlines the key factors driving the growth of the CFA market. This includes technological advancements leading to cost reductions and efficiency improvements in production, supportive government policies and incentives, and the increasing demand for clean energy sources to mitigate climate change. Specific examples of these drivers are highlighted.
Challenges in the Carbon Free Ammonia Sector
This section discusses the challenges and restraints hindering the growth of the CFA market. These challenges include high production costs, scaling up production to meet rising demand, the lack of sufficient infrastructure for transportation and storage, and regulatory hurdles. Quantifiable impacts of these challenges are discussed, wherever possible.
Emerging Opportunities in Carbon Free Ammonia
This section identifies emerging opportunities within the CFA market, such as the development of new applications in various sectors and the potential for expansion into new geographical regions. The potential for technological advancements to further reduce costs and improve efficiency is also discussed. The analysis looks at changing consumer preferences, shifting policy landscapes, and technological breakthroughs that present significant growth opportunities.
Leading Players in the Carbon Free Ammonia Market
- Topsoe
- Thyssenkrupp
- Siemens
- CF Industries
- Linde Engineering
- Vestas
- Nanjing Kapsom
Key Developments in Carbon Free Ammonia Industry
- [Month, Year]: [Development Description and its impact on the market] – e.g., "January 2023: Topsoe announced a new partnership with CF Industries to build a large-scale green ammonia production facility, significantly increasing the production capacity of green ammonia."
- [Month, Year]: [Development Description and its impact on the market]
- [Month, Year]: [Development Description and its impact on the market]
Strategic Outlook for Carbon Free Ammonia Market
This section summarizes the growth catalysts and future market potential for CFA. It highlights the key opportunities and challenges that will shape the market in the coming years. The analysis identifies strategic imperatives for companies operating in the market, providing recommendations for future success and growth. The report concludes with a forecast of the market's trajectory, incorporating factors like technological innovations, policy developments, and economic conditions to provide a well-informed outlook on the future.
Carbon Free Ammonia Segmentation
-
1. Application
- 1.1. Fertilizer
- 1.2. Fuel
- 1.3. Others
-
2. Type
- 2.1. Wind Power Hydrogen Production
- 2.2. Photovoltaic Hydrogen Production
Carbon Free Ammonia Segmentation By Geography
-
1. North America
- 1.1. United States
- 1.2. Canada
- 1.3. Mexico
-
2. South America
- 2.1. Brazil
- 2.2. Argentina
- 2.3. Rest of South America
-
3. Europe
- 3.1. United Kingdom
- 3.2. Germany
- 3.3. France
- 3.4. Italy
- 3.5. Spain
- 3.6. Russia
- 3.7. Benelux
- 3.8. Nordics
- 3.9. Rest of Europe
-
4. Middle East & Africa
- 4.1. Turkey
- 4.2. Israel
- 4.3. GCC
- 4.4. North Africa
- 4.5. South Africa
- 4.6. Rest of Middle East & Africa
-
5. Asia Pacific
- 5.1. China
- 5.2. India
- 5.3. Japan
- 5.4. South Korea
- 5.5. ASEAN
- 5.6. Oceania
- 5.7. Rest of Asia Pacific
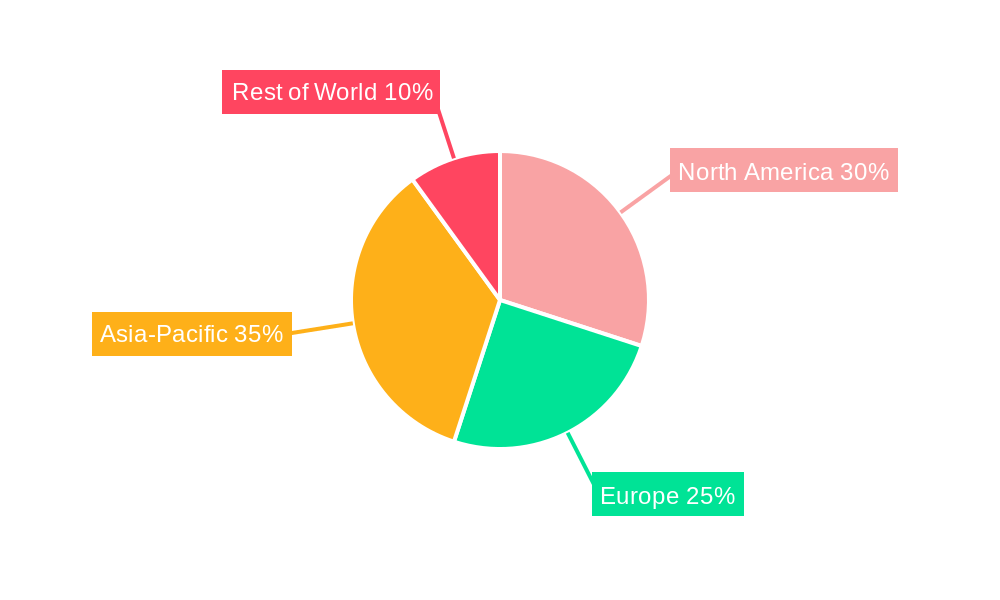
Carbon Free Ammonia Regional Market Share
Geographic Coverage of Carbon Free Ammonia
Carbon Free Ammonia REPORT HIGHLIGHTS
| Aspects | Details |
|---|---|
| Study Period | 2020-2034 |
| Base Year | 2025 |
| Estimated Year | 2026 |
| Forecast Period | 2026-2034 |
| Historical Period | 2020-2025 |
| Growth Rate | CAGR of 99.5% from 2020-2034 |
| Segmentation |
|
Table of Contents
- 1. Introduction
- 1.1. Research Scope
- 1.2. Market Segmentation
- 1.3. Research Objective
- 1.4. Definitions and Assumptions
- 2. Executive Summary
- 2.1. Market Snapshot
- 3. Market Dynamics
- 3.1. Market Drivers
- 3.2. Market Restrains
- 3.3. Market Trends
- 3.4. Market Opportunities
- 4. Market Factor Analysis
- 4.1. Porters Five Forces
- 4.1.1. Bargaining Power of Suppliers
- 4.1.2. Bargaining Power of Buyers
- 4.1.3. Threat of New Entrants
- 4.1.4. Threat of Substitutes
- 4.1.5. Competitive Rivalry
- 4.2. PESTEL analysis
- 4.3. BCG Analysis
- 4.3.1. Stars (High Growth, High Market Share)
- 4.3.2. Cash Cows (Low Growth, High Market Share)
- 4.3.3. Question Mark (High Growth, Low Market Share)
- 4.3.4. Dogs (Low Growth, Low Market Share)
- 4.4. Ansoff Matrix Analysis
- 4.5. Supply Chain Analysis
- 4.6. Regulatory Landscape
- 4.7. Current Market Potential and Opportunity Assessment (TAM–SAM–SOM Framework)
- 4.8. RAX Analyst Note
- 4.1. Porters Five Forces
- 5. Market Analysis, Insights and Forecast 2021-2033
- 5.1. Market Analysis, Insights and Forecast - by Application
- 5.1.1. Fertilizer
- 5.1.2. Fuel
- 5.1.3. Others
- 5.2. Market Analysis, Insights and Forecast - by Type
- 5.2.1. Wind Power Hydrogen Production
- 5.2.2. Photovoltaic Hydrogen Production
- 5.3. Market Analysis, Insights and Forecast - by Region
- 5.3.1. North America
- 5.3.2. South America
- 5.3.3. Europe
- 5.3.4. Middle East & Africa
- 5.3.5. Asia Pacific
- 5.1. Market Analysis, Insights and Forecast - by Application
- 6. Global Carbon Free Ammonia Analysis, Insights and Forecast, 2021-2033
- 6.1. Market Analysis, Insights and Forecast - by Application
- 6.1.1. Fertilizer
- 6.1.2. Fuel
- 6.1.3. Others
- 6.2. Market Analysis, Insights and Forecast - by Type
- 6.2.1. Wind Power Hydrogen Production
- 6.2.2. Photovoltaic Hydrogen Production
- 6.1. Market Analysis, Insights and Forecast - by Application
- 7. North America Carbon Free Ammonia Analysis, Insights and Forecast, 2020-2032
- 7.1. Market Analysis, Insights and Forecast - by Application
- 7.1.1. Fertilizer
- 7.1.2. Fuel
- 7.1.3. Others
- 7.2. Market Analysis, Insights and Forecast - by Type
- 7.2.1. Wind Power Hydrogen Production
- 7.2.2. Photovoltaic Hydrogen Production
- 7.1. Market Analysis, Insights and Forecast - by Application
- 8. South America Carbon Free Ammonia Analysis, Insights and Forecast, 2020-2032
- 8.1. Market Analysis, Insights and Forecast - by Application
- 8.1.1. Fertilizer
- 8.1.2. Fuel
- 8.1.3. Others
- 8.2. Market Analysis, Insights and Forecast - by Type
- 8.2.1. Wind Power Hydrogen Production
- 8.2.2. Photovoltaic Hydrogen Production
- 8.1. Market Analysis, Insights and Forecast - by Application
- 9. Europe Carbon Free Ammonia Analysis, Insights and Forecast, 2020-2032
- 9.1. Market Analysis, Insights and Forecast - by Application
- 9.1.1. Fertilizer
- 9.1.2. Fuel
- 9.1.3. Others
- 9.2. Market Analysis, Insights and Forecast - by Type
- 9.2.1. Wind Power Hydrogen Production
- 9.2.2. Photovoltaic Hydrogen Production
- 9.1. Market Analysis, Insights and Forecast - by Application
- 10. Middle East & Africa Carbon Free Ammonia Analysis, Insights and Forecast, 2020-2032
- 10.1. Market Analysis, Insights and Forecast - by Application
- 10.1.1. Fertilizer
- 10.1.2. Fuel
- 10.1.3. Others
- 10.2. Market Analysis, Insights and Forecast - by Type
- 10.2.1. Wind Power Hydrogen Production
- 10.2.2. Photovoltaic Hydrogen Production
- 10.1. Market Analysis, Insights and Forecast - by Application
- 11. Asia Pacific Carbon Free Ammonia Analysis, Insights and Forecast, 2020-2032
- 11.1. Market Analysis, Insights and Forecast - by Application
- 11.1.1. Fertilizer
- 11.1.2. Fuel
- 11.1.3. Others
- 11.2. Market Analysis, Insights and Forecast - by Type
- 11.2.1. Wind Power Hydrogen Production
- 11.2.2. Photovoltaic Hydrogen Production
- 11.1. Market Analysis, Insights and Forecast - by Application
- 12. Competitive Analysis
- 12.1. Company Profiles
- 12.1.1 Topsoe
- 12.1.1.1. Company Overview
- 12.1.1.2. Products
- 12.1.1.3. Company Financials
- 12.1.1.4. SWOT Analysis
- 12.1.2 Thyssenkrupp
- 12.1.2.1. Company Overview
- 12.1.2.2. Products
- 12.1.2.3. Company Financials
- 12.1.2.4. SWOT Analysis
- 12.1.3 Siemens
- 12.1.3.1. Company Overview
- 12.1.3.2. Products
- 12.1.3.3. Company Financials
- 12.1.3.4. SWOT Analysis
- 12.1.4 CF Industries
- 12.1.4.1. Company Overview
- 12.1.4.2. Products
- 12.1.4.3. Company Financials
- 12.1.4.4. SWOT Analysis
- 12.1.5 Linde Engineering
- 12.1.5.1. Company Overview
- 12.1.5.2. Products
- 12.1.5.3. Company Financials
- 12.1.5.4. SWOT Analysis
- 12.1.6 Vestas
- 12.1.6.1. Company Overview
- 12.1.6.2. Products
- 12.1.6.3. Company Financials
- 12.1.6.4. SWOT Analysis
- 12.1.7 Nanjing Kapsom
- 12.1.7.1. Company Overview
- 12.1.7.2. Products
- 12.1.7.3. Company Financials
- 12.1.7.4. SWOT Analysis
- 12.1.1 Topsoe
- 12.2. Market Entropy
- 12.2.1 Company's Key Areas Served
- 12.2.2 Recent Developments
- 12.3. Company Market Share Analysis 2025
- 12.3.1 Top 5 Companies Market Share Analysis
- 12.3.2 Top 3 Companies Market Share Analysis
- 12.4. List of Potential Customers
- 13. Research Methodology
List of Figures
- Figure 1: Global Carbon Free Ammonia Revenue Breakdown (million, %) by Region 2025 & 2033
- Figure 2: North America Carbon Free Ammonia Revenue (million), by Application 2025 & 2033
- Figure 3: North America Carbon Free Ammonia Revenue Share (%), by Application 2025 & 2033
- Figure 4: North America Carbon Free Ammonia Revenue (million), by Type 2025 & 2033
- Figure 5: North America Carbon Free Ammonia Revenue Share (%), by Type 2025 & 2033
- Figure 6: North America Carbon Free Ammonia Revenue (million), by Country 2025 & 2033
- Figure 7: North America Carbon Free Ammonia Revenue Share (%), by Country 2025 & 2033
- Figure 8: South America Carbon Free Ammonia Revenue (million), by Application 2025 & 2033
- Figure 9: South America Carbon Free Ammonia Revenue Share (%), by Application 2025 & 2033
- Figure 10: South America Carbon Free Ammonia Revenue (million), by Type 2025 & 2033
- Figure 11: South America Carbon Free Ammonia Revenue Share (%), by Type 2025 & 2033
- Figure 12: South America Carbon Free Ammonia Revenue (million), by Country 2025 & 2033
- Figure 13: South America Carbon Free Ammonia Revenue Share (%), by Country 2025 & 2033
- Figure 14: Europe Carbon Free Ammonia Revenue (million), by Application 2025 & 2033
- Figure 15: Europe Carbon Free Ammonia Revenue Share (%), by Application 2025 & 2033
- Figure 16: Europe Carbon Free Ammonia Revenue (million), by Type 2025 & 2033
- Figure 17: Europe Carbon Free Ammonia Revenue Share (%), by Type 2025 & 2033
- Figure 18: Europe Carbon Free Ammonia Revenue (million), by Country 2025 & 2033
- Figure 19: Europe Carbon Free Ammonia Revenue Share (%), by Country 2025 & 2033
- Figure 20: Middle East & Africa Carbon Free Ammonia Revenue (million), by Application 2025 & 2033
- Figure 21: Middle East & Africa Carbon Free Ammonia Revenue Share (%), by Application 2025 & 2033
- Figure 22: Middle East & Africa Carbon Free Ammonia Revenue (million), by Type 2025 & 2033
- Figure 23: Middle East & Africa Carbon Free Ammonia Revenue Share (%), by Type 2025 & 2033
- Figure 24: Middle East & Africa Carbon Free Ammonia Revenue (million), by Country 2025 & 2033
- Figure 25: Middle East & Africa Carbon Free Ammonia Revenue Share (%), by Country 2025 & 2033
- Figure 26: Asia Pacific Carbon Free Ammonia Revenue (million), by Application 2025 & 2033
- Figure 27: Asia Pacific Carbon Free Ammonia Revenue Share (%), by Application 2025 & 2033
- Figure 28: Asia Pacific Carbon Free Ammonia Revenue (million), by Type 2025 & 2033
- Figure 29: Asia Pacific Carbon Free Ammonia Revenue Share (%), by Type 2025 & 2033
- Figure 30: Asia Pacific Carbon Free Ammonia Revenue (million), by Country 2025 & 2033
- Figure 31: Asia Pacific Carbon Free Ammonia Revenue Share (%), by Country 2025 & 2033
List of Tables
- Table 1: Global Carbon Free Ammonia Revenue million Forecast, by Application 2020 & 2033
- Table 2: Global Carbon Free Ammonia Revenue million Forecast, by Type 2020 & 2033
- Table 3: Global Carbon Free Ammonia Revenue million Forecast, by Region 2020 & 2033
- Table 4: Global Carbon Free Ammonia Revenue million Forecast, by Application 2020 & 2033
- Table 5: Global Carbon Free Ammonia Revenue million Forecast, by Type 2020 & 2033
- Table 6: Global Carbon Free Ammonia Revenue million Forecast, by Country 2020 & 2033
- Table 7: United States Carbon Free Ammonia Revenue (million) Forecast, by Application 2020 & 2033
- Table 8: Canada Carbon Free Ammonia Revenue (million) Forecast, by Application 2020 & 2033
- Table 9: Mexico Carbon Free Ammonia Revenue (million) Forecast, by Application 2020 & 2033
- Table 10: Global Carbon Free Ammonia Revenue million Forecast, by Application 2020 & 2033
- Table 11: Global Carbon Free Ammonia Revenue million Forecast, by Type 2020 & 2033
- Table 12: Global Carbon Free Ammonia Revenue million Forecast, by Country 2020 & 2033
- Table 13: Brazil Carbon Free Ammonia Revenue (million) Forecast, by Application 2020 & 2033
- Table 14: Argentina Carbon Free Ammonia Revenue (million) Forecast, by Application 2020 & 2033
- Table 15: Rest of South America Carbon Free Ammonia Revenue (million) Forecast, by Application 2020 & 2033
- Table 16: Global Carbon Free Ammonia Revenue million Forecast, by Application 2020 & 2033
- Table 17: Global Carbon Free Ammonia Revenue million Forecast, by Type 2020 & 2033
- Table 18: Global Carbon Free Ammonia Revenue million Forecast, by Country 2020 & 2033
- Table 19: United Kingdom Carbon Free Ammonia Revenue (million) Forecast, by Application 2020 & 2033
- Table 20: Germany Carbon Free Ammonia Revenue (million) Forecast, by Application 2020 & 2033
- Table 21: France Carbon Free Ammonia Revenue (million) Forecast, by Application 2020 & 2033
- Table 22: Italy Carbon Free Ammonia Revenue (million) Forecast, by Application 2020 & 2033
- Table 23: Spain Carbon Free Ammonia Revenue (million) Forecast, by Application 2020 & 2033
- Table 24: Russia Carbon Free Ammonia Revenue (million) Forecast, by Application 2020 & 2033
- Table 25: Benelux Carbon Free Ammonia Revenue (million) Forecast, by Application 2020 & 2033
- Table 26: Nordics Carbon Free Ammonia Revenue (million) Forecast, by Application 2020 & 2033
- Table 27: Rest of Europe Carbon Free Ammonia Revenue (million) Forecast, by Application 2020 & 2033
- Table 28: Global Carbon Free Ammonia Revenue million Forecast, by Application 2020 & 2033
- Table 29: Global Carbon Free Ammonia Revenue million Forecast, by Type 2020 & 2033
- Table 30: Global Carbon Free Ammonia Revenue million Forecast, by Country 2020 & 2033
- Table 31: Turkey Carbon Free Ammonia Revenue (million) Forecast, by Application 2020 & 2033
- Table 32: Israel Carbon Free Ammonia Revenue (million) Forecast, by Application 2020 & 2033
- Table 33: GCC Carbon Free Ammonia Revenue (million) Forecast, by Application 2020 & 2033
- Table 34: North Africa Carbon Free Ammonia Revenue (million) Forecast, by Application 2020 & 2033
- Table 35: South Africa Carbon Free Ammonia Revenue (million) Forecast, by Application 2020 & 2033
- Table 36: Rest of Middle East & Africa Carbon Free Ammonia Revenue (million) Forecast, by Application 2020 & 2033
- Table 37: Global Carbon Free Ammonia Revenue million Forecast, by Application 2020 & 2033
- Table 38: Global Carbon Free Ammonia Revenue million Forecast, by Type 2020 & 2033
- Table 39: Global Carbon Free Ammonia Revenue million Forecast, by Country 2020 & 2033
- Table 40: China Carbon Free Ammonia Revenue (million) Forecast, by Application 2020 & 2033
- Table 41: India Carbon Free Ammonia Revenue (million) Forecast, by Application 2020 & 2033
- Table 42: Japan Carbon Free Ammonia Revenue (million) Forecast, by Application 2020 & 2033
- Table 43: South Korea Carbon Free Ammonia Revenue (million) Forecast, by Application 2020 & 2033
- Table 44: ASEAN Carbon Free Ammonia Revenue (million) Forecast, by Application 2020 & 2033
- Table 45: Oceania Carbon Free Ammonia Revenue (million) Forecast, by Application 2020 & 2033
- Table 46: Rest of Asia Pacific Carbon Free Ammonia Revenue (million) Forecast, by Application 2020 & 2033
Frequently Asked Questions
1. What is the projected Compound Annual Growth Rate (CAGR) of the Carbon Free Ammonia?
The projected CAGR is approximately 99.5%.
2. Which companies are prominent players in the Carbon Free Ammonia?
Key companies in the market include Topsoe, Thyssenkrupp, Siemens, CF Industries, Linde Engineering, Vestas, Nanjing Kapsom.
3. What are the main segments of the Carbon Free Ammonia?
The market segments include Application, Type.
4. Can you provide details about the market size?
The market size is estimated to be USD 20120 million as of 2022.
5. What are some drivers contributing to market growth?
N/A
6. What are the notable trends driving market growth?
N/A
7. Are there any restraints impacting market growth?
N/A
8. Can you provide examples of recent developments in the market?
N/A
9. What pricing options are available for accessing the report?
Pricing options include single-user, multi-user, and enterprise licenses priced at USD 2900.00, USD 4350.00, and USD 5800.00 respectively.
10. Is the market size provided in terms of value or volume?
The market size is provided in terms of value, measured in million.
11. Are there any specific market keywords associated with the report?
Yes, the market keyword associated with the report is "Carbon Free Ammonia," which aids in identifying and referencing the specific market segment covered.
12. How do I determine which pricing option suits my needs best?
The pricing options vary based on user requirements and access needs. Individual users may opt for single-user licenses, while businesses requiring broader access may choose multi-user or enterprise licenses for cost-effective access to the report.
13. Are there any additional resources or data provided in the Carbon Free Ammonia report?
While the report offers comprehensive insights, it's advisable to review the specific contents or supplementary materials provided to ascertain if additional resources or data are available.
14. How can I stay updated on further developments or reports in the Carbon Free Ammonia?
To stay informed about further developments, trends, and reports in the Carbon Free Ammonia, consider subscribing to industry newsletters, following relevant companies and organizations, or regularly checking reputable industry news sources and publications.
Methodology
Step 1 - Identification of Relevant Samples Size from Population Database


Step 2 - Approaches for Defining Global Market Size (Value, Volume* & Price*)

Note*: In applicable scenarios
Step 3 - Data Sources
Primary Research
- Web Analytics
- Survey Reports
- Research Institute
- Latest Research Reports
- Opinion Leaders
Secondary Research
- Annual Reports
- White Paper
- Latest Press Release
- Industry Association
- Paid Database
- Investor Presentations

Step 4 - Data Triangulation
Involves using different sources of information in order to increase the validity of a study
These sources are likely to be stakeholders in a program - participants, other researchers, program staff, other community members, and so on.
Then we put all data in single framework & apply various statistical tools to find out the dynamic on the market.
During the analysis stage, feedback from the stakeholder groups would be compared to determine areas of agreement as well as areas of divergence

