

Key Insights
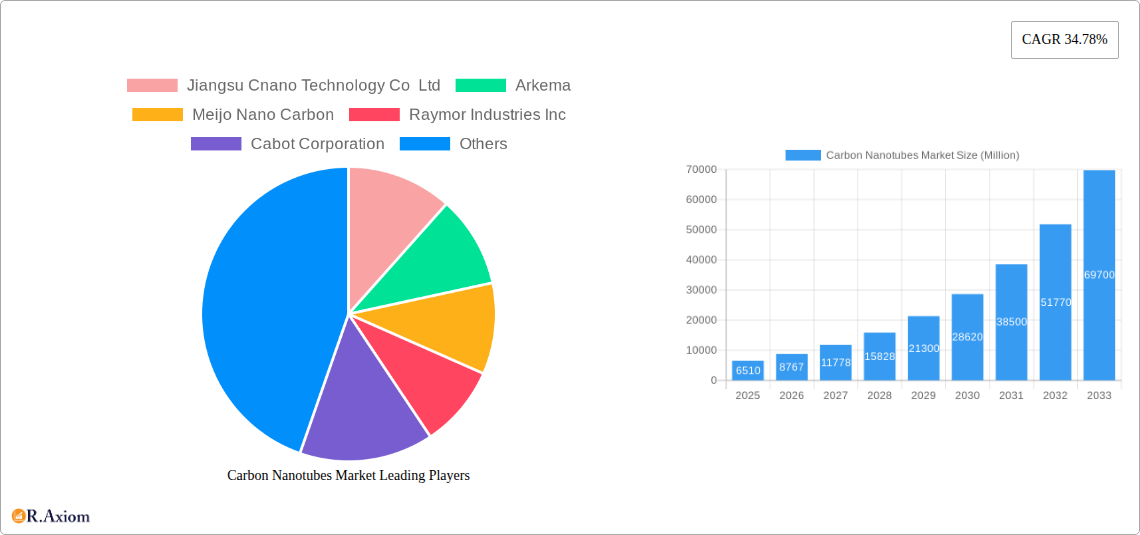
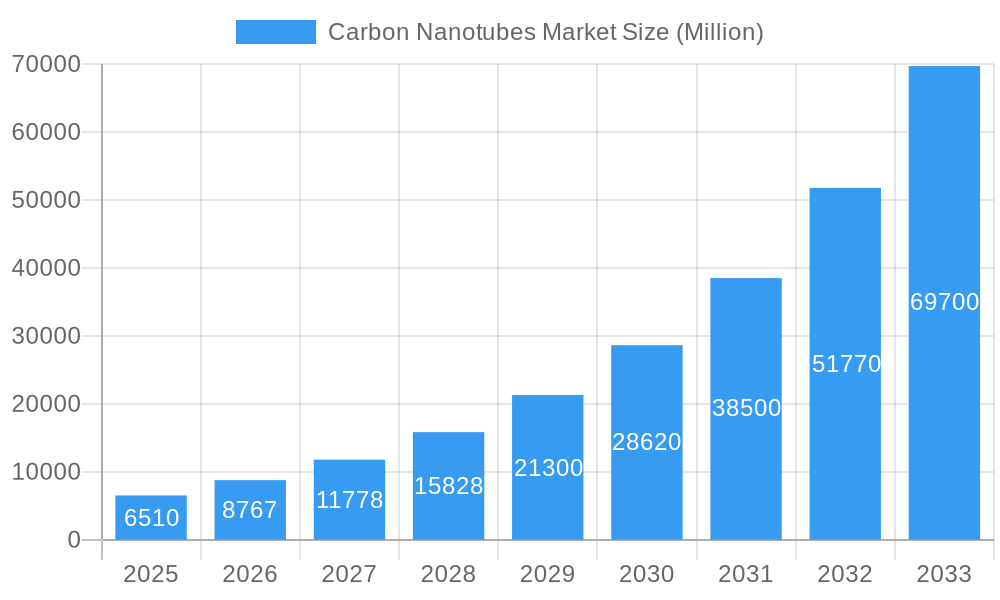
The global carbon nanotubes (CNTs) market is experiencing robust growth, projected to reach \$6.51 billion in 2025 and exhibiting a remarkable Compound Annual Growth Rate (CAGR) of 34.78% from 2025 to 2033. This expansion is driven by several key factors. The increasing demand for lightweight yet high-strength materials in the aerospace and automotive industries is a significant contributor. Furthermore, the burgeoning electronics sector, particularly in advanced semiconductors and energy storage solutions like batteries and supercapacitors, fuels the demand for CNTs' unique electrical and thermal properties. The healthcare industry is also embracing CNTs for applications in drug delivery systems and advanced medical imaging, further bolstering market growth. Technological advancements in CNT synthesis and functionalization are making them more cost-effective and versatile, opening up new avenues for applications. The rising adoption of sustainable materials and manufacturing processes is also positively impacting the market, as CNTs offer a potential solution for reducing the environmental footprint of various industries.
Carbon Nanotubes Market Market Size (In Billion)
However, challenges remain. The relatively high production cost of high-quality CNTs, especially single-walled carbon nanotubes (SWCNTs), can hinder widespread adoption, particularly in price-sensitive markets. Moreover, concerns regarding the potential health and environmental impacts of CNTs necessitate further research and the development of safe handling and disposal protocols. Despite these constraints, the ongoing innovation in CNT production methods and the expanding applications across diverse sectors suggest a positive outlook for the CNT market. The market segmentation, with MWCNTs currently dominating the market type, is expected to evolve as SWCNTs’ superior properties drive increased adoption in high-value applications. Geographic growth is expected to be strongest in Asia-Pacific, driven by significant investments in manufacturing and technology development in regions like China and India.
Carbon Nanotubes Market Company Market Share
Carbon Nanotubes Market: A Comprehensive Report (2019-2033)
This in-depth report provides a comprehensive analysis of the Carbon Nanotubes market, encompassing historical data (2019-2024), current estimates (2025), and future forecasts (2025-2033). It delves into market dynamics, key players, technological advancements, and emerging trends to offer actionable insights for industry stakeholders. The report utilizes a robust methodology, incorporating both qualitative and quantitative analyses, to provide a clear and concise understanding of this rapidly evolving market. The total market size is projected to reach xx Million by 2033, exhibiting a CAGR of xx% during the forecast period.
Carbon Nanotubes Market Concentration & Innovation
This section analyzes the competitive landscape of the carbon nanotubes market, encompassing market concentration, innovation drivers, regulatory frameworks, product substitutes, end-user trends, and mergers and acquisitions (M&A) activities. The market is moderately concentrated, with several key players holding significant market share. However, the emergence of new technologies and applications continues to foster innovation and competition.
- Market Concentration: The top five players, including LG Chem, Cabot Corporation, Showa Denko KK (Resonac Holdings Corporation), Ocsial, and Nanocyl SA, collectively hold approximately xx% of the global market share in 2025.
- Innovation Drivers: Significant investments in R&D, coupled with the growing demand for lightweight, high-strength materials across various industries, are driving innovation within the market. This includes advancements in CNT synthesis techniques, functionalization methods, and the development of novel composite materials.
- Regulatory Frameworks: Government regulations related to environmental impact and material safety are increasingly shaping the development and deployment of carbon nanotubes.
- Product Substitutes: While carbon nanotubes offer unique advantages, alternative materials like graphene and other advanced nanomaterials pose competitive challenges.
- End-User Trends: The increasing adoption of carbon nanotubes in electronics, automotive, and aerospace and defense sectors is a crucial market driver.
- M&A Activities: Recent M&A activity, such as the merger of Showa Denko KK and Showa Denko Materials, indicates consolidation within the industry and highlights the strategic importance of carbon nanotube technology. The total value of M&A deals in the carbon nanotube market between 2019 and 2024 was estimated at xx Million.
Carbon Nanotubes Market Industry Trends & Insights
This section explores the prevalent industry trends and insights shaping the carbon nanotubes market. Market growth is primarily driven by the increasing demand from various end-user industries, including electronics, aerospace, and automotive. The growing adoption of lightweight and high-performance materials fuels this demand. Technological advancements in synthesis techniques are reducing production costs and improving the quality of carbon nanotubes, further driving market expansion. Consumer preferences for sustainable and high-performance products are also pushing the adoption of carbon nanotube-based materials. The competitive landscape is dynamic, with both established players and emerging companies actively vying for market share.
The global carbon nanotubes market is expected to witness substantial growth during the forecast period (2025-2033). The increasing demand for lighter and stronger materials in the aerospace industry is expected to drive the market’s growth. Moreover, the increasing use of carbon nanotubes in the automotive industry, especially in electric vehicle batteries, will fuel market growth. The market is further driven by the rising adoption of carbon nanotubes in the electronics and healthcare sectors. However, the high cost of production and potential toxicity concerns can hinder market growth.
Dominant Markets & Segments in Carbon Nanotubes Market
This section delves into the leading regions, countries, and key segments driving the global carbon nanotubes (CNTs) market. We analyze their respective dominance, contributing factors, and the underlying trends shaping their growth. The market is broadly categorized by CNT type and end-user industry.
By Type:
- Multi-walled Carbon Nanotubes (MWCNT): Currently holding a significant market share, MWCNTs are favored due to their comparatively lower production costs and easier scalability. Their widespread adoption across numerous industries, from composites to electronics, solidifies their dominant position. Continuous improvements in synthesis methods are further enhancing their performance and cost-effectiveness.
- Single-walled Carbon Nanotubes (SWCNT): While production costs for SWCNTs remain higher, this segment is experiencing robust growth driven by their exceptional electrical conductivity, mechanical strength, and thermal properties. Ongoing research and development efforts are focused on improving production efficiency and purity, which are anticipated to unlock a wider range of high-value applications in areas like advanced electronics and sensors, propelling its future expansion.
- Other Types: This encompasses a spectrum of specialized carbon nanostructures, including graphene nanoribbons and carbon nanohorns. These tailored materials offer unique properties designed for niche applications, contributing to the overall innovation and diversification of the CNT landscape.
By End-user Industry:
- Electronics: This segment is a primary growth engine, fueled by the insatiable demand for advanced electronic components. CNTs are integral to next-generation semiconductors, flexible displays, touchscreens, conductive inks, and electromagnetic interference (EMI) shielding. The relentless trend towards miniaturization and enhanced performance in consumer electronics and computing directly translates to increased CNT demand.
- Aerospace and Defense: The aerospace sector relies heavily on CNTs for their unparalleled strength-to-weight ratio. Applications include the development of lightweight yet robust composite materials for aircraft structures, reducing fuel consumption and increasing payload capacity. In defense, CNTs are explored for applications in advanced armor, stealth technologies, and durable coatings.
- Automotive: The automotive industry is a rapidly expanding market for CNTs. Their incorporation into automotive components contributes significantly to vehicle lightweighting initiatives, leading to improved fuel efficiency and reduced emissions. Furthermore, CNTs are gaining traction in advanced battery technologies for electric vehicles, enhancing energy density and charging speeds. Stringent global emission regulations are a key catalyst for this demand.
- Healthcare: The biomedical field presents exciting prospects for CNTs. Their unique nanoscale properties are being harnessed for targeted drug delivery systems, advanced medical imaging contrast agents, biosensors for disease detection, and as scaffolds for tissue engineering. Ongoing research is focused on ensuring biocompatibility and safety for widespread clinical adoption.
- Energy: CNTs are crucial in the burgeoning energy sector, particularly in advanced energy storage solutions. Their high surface area and conductivity make them ideal for enhancing the performance of supercapacitors and next-generation batteries. They are also being investigated for applications in solar cells, fuel cells, and thermoelectric devices, aiming to improve energy conversion and storage efficiency.
- Other End-user Industries (Textiles, Plastics and Composites, and Construction): These diverse sectors are progressively integrating CNTs to imbue their products with superior mechanical, electrical, and thermal properties. In textiles, CNTs are used for conductive fabrics and smart wearables. In plastics and composites, they enhance strength and conductivity. In construction, CNTs are being explored for their potential to create stronger, lighter, and more durable building materials.
Carbon Nanotubes Market Product Developments
Recent innovations have focused on improving the production efficiency and functionalization of carbon nanotubes to enhance their performance characteristics and broaden their application scope. This includes advancements in controlled synthesis methods yielding more uniform nanotubes with precise properties, leading to improved material integration and overall product performance. New applications are constantly emerging, expanding the market beyond traditional electronics into areas like energy storage, biomedical devices, and advanced composites. These advancements are crucial in strengthening the competitive advantages of various players in the carbon nanotube market.
Report Scope & Segmentation Analysis
This report segments the carbon nanotubes market by type (MWCNT, SWCNT, Other Types) and end-user industry (Electronics, Aerospace & Defense, Automotive, Healthcare, Energy, Other End-user Industries). Each segment is analyzed based on historical data, current market size, growth projections, and competitive dynamics. For instance, the MWCNT segment is projected to maintain significant growth, driven primarily by cost-effectiveness, while the SWCNT segment is anticipated to exhibit a higher CAGR due to its superior performance characteristics in niche applications. Similarly, end-user industry segments like electronics and automotive demonstrate robust growth potential due to sustained technological advancements and product innovation.
Key Drivers of Carbon Nanotubes Market Growth
Several factors are driving the growth of the carbon nanotubes market. Technological advancements, especially in synthesis methods leading to higher purity and yield, have decreased production costs, making them more commercially viable. The growing demand for lightweight yet high-strength materials in various sectors like aerospace and automotive is another key driver. Moreover, favorable government policies promoting the development and adoption of advanced materials contribute to market growth.
Challenges in the Carbon Nanotubes Market Sector
Despite significant growth potential, the carbon nanotubes market faces challenges. The high initial investment required for production facilities can serve as a barrier to entry for smaller players. Concerns regarding the potential toxicity of carbon nanotubes necessitate stringent safety regulations and handling protocols, adding to production costs. Furthermore, competition from other advanced materials, like graphene, presents a considerable challenge.
Emerging Opportunities in Carbon Nanotubes Market
The carbon nanotubes market is ripe with transformative opportunities, driven by continuous innovation and the exploration of novel applications. The burgeoning field of flexible and wearable electronics presents a significant avenue for growth, where CNTs enable the creation of highly conductive and bendable circuits for smart devices, sensors, and displays. In advanced energy storage, the integration of CNTs into batteries and supercapacitors promises higher energy density, faster charging, and longer lifecycles, critical for the widespread adoption of electric vehicles and renewable energy systems. The biomedical sector continues to be a fertile ground for opportunities, with promising advancements in targeted drug delivery, non-invasive diagnostics, and regenerative medicine leveraging the unique nanoscale properties of CNTs. Furthermore, sophisticated functionalization techniques are allowing for the precise tailoring of CNT properties, opening up an expansive array of applications in areas such as high-performance composites, advanced filtration, and environmental remediation. Strategic collaborations between research institutions, material manufacturers, and end-user industries are paramount in accelerating the translation of these emerging opportunities into commercially viable solutions, driving market expansion and technological breakthroughs.
Leading Players in the Carbon Nanotubes Market Market
- Jiangsu Cnano Technology Co Ltd
- Arkema
- Meijo Nano Carbon
- Raymor Industries Inc
- Cabot Corporation
- Nanocyl SA
- Showa Denko KK (Resonac Holdings Corporation)
- Ocsial
- Hyperion Catalysis International
- LG Chem
- Nano-C
- CHASM
- Chengdu Organic Chemicals Co Ltd (Timesnano)
- Kumho Petrochemical
Key Developments in Carbon Nanotubes Market Industry
- May 2023: LG CHEM announced the construction of its fourth carbon nanotube (CNT) plant in Daesan, South Korea, slated for operation in 2025. This expansion will double LG Chem's annual CNT production capacity to 6,100 tons.
- January 2023: Showa Denko KK and Showa Denko Materials Co. Ltd merged to form Resonac Holdings Corporation and Resonac Corporation, signifying industry consolidation and potential for enhanced production and innovation.
Strategic Outlook for Carbon Nanotubes Market Market
The future of the carbon nanotubes market looks promising. Continued innovation in synthesis and functionalization, coupled with expanding applications across diverse sectors, indicates sustained growth. The focus on sustainable and high-performance materials will further propel market expansion. Strategic partnerships and collaborations between companies are expected to drive innovation and accelerate market penetration, making carbon nanotubes an increasingly vital material in the years to come.
Carbon Nanotubes Market Segmentation
-
1. Type
- 1.1. Multi-walled Carbon Nanotubes (MWCNT)
- 1.2. Single-walled Carbon Nanotubes (SWCNT)
- 1.3. Other Ty
-
2. End-user Industry
- 2.1. Electronics
- 2.2. Aerospace and Defense
- 2.3. Automotive
- 2.4. Healthcare
- 2.5. Energy
- 2.6. Other En
Carbon Nanotubes Market Segmentation By Geography
-
1. Asia Pacific
- 1.1. China
- 1.2. India
- 1.3. Japan
- 1.4. South Korea
- 1.5. Rest of Asia Pacific
-
2. North America
- 2.1. United States
- 2.2. Canada
- 2.3. Mexico
-
3. Europe
- 3.1. Germany
- 3.2. United Kingdom
- 3.3. Italy
- 3.4. France
- 3.5. Spain
- 3.6. Rest of Europe
-
4. South America
- 4.1. Brazil
- 4.2. Argentina
- 4.3. Rest of South America
-
5. Middle East and Africa
- 5.1. Saudi Arabia
- 5.2. South Africa
- 5.3. Rest of Middle East and Africa
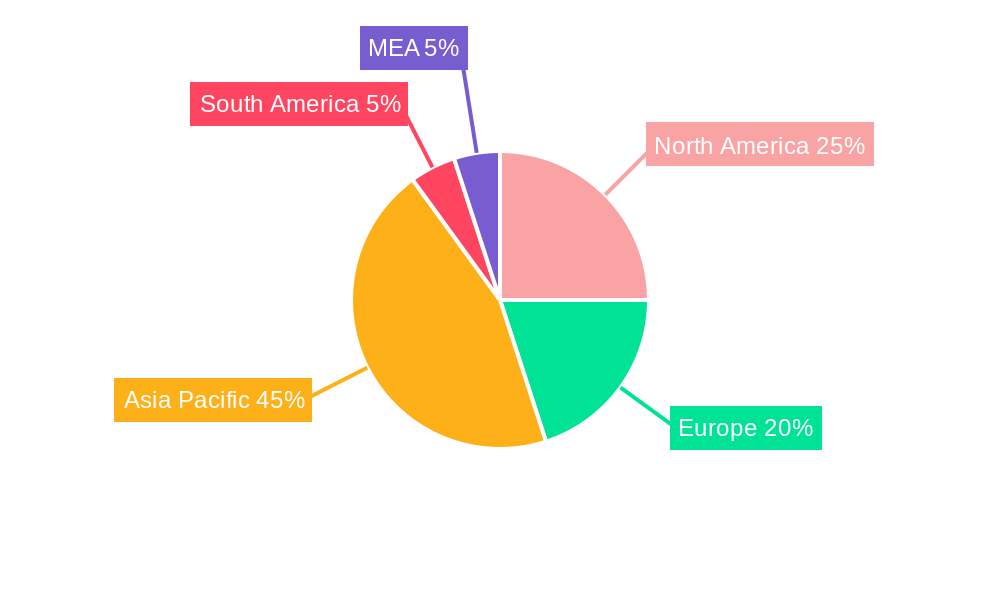
Carbon Nanotubes Market Regional Market Share
Geographic Coverage of Carbon Nanotubes Market
Carbon Nanotubes Market REPORT HIGHLIGHTS
| Aspects | Details |
|---|---|
| Study Period | 2020-2034 |
| Base Year | 2025 |
| Estimated Year | 2026 |
| Forecast Period | 2026-2034 |
| Historical Period | 2020-2025 |
| Growth Rate | CAGR of 34.78% from 2020-2034 |
| Segmentation |
|
Table of Contents
- 1. Introduction
- 1.1. Research Scope
- 1.2. Market Segmentation
- 1.3. Research Objective
- 1.4. Definitions and Assumptions
- 2. Executive Summary
- 2.1. Market Snapshot
- 3. Market Dynamics
- 3.1. Market Drivers
- 3.2. Market Restrains
- 3.3. Market Trends
- 3.4. Market Opportunities
- 4. Market Factor Analysis
- 4.1. Porters Five Forces
- 4.1.1. Bargaining Power of Suppliers
- 4.1.2. Bargaining Power of Buyers
- 4.1.3. Threat of New Entrants
- 4.1.4. Threat of Substitutes
- 4.1.5. Competitive Rivalry
- 4.2. PESTEL analysis
- 4.3. BCG Analysis
- 4.3.1. Stars (High Growth, High Market Share)
- 4.3.2. Cash Cows (Low Growth, High Market Share)
- 4.3.3. Question Mark (High Growth, Low Market Share)
- 4.3.4. Dogs (Low Growth, Low Market Share)
- 4.4. Ansoff Matrix Analysis
- 4.5. Supply Chain Analysis
- 4.6. Regulatory Landscape
- 4.7. Current Market Potential and Opportunity Assessment (TAM–SAM–SOM Framework)
- 4.8. RAX Analyst Note
- 4.1. Porters Five Forces
- 5. Market Analysis, Insights and Forecast 2021-2033
- 5.1. Market Analysis, Insights and Forecast - by Type
- 5.1.1. Multi-walled Carbon Nanotubes (MWCNT)
- 5.1.2. Single-walled Carbon Nanotubes (SWCNT)
- 5.1.3. Other Ty
- 5.2. Market Analysis, Insights and Forecast - by End-user Industry
- 5.2.1. Electronics
- 5.2.2. Aerospace and Defense
- 5.2.3. Automotive
- 5.2.4. Healthcare
- 5.2.5. Energy
- 5.2.6. Other En
- 5.3. Market Analysis, Insights and Forecast - by Region
- 5.3.1. Asia Pacific
- 5.3.2. North America
- 5.3.3. Europe
- 5.3.4. South America
- 5.3.5. Middle East and Africa
- 5.1. Market Analysis, Insights and Forecast - by Type
- 6. Global Carbon Nanotubes Market Analysis, Insights and Forecast, 2021-2033
- 6.1. Market Analysis, Insights and Forecast - by Type
- 6.1.1. Multi-walled Carbon Nanotubes (MWCNT)
- 6.1.2. Single-walled Carbon Nanotubes (SWCNT)
- 6.1.3. Other Ty
- 6.2. Market Analysis, Insights and Forecast - by End-user Industry
- 6.2.1. Electronics
- 6.2.2. Aerospace and Defense
- 6.2.3. Automotive
- 6.2.4. Healthcare
- 6.2.5. Energy
- 6.2.6. Other En
- 6.1. Market Analysis, Insights and Forecast - by Type
- 7. Asia Pacific Carbon Nanotubes Market Analysis, Insights and Forecast, 2020-2032
- 7.1. Market Analysis, Insights and Forecast - by Type
- 7.1.1. Multi-walled Carbon Nanotubes (MWCNT)
- 7.1.2. Single-walled Carbon Nanotubes (SWCNT)
- 7.1.3. Other Ty
- 7.2. Market Analysis, Insights and Forecast - by End-user Industry
- 7.2.1. Electronics
- 7.2.2. Aerospace and Defense
- 7.2.3. Automotive
- 7.2.4. Healthcare
- 7.2.5. Energy
- 7.2.6. Other En
- 7.1. Market Analysis, Insights and Forecast - by Type
- 8. North America Carbon Nanotubes Market Analysis, Insights and Forecast, 2020-2032
- 8.1. Market Analysis, Insights and Forecast - by Type
- 8.1.1. Multi-walled Carbon Nanotubes (MWCNT)
- 8.1.2. Single-walled Carbon Nanotubes (SWCNT)
- 8.1.3. Other Ty
- 8.2. Market Analysis, Insights and Forecast - by End-user Industry
- 8.2.1. Electronics
- 8.2.2. Aerospace and Defense
- 8.2.3. Automotive
- 8.2.4. Healthcare
- 8.2.5. Energy
- 8.2.6. Other En
- 8.1. Market Analysis, Insights and Forecast - by Type
- 9. Europe Carbon Nanotubes Market Analysis, Insights and Forecast, 2020-2032
- 9.1. Market Analysis, Insights and Forecast - by Type
- 9.1.1. Multi-walled Carbon Nanotubes (MWCNT)
- 9.1.2. Single-walled Carbon Nanotubes (SWCNT)
- 9.1.3. Other Ty
- 9.2. Market Analysis, Insights and Forecast - by End-user Industry
- 9.2.1. Electronics
- 9.2.2. Aerospace and Defense
- 9.2.3. Automotive
- 9.2.4. Healthcare
- 9.2.5. Energy
- 9.2.6. Other En
- 9.1. Market Analysis, Insights and Forecast - by Type
- 10. South America Carbon Nanotubes Market Analysis, Insights and Forecast, 2020-2032
- 10.1. Market Analysis, Insights and Forecast - by Type
- 10.1.1. Multi-walled Carbon Nanotubes (MWCNT)
- 10.1.2. Single-walled Carbon Nanotubes (SWCNT)
- 10.1.3. Other Ty
- 10.2. Market Analysis, Insights and Forecast - by End-user Industry
- 10.2.1. Electronics
- 10.2.2. Aerospace and Defense
- 10.2.3. Automotive
- 10.2.4. Healthcare
- 10.2.5. Energy
- 10.2.6. Other En
- 10.1. Market Analysis, Insights and Forecast - by Type
- 11. Middle East and Africa Carbon Nanotubes Market Analysis, Insights and Forecast, 2020-2032
- 11.1. Market Analysis, Insights and Forecast - by Type
- 11.1.1. Multi-walled Carbon Nanotubes (MWCNT)
- 11.1.2. Single-walled Carbon Nanotubes (SWCNT)
- 11.1.3. Other Ty
- 11.2. Market Analysis, Insights and Forecast - by End-user Industry
- 11.2.1. Electronics
- 11.2.2. Aerospace and Defense
- 11.2.3. Automotive
- 11.2.4. Healthcare
- 11.2.5. Energy
- 11.2.6. Other En
- 11.1. Market Analysis, Insights and Forecast - by Type
- 12. Competitive Analysis
- 12.1. Company Profiles
- 12.1.1 Jiangsu Cnano Technology Co Ltd
- 12.1.1.1. Company Overview
- 12.1.1.2. Products
- 12.1.1.3. Company Financials
- 12.1.1.4. SWOT Analysis
- 12.1.2 Arkema
- 12.1.2.1. Company Overview
- 12.1.2.2. Products
- 12.1.2.3. Company Financials
- 12.1.2.4. SWOT Analysis
- 12.1.3 Meijo Nano Carbon
- 12.1.3.1. Company Overview
- 12.1.3.2. Products
- 12.1.3.3. Company Financials
- 12.1.3.4. SWOT Analysis
- 12.1.4 Raymor Industries Inc
- 12.1.4.1. Company Overview
- 12.1.4.2. Products
- 12.1.4.3. Company Financials
- 12.1.4.4. SWOT Analysis
- 12.1.5 Cabot Corporation
- 12.1.5.1. Company Overview
- 12.1.5.2. Products
- 12.1.5.3. Company Financials
- 12.1.5.4. SWOT Analysis
- 12.1.6 Nanocyl SA
- 12.1.6.1. Company Overview
- 12.1.6.2. Products
- 12.1.6.3. Company Financials
- 12.1.6.4. SWOT Analysis
- 12.1.7 Showa Denko KK (Resonac Holdings Corporation)
- 12.1.7.1. Company Overview
- 12.1.7.2. Products
- 12.1.7.3. Company Financials
- 12.1.7.4. SWOT Analysis
- 12.1.8 Ocsial
- 12.1.8.1. Company Overview
- 12.1.8.2. Products
- 12.1.8.3. Company Financials
- 12.1.8.4. SWOT Analysis
- 12.1.9 Hyperion Catalysis International
- 12.1.9.1. Company Overview
- 12.1.9.2. Products
- 12.1.9.3. Company Financials
- 12.1.9.4. SWOT Analysis
- 12.1.10 LG Chem
- 12.1.10.1. Company Overview
- 12.1.10.2. Products
- 12.1.10.3. Company Financials
- 12.1.10.4. SWOT Analysis
- 12.1.11 Nano-C
- 12.1.11.1. Company Overview
- 12.1.11.2. Products
- 12.1.11.3. Company Financials
- 12.1.11.4. SWOT Analysis
- 12.1.12 CHASM
- 12.1.12.1. Company Overview
- 12.1.12.2. Products
- 12.1.12.3. Company Financials
- 12.1.12.4. SWOT Analysis
- 12.1.13 Chengdu Organic Chemicals Co Ltd (Timesnano)
- 12.1.13.1. Company Overview
- 12.1.13.2. Products
- 12.1.13.3. Company Financials
- 12.1.13.4. SWOT Analysis
- 12.1.14 Kumho Petrochemical
- 12.1.14.1. Company Overview
- 12.1.14.2. Products
- 12.1.14.3. Company Financials
- 12.1.14.4. SWOT Analysis
- 12.1.1 Jiangsu Cnano Technology Co Ltd
- 12.2. Market Entropy
- 12.2.1 Company's Key Areas Served
- 12.2.2 Recent Developments
- 12.3. Company Market Share Analysis 2025
- 12.3.1 Top 5 Companies Market Share Analysis
- 12.3.2 Top 3 Companies Market Share Analysis
- 12.4. List of Potential Customers
- 13. Research Methodology
List of Figures
- Figure 1: Global Carbon Nanotubes Market Revenue Breakdown (Million, %) by Region 2025 & 2033
- Figure 2: Global Carbon Nanotubes Market Volume Breakdown (K Tons, %) by Region 2025 & 2033
- Figure 3: Asia Pacific Carbon Nanotubes Market Revenue (Million), by Type 2025 & 2033
- Figure 4: Asia Pacific Carbon Nanotubes Market Volume (K Tons), by Type 2025 & 2033
- Figure 5: Asia Pacific Carbon Nanotubes Market Revenue Share (%), by Type 2025 & 2033
- Figure 6: Asia Pacific Carbon Nanotubes Market Volume Share (%), by Type 2025 & 2033
- Figure 7: Asia Pacific Carbon Nanotubes Market Revenue (Million), by End-user Industry 2025 & 2033
- Figure 8: Asia Pacific Carbon Nanotubes Market Volume (K Tons), by End-user Industry 2025 & 2033
- Figure 9: Asia Pacific Carbon Nanotubes Market Revenue Share (%), by End-user Industry 2025 & 2033
- Figure 10: Asia Pacific Carbon Nanotubes Market Volume Share (%), by End-user Industry 2025 & 2033
- Figure 11: Asia Pacific Carbon Nanotubes Market Revenue (Million), by Country 2025 & 2033
- Figure 12: Asia Pacific Carbon Nanotubes Market Volume (K Tons), by Country 2025 & 2033
- Figure 13: Asia Pacific Carbon Nanotubes Market Revenue Share (%), by Country 2025 & 2033
- Figure 14: Asia Pacific Carbon Nanotubes Market Volume Share (%), by Country 2025 & 2033
- Figure 15: North America Carbon Nanotubes Market Revenue (Million), by Type 2025 & 2033
- Figure 16: North America Carbon Nanotubes Market Volume (K Tons), by Type 2025 & 2033
- Figure 17: North America Carbon Nanotubes Market Revenue Share (%), by Type 2025 & 2033
- Figure 18: North America Carbon Nanotubes Market Volume Share (%), by Type 2025 & 2033
- Figure 19: North America Carbon Nanotubes Market Revenue (Million), by End-user Industry 2025 & 2033
- Figure 20: North America Carbon Nanotubes Market Volume (K Tons), by End-user Industry 2025 & 2033
- Figure 21: North America Carbon Nanotubes Market Revenue Share (%), by End-user Industry 2025 & 2033
- Figure 22: North America Carbon Nanotubes Market Volume Share (%), by End-user Industry 2025 & 2033
- Figure 23: North America Carbon Nanotubes Market Revenue (Million), by Country 2025 & 2033
- Figure 24: North America Carbon Nanotubes Market Volume (K Tons), by Country 2025 & 2033
- Figure 25: North America Carbon Nanotubes Market Revenue Share (%), by Country 2025 & 2033
- Figure 26: North America Carbon Nanotubes Market Volume Share (%), by Country 2025 & 2033
- Figure 27: Europe Carbon Nanotubes Market Revenue (Million), by Type 2025 & 2033
- Figure 28: Europe Carbon Nanotubes Market Volume (K Tons), by Type 2025 & 2033
- Figure 29: Europe Carbon Nanotubes Market Revenue Share (%), by Type 2025 & 2033
- Figure 30: Europe Carbon Nanotubes Market Volume Share (%), by Type 2025 & 2033
- Figure 31: Europe Carbon Nanotubes Market Revenue (Million), by End-user Industry 2025 & 2033
- Figure 32: Europe Carbon Nanotubes Market Volume (K Tons), by End-user Industry 2025 & 2033
- Figure 33: Europe Carbon Nanotubes Market Revenue Share (%), by End-user Industry 2025 & 2033
- Figure 34: Europe Carbon Nanotubes Market Volume Share (%), by End-user Industry 2025 & 2033
- Figure 35: Europe Carbon Nanotubes Market Revenue (Million), by Country 2025 & 2033
- Figure 36: Europe Carbon Nanotubes Market Volume (K Tons), by Country 2025 & 2033
- Figure 37: Europe Carbon Nanotubes Market Revenue Share (%), by Country 2025 & 2033
- Figure 38: Europe Carbon Nanotubes Market Volume Share (%), by Country 2025 & 2033
- Figure 39: South America Carbon Nanotubes Market Revenue (Million), by Type 2025 & 2033
- Figure 40: South America Carbon Nanotubes Market Volume (K Tons), by Type 2025 & 2033
- Figure 41: South America Carbon Nanotubes Market Revenue Share (%), by Type 2025 & 2033
- Figure 42: South America Carbon Nanotubes Market Volume Share (%), by Type 2025 & 2033
- Figure 43: South America Carbon Nanotubes Market Revenue (Million), by End-user Industry 2025 & 2033
- Figure 44: South America Carbon Nanotubes Market Volume (K Tons), by End-user Industry 2025 & 2033
- Figure 45: South America Carbon Nanotubes Market Revenue Share (%), by End-user Industry 2025 & 2033
- Figure 46: South America Carbon Nanotubes Market Volume Share (%), by End-user Industry 2025 & 2033
- Figure 47: South America Carbon Nanotubes Market Revenue (Million), by Country 2025 & 2033
- Figure 48: South America Carbon Nanotubes Market Volume (K Tons), by Country 2025 & 2033
- Figure 49: South America Carbon Nanotubes Market Revenue Share (%), by Country 2025 & 2033
- Figure 50: South America Carbon Nanotubes Market Volume Share (%), by Country 2025 & 2033
- Figure 51: Middle East and Africa Carbon Nanotubes Market Revenue (Million), by Type 2025 & 2033
- Figure 52: Middle East and Africa Carbon Nanotubes Market Volume (K Tons), by Type 2025 & 2033
- Figure 53: Middle East and Africa Carbon Nanotubes Market Revenue Share (%), by Type 2025 & 2033
- Figure 54: Middle East and Africa Carbon Nanotubes Market Volume Share (%), by Type 2025 & 2033
- Figure 55: Middle East and Africa Carbon Nanotubes Market Revenue (Million), by End-user Industry 2025 & 2033
- Figure 56: Middle East and Africa Carbon Nanotubes Market Volume (K Tons), by End-user Industry 2025 & 2033
- Figure 57: Middle East and Africa Carbon Nanotubes Market Revenue Share (%), by End-user Industry 2025 & 2033
- Figure 58: Middle East and Africa Carbon Nanotubes Market Volume Share (%), by End-user Industry 2025 & 2033
- Figure 59: Middle East and Africa Carbon Nanotubes Market Revenue (Million), by Country 2025 & 2033
- Figure 60: Middle East and Africa Carbon Nanotubes Market Volume (K Tons), by Country 2025 & 2033
- Figure 61: Middle East and Africa Carbon Nanotubes Market Revenue Share (%), by Country 2025 & 2033
- Figure 62: Middle East and Africa Carbon Nanotubes Market Volume Share (%), by Country 2025 & 2033
List of Tables
- Table 1: Global Carbon Nanotubes Market Revenue Million Forecast, by Type 2020 & 2033
- Table 2: Global Carbon Nanotubes Market Volume K Tons Forecast, by Type 2020 & 2033
- Table 3: Global Carbon Nanotubes Market Revenue Million Forecast, by End-user Industry 2020 & 2033
- Table 4: Global Carbon Nanotubes Market Volume K Tons Forecast, by End-user Industry 2020 & 2033
- Table 5: Global Carbon Nanotubes Market Revenue Million Forecast, by Region 2020 & 2033
- Table 6: Global Carbon Nanotubes Market Volume K Tons Forecast, by Region 2020 & 2033
- Table 7: Global Carbon Nanotubes Market Revenue Million Forecast, by Type 2020 & 2033
- Table 8: Global Carbon Nanotubes Market Volume K Tons Forecast, by Type 2020 & 2033
- Table 9: Global Carbon Nanotubes Market Revenue Million Forecast, by End-user Industry 2020 & 2033
- Table 10: Global Carbon Nanotubes Market Volume K Tons Forecast, by End-user Industry 2020 & 2033
- Table 11: Global Carbon Nanotubes Market Revenue Million Forecast, by Country 2020 & 2033
- Table 12: Global Carbon Nanotubes Market Volume K Tons Forecast, by Country 2020 & 2033
- Table 13: China Carbon Nanotubes Market Revenue (Million) Forecast, by Application 2020 & 2033
- Table 14: China Carbon Nanotubes Market Volume (K Tons) Forecast, by Application 2020 & 2033
- Table 15: India Carbon Nanotubes Market Revenue (Million) Forecast, by Application 2020 & 2033
- Table 16: India Carbon Nanotubes Market Volume (K Tons) Forecast, by Application 2020 & 2033
- Table 17: Japan Carbon Nanotubes Market Revenue (Million) Forecast, by Application 2020 & 2033
- Table 18: Japan Carbon Nanotubes Market Volume (K Tons) Forecast, by Application 2020 & 2033
- Table 19: South Korea Carbon Nanotubes Market Revenue (Million) Forecast, by Application 2020 & 2033
- Table 20: South Korea Carbon Nanotubes Market Volume (K Tons) Forecast, by Application 2020 & 2033
- Table 21: Rest of Asia Pacific Carbon Nanotubes Market Revenue (Million) Forecast, by Application 2020 & 2033
- Table 22: Rest of Asia Pacific Carbon Nanotubes Market Volume (K Tons) Forecast, by Application 2020 & 2033
- Table 23: Global Carbon Nanotubes Market Revenue Million Forecast, by Type 2020 & 2033
- Table 24: Global Carbon Nanotubes Market Volume K Tons Forecast, by Type 2020 & 2033
- Table 25: Global Carbon Nanotubes Market Revenue Million Forecast, by End-user Industry 2020 & 2033
- Table 26: Global Carbon Nanotubes Market Volume K Tons Forecast, by End-user Industry 2020 & 2033
- Table 27: Global Carbon Nanotubes Market Revenue Million Forecast, by Country 2020 & 2033
- Table 28: Global Carbon Nanotubes Market Volume K Tons Forecast, by Country 2020 & 2033
- Table 29: United States Carbon Nanotubes Market Revenue (Million) Forecast, by Application 2020 & 2033
- Table 30: United States Carbon Nanotubes Market Volume (K Tons) Forecast, by Application 2020 & 2033
- Table 31: Canada Carbon Nanotubes Market Revenue (Million) Forecast, by Application 2020 & 2033
- Table 32: Canada Carbon Nanotubes Market Volume (K Tons) Forecast, by Application 2020 & 2033
- Table 33: Mexico Carbon Nanotubes Market Revenue (Million) Forecast, by Application 2020 & 2033
- Table 34: Mexico Carbon Nanotubes Market Volume (K Tons) Forecast, by Application 2020 & 2033
- Table 35: Global Carbon Nanotubes Market Revenue Million Forecast, by Type 2020 & 2033
- Table 36: Global Carbon Nanotubes Market Volume K Tons Forecast, by Type 2020 & 2033
- Table 37: Global Carbon Nanotubes Market Revenue Million Forecast, by End-user Industry 2020 & 2033
- Table 38: Global Carbon Nanotubes Market Volume K Tons Forecast, by End-user Industry 2020 & 2033
- Table 39: Global Carbon Nanotubes Market Revenue Million Forecast, by Country 2020 & 2033
- Table 40: Global Carbon Nanotubes Market Volume K Tons Forecast, by Country 2020 & 2033
- Table 41: Germany Carbon Nanotubes Market Revenue (Million) Forecast, by Application 2020 & 2033
- Table 42: Germany Carbon Nanotubes Market Volume (K Tons) Forecast, by Application 2020 & 2033
- Table 43: United Kingdom Carbon Nanotubes Market Revenue (Million) Forecast, by Application 2020 & 2033
- Table 44: United Kingdom Carbon Nanotubes Market Volume (K Tons) Forecast, by Application 2020 & 2033
- Table 45: Italy Carbon Nanotubes Market Revenue (Million) Forecast, by Application 2020 & 2033
- Table 46: Italy Carbon Nanotubes Market Volume (K Tons) Forecast, by Application 2020 & 2033
- Table 47: France Carbon Nanotubes Market Revenue (Million) Forecast, by Application 2020 & 2033
- Table 48: France Carbon Nanotubes Market Volume (K Tons) Forecast, by Application 2020 & 2033
- Table 49: Spain Carbon Nanotubes Market Revenue (Million) Forecast, by Application 2020 & 2033
- Table 50: Spain Carbon Nanotubes Market Volume (K Tons) Forecast, by Application 2020 & 2033
- Table 51: Rest of Europe Carbon Nanotubes Market Revenue (Million) Forecast, by Application 2020 & 2033
- Table 52: Rest of Europe Carbon Nanotubes Market Volume (K Tons) Forecast, by Application 2020 & 2033
- Table 53: Global Carbon Nanotubes Market Revenue Million Forecast, by Type 2020 & 2033
- Table 54: Global Carbon Nanotubes Market Volume K Tons Forecast, by Type 2020 & 2033
- Table 55: Global Carbon Nanotubes Market Revenue Million Forecast, by End-user Industry 2020 & 2033
- Table 56: Global Carbon Nanotubes Market Volume K Tons Forecast, by End-user Industry 2020 & 2033
- Table 57: Global Carbon Nanotubes Market Revenue Million Forecast, by Country 2020 & 2033
- Table 58: Global Carbon Nanotubes Market Volume K Tons Forecast, by Country 2020 & 2033
- Table 59: Brazil Carbon Nanotubes Market Revenue (Million) Forecast, by Application 2020 & 2033
- Table 60: Brazil Carbon Nanotubes Market Volume (K Tons) Forecast, by Application 2020 & 2033
- Table 61: Argentina Carbon Nanotubes Market Revenue (Million) Forecast, by Application 2020 & 2033
- Table 62: Argentina Carbon Nanotubes Market Volume (K Tons) Forecast, by Application 2020 & 2033
- Table 63: Rest of South America Carbon Nanotubes Market Revenue (Million) Forecast, by Application 2020 & 2033
- Table 64: Rest of South America Carbon Nanotubes Market Volume (K Tons) Forecast, by Application 2020 & 2033
- Table 65: Global Carbon Nanotubes Market Revenue Million Forecast, by Type 2020 & 2033
- Table 66: Global Carbon Nanotubes Market Volume K Tons Forecast, by Type 2020 & 2033
- Table 67: Global Carbon Nanotubes Market Revenue Million Forecast, by End-user Industry 2020 & 2033
- Table 68: Global Carbon Nanotubes Market Volume K Tons Forecast, by End-user Industry 2020 & 2033
- Table 69: Global Carbon Nanotubes Market Revenue Million Forecast, by Country 2020 & 2033
- Table 70: Global Carbon Nanotubes Market Volume K Tons Forecast, by Country 2020 & 2033
- Table 71: Saudi Arabia Carbon Nanotubes Market Revenue (Million) Forecast, by Application 2020 & 2033
- Table 72: Saudi Arabia Carbon Nanotubes Market Volume (K Tons) Forecast, by Application 2020 & 2033
- Table 73: South Africa Carbon Nanotubes Market Revenue (Million) Forecast, by Application 2020 & 2033
- Table 74: South Africa Carbon Nanotubes Market Volume (K Tons) Forecast, by Application 2020 & 2033
- Table 75: Rest of Middle East and Africa Carbon Nanotubes Market Revenue (Million) Forecast, by Application 2020 & 2033
- Table 76: Rest of Middle East and Africa Carbon Nanotubes Market Volume (K Tons) Forecast, by Application 2020 & 2033
Frequently Asked Questions
1. What is the projected Compound Annual Growth Rate (CAGR) of the Carbon Nanotubes Market?
The projected CAGR is approximately 34.78%.
2. Which companies are prominent players in the Carbon Nanotubes Market?
Key companies in the market include Jiangsu Cnano Technology Co Ltd, Arkema, Meijo Nano Carbon, Raymor Industries Inc, Cabot Corporation, Nanocyl SA, Showa Denko KK (Resonac Holdings Corporation), Ocsial, Hyperion Catalysis International, LG Chem, Nano-C, CHASM, Chengdu Organic Chemicals Co Ltd (Timesnano), Kumho Petrochemical.
3. What are the main segments of the Carbon Nanotubes Market?
The market segments include Type, End-user Industry.
4. Can you provide details about the market size?
The market size is estimated to be USD 6.51 Million as of 2022.
5. What are some drivers contributing to market growth?
Growing Usage of Carbon Nantotubes in Electric Vehicles; Increasing Demand for Advance Materials in Numerous Applications.
6. What are the notable trends driving market growth?
Energy Segment to Dominate the Market.
7. Are there any restraints impacting market growth?
Environmental Concerns and Health Safety Issues; Other Restraints.
8. Can you provide examples of recent developments in the market?
May 2023: LG CHEM announced the construction of its fourth carbon nanotube (CNT) plant at Daesan, South Korea. The plant is slated for operation in 2025. Through the expansion, the company contributes to doubling LG Chem’s annual CNT production capability to 6,100 tons, strengthening its product portfolio.
9. What pricing options are available for accessing the report?
Pricing options include single-user, multi-user, and enterprise licenses priced at USD 4750, USD 5250, and USD 8750 respectively.
10. Is the market size provided in terms of value or volume?
The market size is provided in terms of value, measured in Million and volume, measured in K Tons.
11. Are there any specific market keywords associated with the report?
Yes, the market keyword associated with the report is "Carbon Nanotubes Market," which aids in identifying and referencing the specific market segment covered.
12. How do I determine which pricing option suits my needs best?
The pricing options vary based on user requirements and access needs. Individual users may opt for single-user licenses, while businesses requiring broader access may choose multi-user or enterprise licenses for cost-effective access to the report.
13. Are there any additional resources or data provided in the Carbon Nanotubes Market report?
While the report offers comprehensive insights, it's advisable to review the specific contents or supplementary materials provided to ascertain if additional resources or data are available.
14. How can I stay updated on further developments or reports in the Carbon Nanotubes Market?
To stay informed about further developments, trends, and reports in the Carbon Nanotubes Market, consider subscribing to industry newsletters, following relevant companies and organizations, or regularly checking reputable industry news sources and publications.
Methodology
Step 1 - Identification of Relevant Samples Size from Population Database


Step 2 - Approaches for Defining Global Market Size (Value, Volume* & Price*)

Note*: In applicable scenarios
Step 3 - Data Sources
Primary Research
- Web Analytics
- Survey Reports
- Research Institute
- Latest Research Reports
- Opinion Leaders
Secondary Research
- Annual Reports
- White Paper
- Latest Press Release
- Industry Association
- Paid Database
- Investor Presentations

Step 4 - Data Triangulation
Involves using different sources of information in order to increase the validity of a study
These sources are likely to be stakeholders in a program - participants, other researchers, program staff, other community members, and so on.
Then we put all data in single framework & apply various statistical tools to find out the dynamic on the market.
During the analysis stage, feedback from the stakeholder groups would be compared to determine areas of agreement as well as areas of divergence