

Key Insights
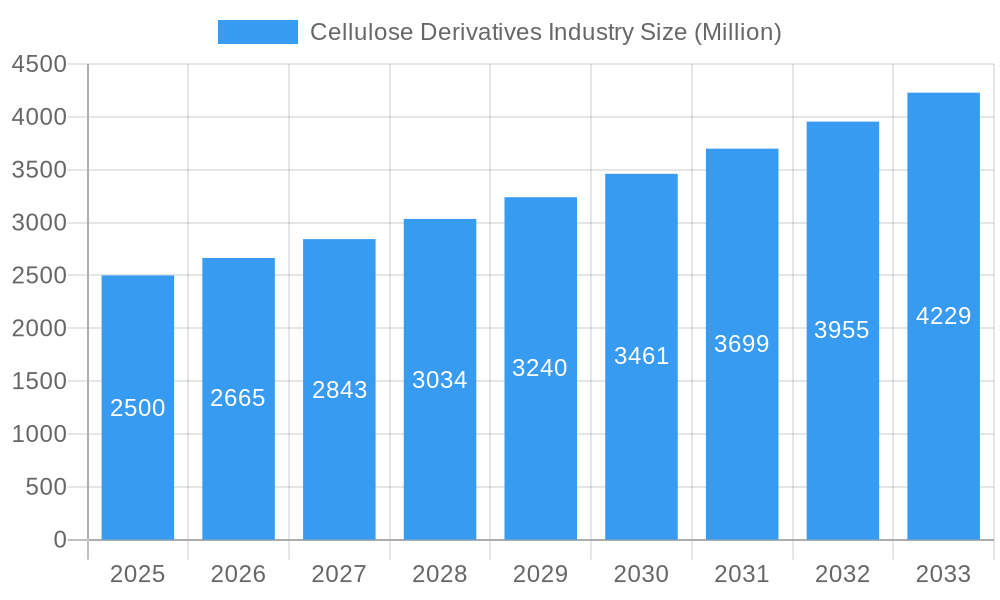
The cellulose derivatives market, projected to reach $6.73 billion by 2025, is forecast for substantial growth with a Compound Annual Growth Rate (CAGR) of 6.6% from 2025 to 2033. This expansion is propelled by escalating demand in key sectors including construction (adhesives, mortars), cosmetics & pharmaceuticals (thickeners, stabilizers), and food & beverage (emulsifiers). Global population growth, urbanization, and infrastructure development are significant drivers. The increasing preference for sustainable and biodegradable materials over synthetic polymers also bolsters adoption. Advancements in production techniques, enhancing performance and cost-effectiveness, further contribute to market expansion. Leading companies are investing in R&D and strategic collaborations to leverage these trends.
Cellulose Derivatives Industry Market Size (In Billion)
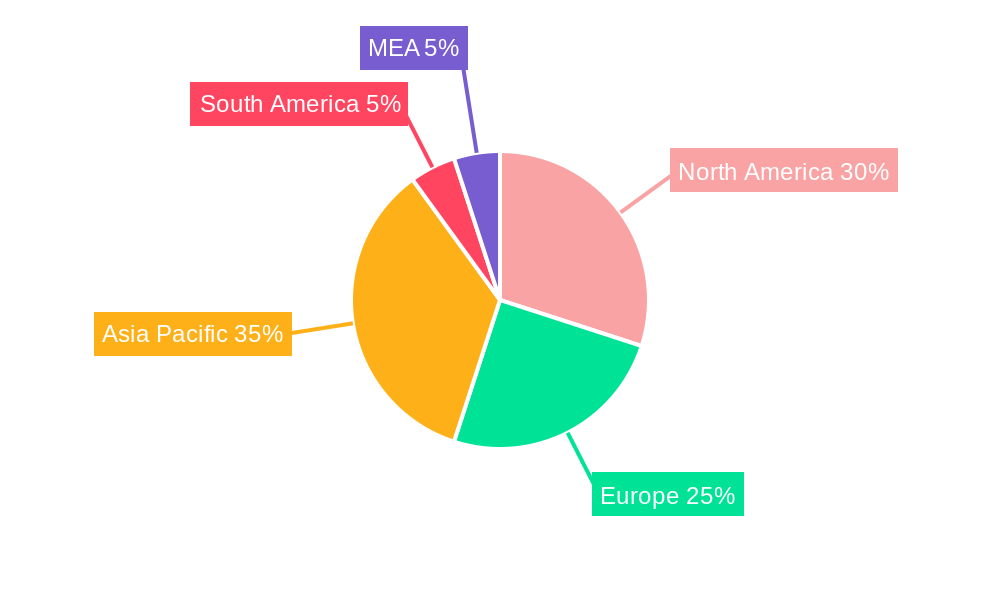
Market growth is subject to certain constraints, including raw material price volatility (wood pulp), regulatory frameworks for specific applications, and competition from synthetic alternatives. Despite these challenges, the long-term outlook is promising, with emerging applications in advanced materials, bioplastics, and specialized coatings anticipated to drive future expansion. North America and Europe exhibit strong market presence due to established industries and consumer spending. However, the Asia-Pacific region is poised for the most significant growth, driven by rapid industrialization and economic expansion in China and India. Segmentation by chemical type (esters, ethers, regenerated cellulose) highlights varied application demands, presenting opportunities for specialized product development and targeted marketing.
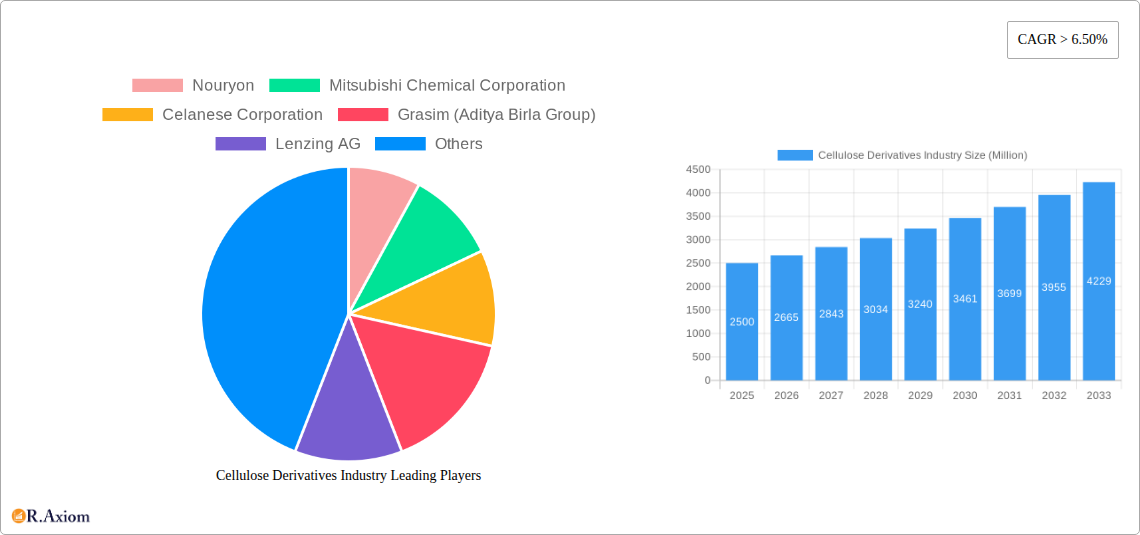
Cellulose Derivatives Industry Company Market Share
Cellulose Derivatives Industry: A Comprehensive Market Report (2019-2033)
This in-depth report provides a comprehensive analysis of the global Cellulose Derivatives industry, covering the period from 2019 to 2033. It offers actionable insights into market dynamics, growth drivers, challenges, and emerging opportunities, empowering stakeholders to make informed strategic decisions. The report utilizes rigorous data analysis, incorporating both historical (2019-2024) and projected (2025-2033) figures, with 2025 serving as the base year. The market is segmented by chemical type (Cellulose Esters, Cellulose Ethers, Regenerated Cellulose) and end-user industry (Construction, Cosmetics & Pharmaceuticals, Food & Beverage, Paints & Coatings, Plastics, Textile, Other End-user Industries). Key players, including Nouryon, Mitsubishi Chemical Corporation, and Celanese Corporation, are profiled, highlighting their market share, strategies, and competitive landscape.
Cellulose Derivatives Industry Market Concentration & Innovation
The global cellulose derivatives market exhibits a moderately concentrated structure, with a handful of multinational corporations holding significant market share. Nouryon, Mitsubishi Chemical Corporation, and Celanese Corporation are among the leading players, collectively accounting for an estimated xx% of the market in 2025. Market concentration is influenced by factors such as economies of scale, technological expertise, and access to raw materials. Innovation is a key driver, with companies investing heavily in R&D to develop new products with enhanced properties and expand into new applications. This includes the development of bio-based cellulose derivatives, sustainable manufacturing processes, and customized solutions for specific end-user needs.
- Market Share (2025 Estimate): Nouryon (xx%), Mitsubishi Chemical Corporation (xx%), Celanese Corporation (xx%), Others (xx%).
- M&A Activity: The industry has witnessed several mergers and acquisitions in recent years, valued at approximately xx Million USD cumulatively, driven by the pursuit of synergies, market expansion, and technological advancements. These deals have further consolidated market power and accelerated innovation.
- Regulatory Landscape: Environmental regulations are increasingly influencing the industry, driving the adoption of sustainable manufacturing practices and the development of biodegradable cellulose derivatives.
- Product Substitutes: Competition from alternative materials, such as synthetic polymers, exists but is limited due to the unique properties and sustainability advantages of cellulose derivatives in specific applications.
- End-User Trends: The growing demand for sustainable and bio-based materials across various end-user industries fuels the industry's expansion.
Cellulose Derivatives Industry Industry Trends & Insights
The global cellulose derivatives market is experiencing robust growth, driven by a combination of factors. The Compound Annual Growth Rate (CAGR) is projected to be xx% during the forecast period (2025-2033). This growth is fueled by increasing demand from diverse end-user sectors such as construction, food & beverage, and cosmetics & pharmaceuticals, alongside the rising adoption of sustainable materials. Technological advancements, such as the development of novel cellulose derivatives with superior properties, contribute significantly. Furthermore, changing consumer preferences toward eco-friendly and bio-based products are bolstering market penetration, particularly in developed economies. However, price volatility of raw materials and fluctuating energy costs represent challenges that may influence overall market expansion. Competitive dynamics are shaped by both established players investing in capacity expansions and new entrants leveraging innovative technologies.
Dominant Markets & Segments in Cellulose Derivatives Industry
The Asia-Pacific region is projected to dominate the global cellulose derivatives market throughout the forecast period, driven by robust economic growth, expanding construction activities, and rising demand from the food and beverage industries in countries like China and India.
Key Drivers:
- Economic Growth: Rapid economic expansion in the Asia-Pacific region is fueling demand across various sectors.
- Infrastructure Development: Significant investments in infrastructure projects, particularly in emerging economies, boost the demand for cellulose derivatives in construction applications.
- Increasing Disposable Incomes: Rising disposable incomes, particularly in developing countries, lead to increased consumption of products utilizing cellulose derivatives.
Dominant Segments:
- Chemical Type: Cellulose ethers are projected to maintain their dominance, driven by their versatile applications in construction, pharmaceuticals, and food processing.
- End-user Industry: The construction industry is expected to continue as the largest consumer of cellulose derivatives, driven by the rising adoption of eco-friendly building materials.
Cellulose Derivatives Industry Product Developments
Recent product developments focus on enhancing performance characteristics, such as improved water solubility, thermal stability, and biodegradability. Innovative applications are emerging in areas like advanced drug delivery systems, sustainable packaging solutions, and high-performance coatings. These advancements provide significant competitive advantages and cater to the growing demand for specialized cellulose derivatives in niche markets.
Report Scope & Segmentation Analysis
The report segments the market based on chemical type (Cellulose Esters, Cellulose Ethers, Regenerated Cellulose) and end-user industry (Construction, Cosmetics & Pharmaceuticals, Food & Beverage, Paints & Coatings, Plastics, Textile, Other End-user Industries). Each segment's growth projections, market sizes, and competitive dynamics are analyzed in detail. The market size for Cellulose Ethers is estimated at xx Million USD in 2025 and is projected to reach xx Million USD by 2033. The construction segment is expected to hold the largest market share, driven by increased infrastructure development and demand for eco-friendly materials. Competition within each segment varies, with some segments exhibiting a more concentrated structure than others.
Key Drivers of Cellulose Derivatives Industry Growth
The industry's growth is propelled by several key factors: rising demand for sustainable and bio-based materials across diverse industries, ongoing technological advancements leading to enhanced product properties, and expanding applications in emerging sectors. Stringent environmental regulations are pushing the adoption of eco-friendly cellulose derivatives, while economic growth in developing economies fuels demand across various applications.
Challenges in the Cellulose Derivatives Industry Sector
The industry faces challenges such as fluctuating raw material prices, increasing energy costs, and intense competition from alternative materials. Regulatory complexities and stringent environmental standards require substantial investments in compliance and sustainable manufacturing practices, impacting profitability. Supply chain disruptions and logistics bottlenecks can further affect market stability. These factors could cumulatively impact the industry's growth by approximately xx% during the forecast period.
Emerging Opportunities in Cellulose Derivatives Industry
Emerging opportunities include the expansion into new applications, such as bioplastics and advanced drug delivery systems, and the development of new product formulations with enhanced properties tailored to specific end-user needs. The growing focus on sustainability and the rising demand for bio-based materials offer significant potential for market expansion, particularly in developing economies with increasing infrastructure development and consumer spending.
Leading Players in the Cellulose Derivatives Industry Market
- Nouryon
- Mitsubishi Chemical Corporation
- Celanese Corporation
- Grasim (Aditya Birla Group)
- Lenzing AG
- Futamura Chemical Co Ltd
- Ashland
- DuPont
- Dow
- Eastman Chemical Company
- Daicel Corporation
- FKuR
- Sappi Limited
- Shin-Etsu Chemical Co Ltd
- Xinjiang Zhongtai Chemical Co Ltd
- Cerdia International GmbH
Key Developments in Cellulose Derivatives Industry Industry
- January 2023: Celanese Corporation launched a new line of bio-based cellulose acetate, expanding its product portfolio in sustainable materials.
- June 2022: Nouryon announced a strategic partnership to develop innovative cellulose ether solutions for the construction industry.
- October 2021: Mitsubishi Chemical Corporation invested xx Million USD in expanding its cellulose ether production capacity in Asia. (Further details of other key developments to be added)
Strategic Outlook for Cellulose Derivatives Industry Market
The future of the cellulose derivatives market appears promising, driven by sustained demand from various end-use sectors, technological advancements, and an increasing emphasis on sustainability. The industry is poised for significant growth, with opportunities for innovation and expansion in emerging markets. Companies adopting strategies focused on sustainability, product diversification, and strategic partnerships will be well-positioned to capitalize on the long-term growth potential of the market.
Cellulose Derivatives Industry Segmentation
-
1. Chemical Type
- 1.1. Cellulose Esters
- 1.2. Cellulose Ethers
- 1.3. Regenerated Cellulose
-
2. End-user Industry
- 2.1. Construction
- 2.2. Cosmetics & Pharmaceuricals
- 2.3. Food & Beverage
- 2.4. Paints & Coatings
- 2.5. Plastics
- 2.6. Textile
- 2.7. Other End-user Industries
Cellulose Derivatives Industry Segmentation By Geography
-
1. Asia Pacific
- 1.1. China
- 1.2. India
- 1.3. Japan
- 1.4. South Korea
- 1.5. Rest of Asia Pacific
-
2. North America
- 2.1. United States
- 2.2. Mexico
- 2.3. Canada
-
3. Europe
- 3.1. Germany
- 3.2. United Kingdom
- 3.3. Italy
- 3.4. France
- 3.5. Rest of Europe
-
4. South America
- 4.1. Brazil
- 4.2. Argentina
- 4.3. Rest of South America
-
5. Middle East & Africa
- 5.1. UAE
- 5.2. Saudi Arabia
- 5.3. South Africa
- 5.4. Rest of Middle East & Africa
Cellulose Derivatives Industry Regional Market Share
Geographic Coverage of Cellulose Derivatives Industry
Cellulose Derivatives Industry REPORT HIGHLIGHTS
| Aspects | Details |
|---|---|
| Study Period | 2020-2034 |
| Base Year | 2025 |
| Estimated Year | 2026 |
| Forecast Period | 2026-2034 |
| Historical Period | 2020-2025 |
| Growth Rate | CAGR of 6.6% from 2020-2034 |
| Segmentation |
|
Table of Contents
- 1. Introduction
- 1.1. Research Scope
- 1.2. Market Segmentation
- 1.3. Research Objective
- 1.4. Definitions and Assumptions
- 2. Executive Summary
- 2.1. Market Snapshot
- 3. Market Dynamics
- 3.1. Market Drivers
- 3.2. Market Restrains
- 3.3. Market Trends
- 3.4. Market Opportunities
- 4. Market Factor Analysis
- 4.1. Porters Five Forces
- 4.1.1. Bargaining Power of Suppliers
- 4.1.2. Bargaining Power of Buyers
- 4.1.3. Threat of New Entrants
- 4.1.4. Threat of Substitutes
- 4.1.5. Competitive Rivalry
- 4.2. PESTEL analysis
- 4.3. BCG Analysis
- 4.3.1. Stars (High Growth, High Market Share)
- 4.3.2. Cash Cows (Low Growth, High Market Share)
- 4.3.3. Question Mark (High Growth, Low Market Share)
- 4.3.4. Dogs (Low Growth, Low Market Share)
- 4.4. Ansoff Matrix Analysis
- 4.5. Supply Chain Analysis
- 4.6. Regulatory Landscape
- 4.7. Current Market Potential and Opportunity Assessment (TAM–SAM–SOM Framework)
- 4.8. RAX Analyst Note
- 4.1. Porters Five Forces
- 5. Market Analysis, Insights and Forecast 2021-2033
- 5.1. Market Analysis, Insights and Forecast - by Chemical Type
- 5.1.1. Cellulose Esters
- 5.1.2. Cellulose Ethers
- 5.1.3. Regenerated Cellulose
- 5.2. Market Analysis, Insights and Forecast - by End-user Industry
- 5.2.1. Construction
- 5.2.2. Cosmetics & Pharmaceuricals
- 5.2.3. Food & Beverage
- 5.2.4. Paints & Coatings
- 5.2.5. Plastics
- 5.2.6. Textile
- 5.2.7. Other End-user Industries
- 5.3. Market Analysis, Insights and Forecast - by Region
- 5.3.1. Asia Pacific
- 5.3.2. North America
- 5.3.3. Europe
- 5.3.4. South America
- 5.3.5. Middle East & Africa
- 5.1. Market Analysis, Insights and Forecast - by Chemical Type
- 6. Global Cellulose Derivatives Industry Analysis, Insights and Forecast, 2021-2033
- 6.1. Market Analysis, Insights and Forecast - by Chemical Type
- 6.1.1. Cellulose Esters
- 6.1.2. Cellulose Ethers
- 6.1.3. Regenerated Cellulose
- 6.2. Market Analysis, Insights and Forecast - by End-user Industry
- 6.2.1. Construction
- 6.2.2. Cosmetics & Pharmaceuricals
- 6.2.3. Food & Beverage
- 6.2.4. Paints & Coatings
- 6.2.5. Plastics
- 6.2.6. Textile
- 6.2.7. Other End-user Industries
- 6.1. Market Analysis, Insights and Forecast - by Chemical Type
- 7. Asia Pacific Cellulose Derivatives Industry Analysis, Insights and Forecast, 2020-2032
- 7.1. Market Analysis, Insights and Forecast - by Chemical Type
- 7.1.1. Cellulose Esters
- 7.1.2. Cellulose Ethers
- 7.1.3. Regenerated Cellulose
- 7.2. Market Analysis, Insights and Forecast - by End-user Industry
- 7.2.1. Construction
- 7.2.2. Cosmetics & Pharmaceuricals
- 7.2.3. Food & Beverage
- 7.2.4. Paints & Coatings
- 7.2.5. Plastics
- 7.2.6. Textile
- 7.2.7. Other End-user Industries
- 7.1. Market Analysis, Insights and Forecast - by Chemical Type
- 8. North America Cellulose Derivatives Industry Analysis, Insights and Forecast, 2020-2032
- 8.1. Market Analysis, Insights and Forecast - by Chemical Type
- 8.1.1. Cellulose Esters
- 8.1.2. Cellulose Ethers
- 8.1.3. Regenerated Cellulose
- 8.2. Market Analysis, Insights and Forecast - by End-user Industry
- 8.2.1. Construction
- 8.2.2. Cosmetics & Pharmaceuricals
- 8.2.3. Food & Beverage
- 8.2.4. Paints & Coatings
- 8.2.5. Plastics
- 8.2.6. Textile
- 8.2.7. Other End-user Industries
- 8.1. Market Analysis, Insights and Forecast - by Chemical Type
- 9. Europe Cellulose Derivatives Industry Analysis, Insights and Forecast, 2020-2032
- 9.1. Market Analysis, Insights and Forecast - by Chemical Type
- 9.1.1. Cellulose Esters
- 9.1.2. Cellulose Ethers
- 9.1.3. Regenerated Cellulose
- 9.2. Market Analysis, Insights and Forecast - by End-user Industry
- 9.2.1. Construction
- 9.2.2. Cosmetics & Pharmaceuricals
- 9.2.3. Food & Beverage
- 9.2.4. Paints & Coatings
- 9.2.5. Plastics
- 9.2.6. Textile
- 9.2.7. Other End-user Industries
- 9.1. Market Analysis, Insights and Forecast - by Chemical Type
- 10. South America Cellulose Derivatives Industry Analysis, Insights and Forecast, 2020-2032
- 10.1. Market Analysis, Insights and Forecast - by Chemical Type
- 10.1.1. Cellulose Esters
- 10.1.2. Cellulose Ethers
- 10.1.3. Regenerated Cellulose
- 10.2. Market Analysis, Insights and Forecast - by End-user Industry
- 10.2.1. Construction
- 10.2.2. Cosmetics & Pharmaceuricals
- 10.2.3. Food & Beverage
- 10.2.4. Paints & Coatings
- 10.2.5. Plastics
- 10.2.6. Textile
- 10.2.7. Other End-user Industries
- 10.1. Market Analysis, Insights and Forecast - by Chemical Type
- 11. Middle East & Africa Cellulose Derivatives Industry Analysis, Insights and Forecast, 2020-2032
- 11.1. Market Analysis, Insights and Forecast - by Chemical Type
- 11.1.1. Cellulose Esters
- 11.1.2. Cellulose Ethers
- 11.1.3. Regenerated Cellulose
- 11.2. Market Analysis, Insights and Forecast - by End-user Industry
- 11.2.1. Construction
- 11.2.2. Cosmetics & Pharmaceuricals
- 11.2.3. Food & Beverage
- 11.2.4. Paints & Coatings
- 11.2.5. Plastics
- 11.2.6. Textile
- 11.2.7. Other End-user Industries
- 11.1. Market Analysis, Insights and Forecast - by Chemical Type
- 12. Competitive Analysis
- 12.1. Company Profiles
- 12.1.1 Nouryon
- 12.1.1.1. Company Overview
- 12.1.1.2. Products
- 12.1.1.3. Company Financials
- 12.1.1.4. SWOT Analysis
- 12.1.2 Mitsubishi Chemical Corporation
- 12.1.2.1. Company Overview
- 12.1.2.2. Products
- 12.1.2.3. Company Financials
- 12.1.2.4. SWOT Analysis
- 12.1.3 Celanese Corporation
- 12.1.3.1. Company Overview
- 12.1.3.2. Products
- 12.1.3.3. Company Financials
- 12.1.3.4. SWOT Analysis
- 12.1.4 Grasim (Aditya Birla Group)
- 12.1.4.1. Company Overview
- 12.1.4.2. Products
- 12.1.4.3. Company Financials
- 12.1.4.4. SWOT Analysis
- 12.1.5 Lenzing AG
- 12.1.5.1. Company Overview
- 12.1.5.2. Products
- 12.1.5.3. Company Financials
- 12.1.5.4. SWOT Analysis
- 12.1.6 Futamura Chemical Co Ltd
- 12.1.6.1. Company Overview
- 12.1.6.2. Products
- 12.1.6.3. Company Financials
- 12.1.6.4. SWOT Analysis
- 12.1.7 Ashland
- 12.1.7.1. Company Overview
- 12.1.7.2. Products
- 12.1.7.3. Company Financials
- 12.1.7.4. SWOT Analysis
- 12.1.8 DuPont
- 12.1.8.1. Company Overview
- 12.1.8.2. Products
- 12.1.8.3. Company Financials
- 12.1.8.4. SWOT Analysis
- 12.1.9 Dow
- 12.1.9.1. Company Overview
- 12.1.9.2. Products
- 12.1.9.3. Company Financials
- 12.1.9.4. SWOT Analysis
- 12.1.10 Eastman Chemical Company
- 12.1.10.1. Company Overview
- 12.1.10.2. Products
- 12.1.10.3. Company Financials
- 12.1.10.4. SWOT Analysis
- 12.1.11 Daicel Corporation
- 12.1.11.1. Company Overview
- 12.1.11.2. Products
- 12.1.11.3. Company Financials
- 12.1.11.4. SWOT Analysis
- 12.1.12 FKuR
- 12.1.12.1. Company Overview
- 12.1.12.2. Products
- 12.1.12.3. Company Financials
- 12.1.12.4. SWOT Analysis
- 12.1.13 Sappi Limited
- 12.1.13.1. Company Overview
- 12.1.13.2. Products
- 12.1.13.3. Company Financials
- 12.1.13.4. SWOT Analysis
- 12.1.14 Shin-Etsu Chemical Co Ltd
- 12.1.14.1. Company Overview
- 12.1.14.2. Products
- 12.1.14.3. Company Financials
- 12.1.14.4. SWOT Analysis
- 12.1.15 Xinjiang Zhongtai Chemical Co Ltd
- 12.1.15.1. Company Overview
- 12.1.15.2. Products
- 12.1.15.3. Company Financials
- 12.1.15.4. SWOT Analysis
- 12.1.16 Cerdia International GmbH
- 12.1.16.1. Company Overview
- 12.1.16.2. Products
- 12.1.16.3. Company Financials
- 12.1.16.4. SWOT Analysis
- 12.1.1 Nouryon
- 12.2. Market Entropy
- 12.2.1 Company's Key Areas Served
- 12.2.2 Recent Developments
- 12.3. Company Market Share Analysis 2025
- 12.3.1 Top 5 Companies Market Share Analysis
- 12.3.2 Top 3 Companies Market Share Analysis
- 12.4. List of Potential Customers
- 13. Research Methodology
List of Figures
- Figure 1: Global Cellulose Derivatives Industry Revenue Breakdown (billion, %) by Region 2025 & 2033
- Figure 2: Global Cellulose Derivatives Industry Volume Breakdown (K Tons, %) by Region 2025 & 2033
- Figure 3: Asia Pacific Cellulose Derivatives Industry Revenue (billion), by Chemical Type 2025 & 2033
- Figure 4: Asia Pacific Cellulose Derivatives Industry Volume (K Tons), by Chemical Type 2025 & 2033
- Figure 5: Asia Pacific Cellulose Derivatives Industry Revenue Share (%), by Chemical Type 2025 & 2033
- Figure 6: Asia Pacific Cellulose Derivatives Industry Volume Share (%), by Chemical Type 2025 & 2033
- Figure 7: Asia Pacific Cellulose Derivatives Industry Revenue (billion), by End-user Industry 2025 & 2033
- Figure 8: Asia Pacific Cellulose Derivatives Industry Volume (K Tons), by End-user Industry 2025 & 2033
- Figure 9: Asia Pacific Cellulose Derivatives Industry Revenue Share (%), by End-user Industry 2025 & 2033
- Figure 10: Asia Pacific Cellulose Derivatives Industry Volume Share (%), by End-user Industry 2025 & 2033
- Figure 11: Asia Pacific Cellulose Derivatives Industry Revenue (billion), by Country 2025 & 2033
- Figure 12: Asia Pacific Cellulose Derivatives Industry Volume (K Tons), by Country 2025 & 2033
- Figure 13: Asia Pacific Cellulose Derivatives Industry Revenue Share (%), by Country 2025 & 2033
- Figure 14: Asia Pacific Cellulose Derivatives Industry Volume Share (%), by Country 2025 & 2033
- Figure 15: North America Cellulose Derivatives Industry Revenue (billion), by Chemical Type 2025 & 2033
- Figure 16: North America Cellulose Derivatives Industry Volume (K Tons), by Chemical Type 2025 & 2033
- Figure 17: North America Cellulose Derivatives Industry Revenue Share (%), by Chemical Type 2025 & 2033
- Figure 18: North America Cellulose Derivatives Industry Volume Share (%), by Chemical Type 2025 & 2033
- Figure 19: North America Cellulose Derivatives Industry Revenue (billion), by End-user Industry 2025 & 2033
- Figure 20: North America Cellulose Derivatives Industry Volume (K Tons), by End-user Industry 2025 & 2033
- Figure 21: North America Cellulose Derivatives Industry Revenue Share (%), by End-user Industry 2025 & 2033
- Figure 22: North America Cellulose Derivatives Industry Volume Share (%), by End-user Industry 2025 & 2033
- Figure 23: North America Cellulose Derivatives Industry Revenue (billion), by Country 2025 & 2033
- Figure 24: North America Cellulose Derivatives Industry Volume (K Tons), by Country 2025 & 2033
- Figure 25: North America Cellulose Derivatives Industry Revenue Share (%), by Country 2025 & 2033
- Figure 26: North America Cellulose Derivatives Industry Volume Share (%), by Country 2025 & 2033
- Figure 27: Europe Cellulose Derivatives Industry Revenue (billion), by Chemical Type 2025 & 2033
- Figure 28: Europe Cellulose Derivatives Industry Volume (K Tons), by Chemical Type 2025 & 2033
- Figure 29: Europe Cellulose Derivatives Industry Revenue Share (%), by Chemical Type 2025 & 2033
- Figure 30: Europe Cellulose Derivatives Industry Volume Share (%), by Chemical Type 2025 & 2033
- Figure 31: Europe Cellulose Derivatives Industry Revenue (billion), by End-user Industry 2025 & 2033
- Figure 32: Europe Cellulose Derivatives Industry Volume (K Tons), by End-user Industry 2025 & 2033
- Figure 33: Europe Cellulose Derivatives Industry Revenue Share (%), by End-user Industry 2025 & 2033
- Figure 34: Europe Cellulose Derivatives Industry Volume Share (%), by End-user Industry 2025 & 2033
- Figure 35: Europe Cellulose Derivatives Industry Revenue (billion), by Country 2025 & 2033
- Figure 36: Europe Cellulose Derivatives Industry Volume (K Tons), by Country 2025 & 2033
- Figure 37: Europe Cellulose Derivatives Industry Revenue Share (%), by Country 2025 & 2033
- Figure 38: Europe Cellulose Derivatives Industry Volume Share (%), by Country 2025 & 2033
- Figure 39: South America Cellulose Derivatives Industry Revenue (billion), by Chemical Type 2025 & 2033
- Figure 40: South America Cellulose Derivatives Industry Volume (K Tons), by Chemical Type 2025 & 2033
- Figure 41: South America Cellulose Derivatives Industry Revenue Share (%), by Chemical Type 2025 & 2033
- Figure 42: South America Cellulose Derivatives Industry Volume Share (%), by Chemical Type 2025 & 2033
- Figure 43: South America Cellulose Derivatives Industry Revenue (billion), by End-user Industry 2025 & 2033
- Figure 44: South America Cellulose Derivatives Industry Volume (K Tons), by End-user Industry 2025 & 2033
- Figure 45: South America Cellulose Derivatives Industry Revenue Share (%), by End-user Industry 2025 & 2033
- Figure 46: South America Cellulose Derivatives Industry Volume Share (%), by End-user Industry 2025 & 2033
- Figure 47: South America Cellulose Derivatives Industry Revenue (billion), by Country 2025 & 2033
- Figure 48: South America Cellulose Derivatives Industry Volume (K Tons), by Country 2025 & 2033
- Figure 49: South America Cellulose Derivatives Industry Revenue Share (%), by Country 2025 & 2033
- Figure 50: South America Cellulose Derivatives Industry Volume Share (%), by Country 2025 & 2033
- Figure 51: Middle East & Africa Cellulose Derivatives Industry Revenue (billion), by Chemical Type 2025 & 2033
- Figure 52: Middle East & Africa Cellulose Derivatives Industry Volume (K Tons), by Chemical Type 2025 & 2033
- Figure 53: Middle East & Africa Cellulose Derivatives Industry Revenue Share (%), by Chemical Type 2025 & 2033
- Figure 54: Middle East & Africa Cellulose Derivatives Industry Volume Share (%), by Chemical Type 2025 & 2033
- Figure 55: Middle East & Africa Cellulose Derivatives Industry Revenue (billion), by End-user Industry 2025 & 2033
- Figure 56: Middle East & Africa Cellulose Derivatives Industry Volume (K Tons), by End-user Industry 2025 & 2033
- Figure 57: Middle East & Africa Cellulose Derivatives Industry Revenue Share (%), by End-user Industry 2025 & 2033
- Figure 58: Middle East & Africa Cellulose Derivatives Industry Volume Share (%), by End-user Industry 2025 & 2033
- Figure 59: Middle East & Africa Cellulose Derivatives Industry Revenue (billion), by Country 2025 & 2033
- Figure 60: Middle East & Africa Cellulose Derivatives Industry Volume (K Tons), by Country 2025 & 2033
- Figure 61: Middle East & Africa Cellulose Derivatives Industry Revenue Share (%), by Country 2025 & 2033
- Figure 62: Middle East & Africa Cellulose Derivatives Industry Volume Share (%), by Country 2025 & 2033
List of Tables
- Table 1: Global Cellulose Derivatives Industry Revenue billion Forecast, by Chemical Type 2020 & 2033
- Table 2: Global Cellulose Derivatives Industry Volume K Tons Forecast, by Chemical Type 2020 & 2033
- Table 3: Global Cellulose Derivatives Industry Revenue billion Forecast, by End-user Industry 2020 & 2033
- Table 4: Global Cellulose Derivatives Industry Volume K Tons Forecast, by End-user Industry 2020 & 2033
- Table 5: Global Cellulose Derivatives Industry Revenue billion Forecast, by Region 2020 & 2033
- Table 6: Global Cellulose Derivatives Industry Volume K Tons Forecast, by Region 2020 & 2033
- Table 7: Global Cellulose Derivatives Industry Revenue billion Forecast, by Chemical Type 2020 & 2033
- Table 8: Global Cellulose Derivatives Industry Volume K Tons Forecast, by Chemical Type 2020 & 2033
- Table 9: Global Cellulose Derivatives Industry Revenue billion Forecast, by End-user Industry 2020 & 2033
- Table 10: Global Cellulose Derivatives Industry Volume K Tons Forecast, by End-user Industry 2020 & 2033
- Table 11: Global Cellulose Derivatives Industry Revenue billion Forecast, by Country 2020 & 2033
- Table 12: Global Cellulose Derivatives Industry Volume K Tons Forecast, by Country 2020 & 2033
- Table 13: China Cellulose Derivatives Industry Revenue (billion) Forecast, by Application 2020 & 2033
- Table 14: China Cellulose Derivatives Industry Volume (K Tons) Forecast, by Application 2020 & 2033
- Table 15: India Cellulose Derivatives Industry Revenue (billion) Forecast, by Application 2020 & 2033
- Table 16: India Cellulose Derivatives Industry Volume (K Tons) Forecast, by Application 2020 & 2033
- Table 17: Japan Cellulose Derivatives Industry Revenue (billion) Forecast, by Application 2020 & 2033
- Table 18: Japan Cellulose Derivatives Industry Volume (K Tons) Forecast, by Application 2020 & 2033
- Table 19: South Korea Cellulose Derivatives Industry Revenue (billion) Forecast, by Application 2020 & 2033
- Table 20: South Korea Cellulose Derivatives Industry Volume (K Tons) Forecast, by Application 2020 & 2033
- Table 21: Rest of Asia Pacific Cellulose Derivatives Industry Revenue (billion) Forecast, by Application 2020 & 2033
- Table 22: Rest of Asia Pacific Cellulose Derivatives Industry Volume (K Tons) Forecast, by Application 2020 & 2033
- Table 23: Global Cellulose Derivatives Industry Revenue billion Forecast, by Chemical Type 2020 & 2033
- Table 24: Global Cellulose Derivatives Industry Volume K Tons Forecast, by Chemical Type 2020 & 2033
- Table 25: Global Cellulose Derivatives Industry Revenue billion Forecast, by End-user Industry 2020 & 2033
- Table 26: Global Cellulose Derivatives Industry Volume K Tons Forecast, by End-user Industry 2020 & 2033
- Table 27: Global Cellulose Derivatives Industry Revenue billion Forecast, by Country 2020 & 2033
- Table 28: Global Cellulose Derivatives Industry Volume K Tons Forecast, by Country 2020 & 2033
- Table 29: United States Cellulose Derivatives Industry Revenue (billion) Forecast, by Application 2020 & 2033
- Table 30: United States Cellulose Derivatives Industry Volume (K Tons) Forecast, by Application 2020 & 2033
- Table 31: Mexico Cellulose Derivatives Industry Revenue (billion) Forecast, by Application 2020 & 2033
- Table 32: Mexico Cellulose Derivatives Industry Volume (K Tons) Forecast, by Application 2020 & 2033
- Table 33: Canada Cellulose Derivatives Industry Revenue (billion) Forecast, by Application 2020 & 2033
- Table 34: Canada Cellulose Derivatives Industry Volume (K Tons) Forecast, by Application 2020 & 2033
- Table 35: Global Cellulose Derivatives Industry Revenue billion Forecast, by Chemical Type 2020 & 2033
- Table 36: Global Cellulose Derivatives Industry Volume K Tons Forecast, by Chemical Type 2020 & 2033
- Table 37: Global Cellulose Derivatives Industry Revenue billion Forecast, by End-user Industry 2020 & 2033
- Table 38: Global Cellulose Derivatives Industry Volume K Tons Forecast, by End-user Industry 2020 & 2033
- Table 39: Global Cellulose Derivatives Industry Revenue billion Forecast, by Country 2020 & 2033
- Table 40: Global Cellulose Derivatives Industry Volume K Tons Forecast, by Country 2020 & 2033
- Table 41: Germany Cellulose Derivatives Industry Revenue (billion) Forecast, by Application 2020 & 2033
- Table 42: Germany Cellulose Derivatives Industry Volume (K Tons) Forecast, by Application 2020 & 2033
- Table 43: United Kingdom Cellulose Derivatives Industry Revenue (billion) Forecast, by Application 2020 & 2033
- Table 44: United Kingdom Cellulose Derivatives Industry Volume (K Tons) Forecast, by Application 2020 & 2033
- Table 45: Italy Cellulose Derivatives Industry Revenue (billion) Forecast, by Application 2020 & 2033
- Table 46: Italy Cellulose Derivatives Industry Volume (K Tons) Forecast, by Application 2020 & 2033
- Table 47: France Cellulose Derivatives Industry Revenue (billion) Forecast, by Application 2020 & 2033
- Table 48: France Cellulose Derivatives Industry Volume (K Tons) Forecast, by Application 2020 & 2033
- Table 49: Rest of Europe Cellulose Derivatives Industry Revenue (billion) Forecast, by Application 2020 & 2033
- Table 50: Rest of Europe Cellulose Derivatives Industry Volume (K Tons) Forecast, by Application 2020 & 2033
- Table 51: Global Cellulose Derivatives Industry Revenue billion Forecast, by Chemical Type 2020 & 2033
- Table 52: Global Cellulose Derivatives Industry Volume K Tons Forecast, by Chemical Type 2020 & 2033
- Table 53: Global Cellulose Derivatives Industry Revenue billion Forecast, by End-user Industry 2020 & 2033
- Table 54: Global Cellulose Derivatives Industry Volume K Tons Forecast, by End-user Industry 2020 & 2033
- Table 55: Global Cellulose Derivatives Industry Revenue billion Forecast, by Country 2020 & 2033
- Table 56: Global Cellulose Derivatives Industry Volume K Tons Forecast, by Country 2020 & 2033
- Table 57: Brazil Cellulose Derivatives Industry Revenue (billion) Forecast, by Application 2020 & 2033
- Table 58: Brazil Cellulose Derivatives Industry Volume (K Tons) Forecast, by Application 2020 & 2033
- Table 59: Argentina Cellulose Derivatives Industry Revenue (billion) Forecast, by Application 2020 & 2033
- Table 60: Argentina Cellulose Derivatives Industry Volume (K Tons) Forecast, by Application 2020 & 2033
- Table 61: Rest of South America Cellulose Derivatives Industry Revenue (billion) Forecast, by Application 2020 & 2033
- Table 62: Rest of South America Cellulose Derivatives Industry Volume (K Tons) Forecast, by Application 2020 & 2033
- Table 63: Global Cellulose Derivatives Industry Revenue billion Forecast, by Chemical Type 2020 & 2033
- Table 64: Global Cellulose Derivatives Industry Volume K Tons Forecast, by Chemical Type 2020 & 2033
- Table 65: Global Cellulose Derivatives Industry Revenue billion Forecast, by End-user Industry 2020 & 2033
- Table 66: Global Cellulose Derivatives Industry Volume K Tons Forecast, by End-user Industry 2020 & 2033
- Table 67: Global Cellulose Derivatives Industry Revenue billion Forecast, by Country 2020 & 2033
- Table 68: Global Cellulose Derivatives Industry Volume K Tons Forecast, by Country 2020 & 2033
- Table 69: UAE Cellulose Derivatives Industry Revenue (billion) Forecast, by Application 2020 & 2033
- Table 70: UAE Cellulose Derivatives Industry Volume (K Tons) Forecast, by Application 2020 & 2033
- Table 71: Saudi Arabia Cellulose Derivatives Industry Revenue (billion) Forecast, by Application 2020 & 2033
- Table 72: Saudi Arabia Cellulose Derivatives Industry Volume (K Tons) Forecast, by Application 2020 & 2033
- Table 73: South Africa Cellulose Derivatives Industry Revenue (billion) Forecast, by Application 2020 & 2033
- Table 74: South Africa Cellulose Derivatives Industry Volume (K Tons) Forecast, by Application 2020 & 2033
- Table 75: Rest of Middle East & Africa Cellulose Derivatives Industry Revenue (billion) Forecast, by Application 2020 & 2033
- Table 76: Rest of Middle East & Africa Cellulose Derivatives Industry Volume (K Tons) Forecast, by Application 2020 & 2033
Frequently Asked Questions
1. What is the projected Compound Annual Growth Rate (CAGR) of the Cellulose Derivatives Industry?
The projected CAGR is approximately 6.6%.
2. Which companies are prominent players in the Cellulose Derivatives Industry?
Key companies in the market include Nouryon, Mitsubishi Chemical Corporation, Celanese Corporation, Grasim (Aditya Birla Group), Lenzing AG, Futamura Chemical Co Ltd, Ashland, DuPont, Dow, Eastman Chemical Company, Daicel Corporation, FKuR, Sappi Limited, Shin-Etsu Chemical Co Ltd, Xinjiang Zhongtai Chemical Co Ltd, Cerdia International GmbH.
3. What are the main segments of the Cellulose Derivatives Industry?
The market segments include Chemical Type, End-user Industry.
4. Can you provide details about the market size?
The market size is estimated to be USD 6.73 billion as of 2022.
5. What are some drivers contributing to market growth?
Increasing Demand from Pharmaceutical Industry; Increasing Use of Cellulose Ether in Building and Construction Industry; Other Drivers.
6. What are the notable trends driving market growth?
Food and Beverage Industry to Dominate the Market.
7. Are there any restraints impacting market growth?
Competition of Regenerated Cellulose Fibers from Synthetic Fibers and Other Protein-based Fibers; Other Restraints.
8. Can you provide examples of recent developments in the market?
N/A
9. What pricing options are available for accessing the report?
Pricing options include single-user, multi-user, and enterprise licenses priced at USD 4750, USD 5250, and USD 8750 respectively.
10. Is the market size provided in terms of value or volume?
The market size is provided in terms of value, measured in billion and volume, measured in K Tons.
11. Are there any specific market keywords associated with the report?
Yes, the market keyword associated with the report is "Cellulose Derivatives Industry," which aids in identifying and referencing the specific market segment covered.
12. How do I determine which pricing option suits my needs best?
The pricing options vary based on user requirements and access needs. Individual users may opt for single-user licenses, while businesses requiring broader access may choose multi-user or enterprise licenses for cost-effective access to the report.
13. Are there any additional resources or data provided in the Cellulose Derivatives Industry report?
While the report offers comprehensive insights, it's advisable to review the specific contents or supplementary materials provided to ascertain if additional resources or data are available.
14. How can I stay updated on further developments or reports in the Cellulose Derivatives Industry?
To stay informed about further developments, trends, and reports in the Cellulose Derivatives Industry, consider subscribing to industry newsletters, following relevant companies and organizations, or regularly checking reputable industry news sources and publications.
Methodology
Step 1 - Identification of Relevant Samples Size from Population Database


Step 2 - Approaches for Defining Global Market Size (Value, Volume* & Price*)

Note*: In applicable scenarios
Step 3 - Data Sources
Primary Research
- Web Analytics
- Survey Reports
- Research Institute
- Latest Research Reports
- Opinion Leaders
Secondary Research
- Annual Reports
- White Paper
- Latest Press Release
- Industry Association
- Paid Database
- Investor Presentations

Step 4 - Data Triangulation
Involves using different sources of information in order to increase the validity of a study
These sources are likely to be stakeholders in a program - participants, other researchers, program staff, other community members, and so on.
Then we put all data in single framework & apply various statistical tools to find out the dynamic on the market.
During the analysis stage, feedback from the stakeholder groups would be compared to determine areas of agreement as well as areas of divergence