

Key Insights
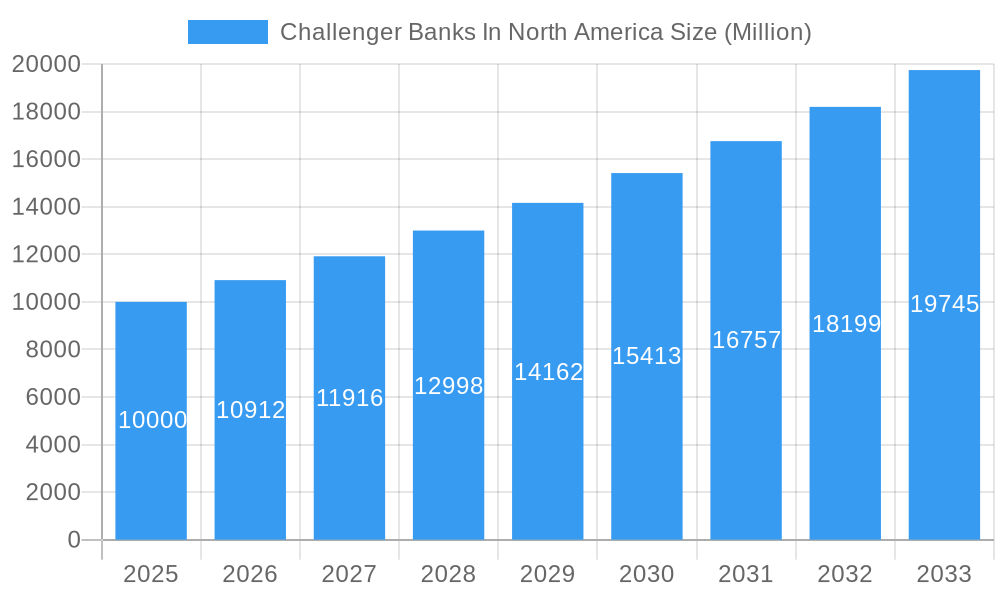
The North American challenger banking market, valued at approximately $10 billion in 2025, is experiencing robust growth, projected to expand at a compound annual growth rate (CAGR) of 9.12% from 2025 to 2033. This surge is fueled by several key drivers. Increased consumer demand for digital-first financial services, coupled with dissatisfaction with traditional banking fees and complexities, is a primary factor. Technological advancements, particularly in mobile banking and AI-powered personalized financial management tools, are further empowering challenger banks to offer innovative and seamless user experiences. Furthermore, the rise of embedded finance, integrating financial services into non-financial platforms, is expanding the reach and accessibility of challenger banks to a broader customer base. The competitive landscape is dynamic, with established players like Chime, Varo, and Aspiration leading the pack alongside newer entrants vying for market share. Strategic partnerships, acquisitions, and continuous product innovation are crucial for maintaining competitiveness in this rapidly evolving sector.
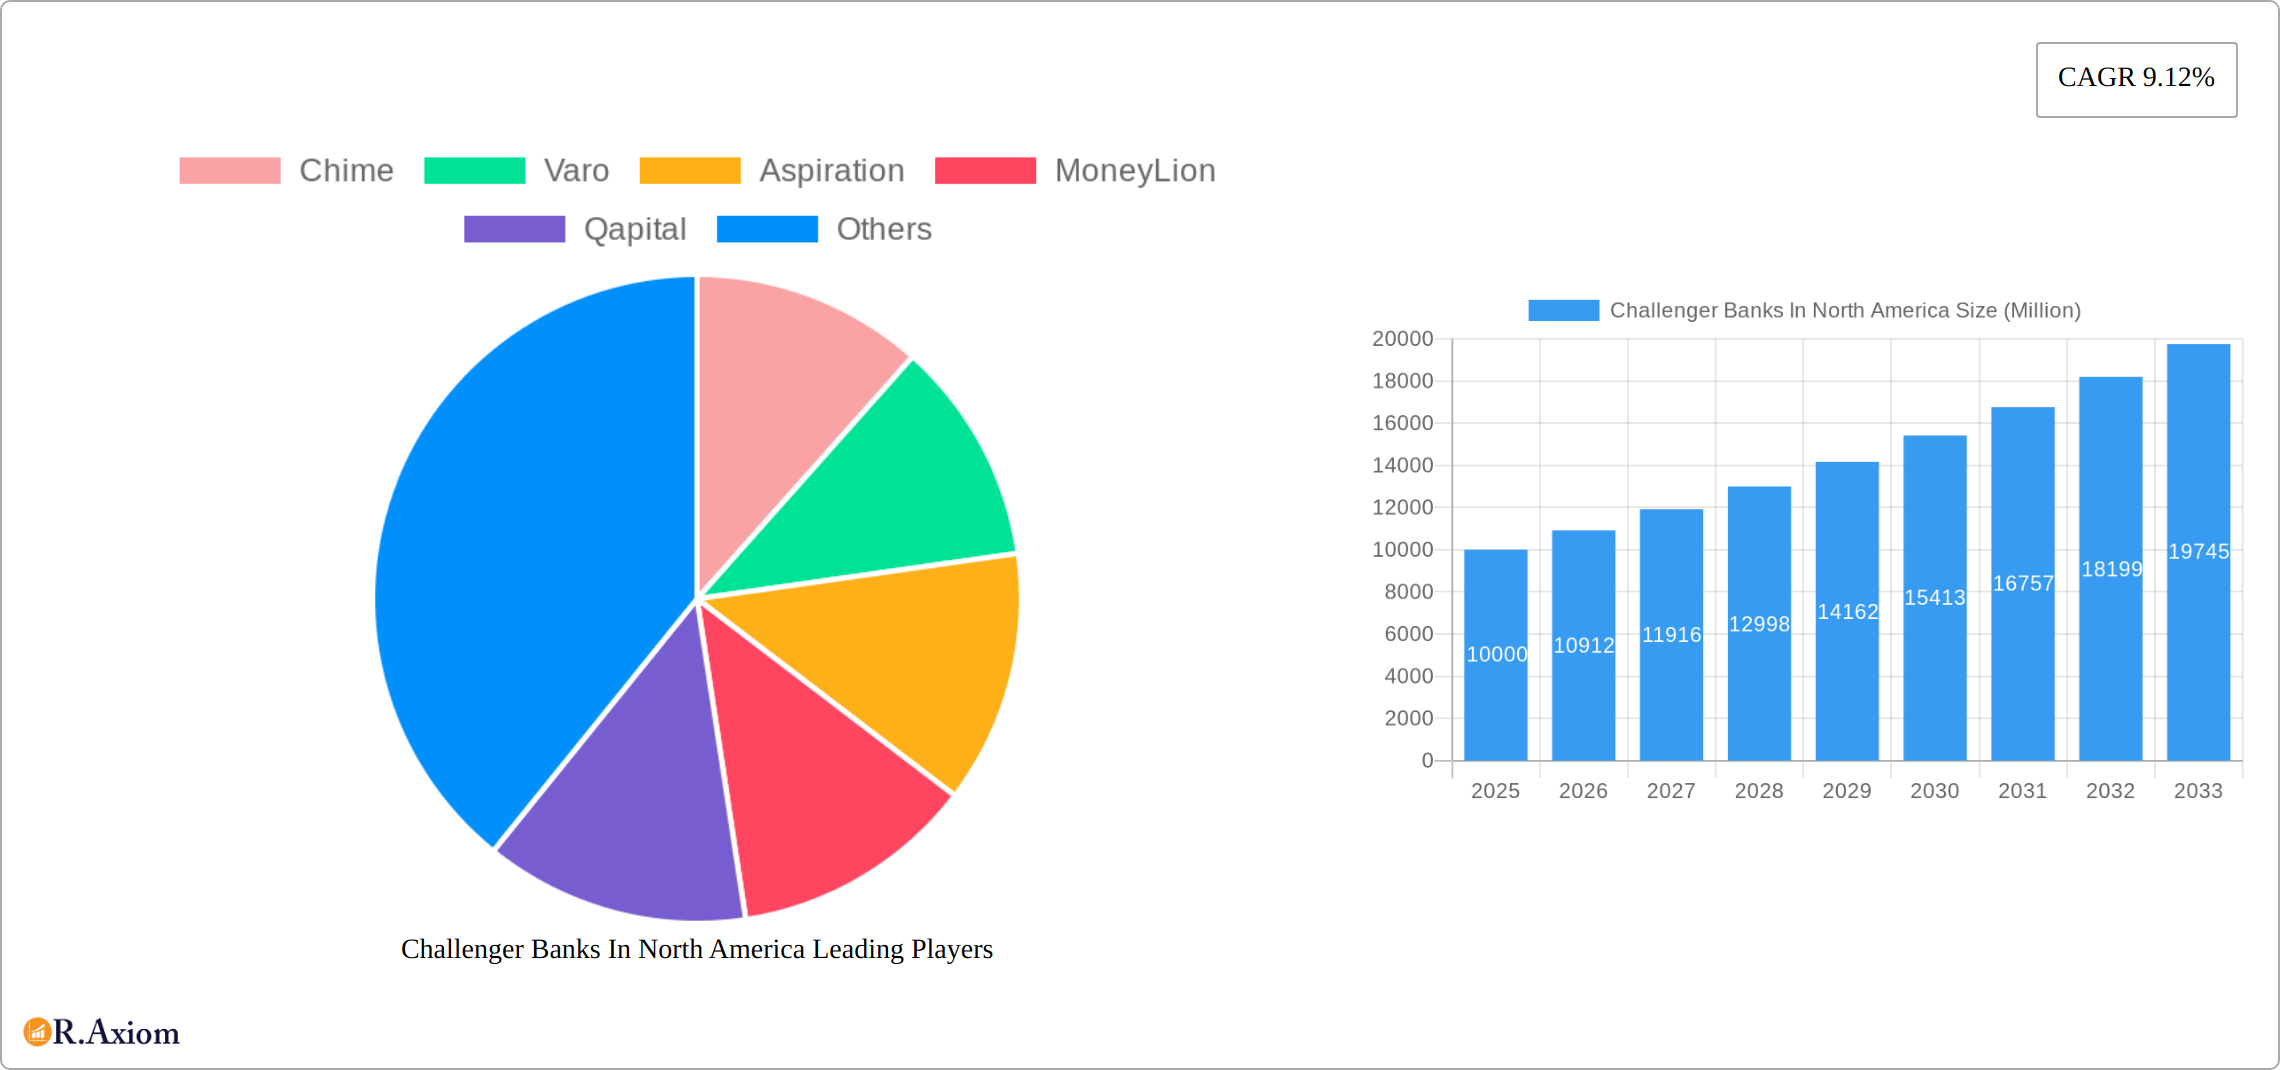
Challenger Banks In North America Market Size (In Billion)
The market's growth trajectory is, however, subject to certain constraints. Regulatory hurdles, including compliance with evolving data privacy regulations and anti-money laundering (AML) standards, pose significant challenges. Security concerns surrounding digital platforms and the potential for cyberattacks also remain a critical consideration for both challenger banks and their customers. While the current market is dominated by digital-first offerings, the successful integration of physical banking infrastructure or strategic collaborations with existing networks will likely play an important role in future market penetration and sustained growth. Maintaining customer trust and loyalty through robust security measures and exceptional customer service is paramount for continued success in this burgeoning market segment.
Challenger Banks In North America Company Market Share
Challenger Banks in North America: A Comprehensive Market Report (2019-2033)
This in-depth report provides a comprehensive analysis of the North American challenger bank market, covering the period from 2019 to 2033. It offers invaluable insights for industry stakeholders, investors, and strategists seeking to understand the dynamics of this rapidly evolving sector. The report leverages extensive market research, incorporating key performance indicators and qualitative assessments to provide a holistic view. With a focus on market concentration, innovation, and future growth potential, this report is an essential resource for navigating the complexities of the North American challenger banking landscape.
Key Focus Areas: Chime, Varo, Aspiration, MoneyLion, Qapital, BankMobile, Upgrade, Dave, Zero, Stash, Deserve, Current (List not exhaustive).
Study Period: 2019–2033; Base Year: 2025; Estimated Year: 2025; Forecast Period: 2025–2033; Historical Period: 2019–2024
Challenger Banks In North America Market Concentration & Innovation
This section analyzes the competitive landscape of the North American challenger banking market, examining market concentration, innovation drivers, regulatory influences, product substitutes, and key M&A activities. The analysis incorporates market share data for prominent players and evaluates the value of significant merger and acquisition deals. The xx% market share held by the top 5 players in 2024 highlights a moderately concentrated market, yet significant opportunities for disruptive innovation remain. Regulatory changes, particularly those concerning data privacy and open banking, are shaping the competitive dynamics, influencing both innovation and consolidation. The increasing adoption of digital-first banking solutions, coupled with the growing preference for personalized financial products, is driving innovation. The entry of FinTech companies with niche product offerings presents a significant competitive threat to traditional players. In 2024, M&A activity totaled approximately USD xx million, indicating a growing trend towards consolidation within the sector.
- Market Concentration: Top 5 players hold xx% market share (2024).
- Innovation Drivers: Digital-first approach, personalized products, open banking.
- M&A Activity (2024): USD xx million.
Challenger Banks In North America Industry Trends & Insights
The North American challenger bank market is experiencing dynamic growth, fueled by a confluence of factors transforming the financial landscape. This section analyzes key trends and insights shaping this evolution, including market growth drivers, technological disruptions, evolving consumer preferences, and the competitive dynamics at play. Recent data indicates a robust Compound Annual Growth Rate (CAGR) of [Insert Updated CAGR]% during the period [Insert Updated Period], significantly exceeding previous projections. This surge is driven by several key factors:
- Increased Smartphone Penetration and Digital Adoption: Widespread smartphone usage and the rising preference for digital banking solutions are fundamental drivers.
- Demand for User-Friendly and Transparent Services: Consumers increasingly seek accessible, transparent, and fee-friendly banking alternatives, creating a fertile ground for challenger banks.
- Technological Innovation: AI-powered chatbots, personalized financial management tools, and seamless mobile interfaces are revolutionizing the customer experience and attracting new users.
- Shifting Demographics: Millennials and Gen Z, known for their tech-savviness and preference for digital-first solutions, represent a key demographic driving growth.
- Open Banking and API Integration: The proliferation of open banking APIs is fostering innovation and collaboration, unlocking new opportunities for product development and partnerships.
The competitive landscape is characterized by both intense competition and strategic collaborations, with established players and FinTech startups vying for market share. Market penetration is projected to reach [Insert Updated Percentage]% by [Insert Updated Year], showcasing the immense potential for future expansion.
Dominant Markets & Segments in Challenger Banks In North America
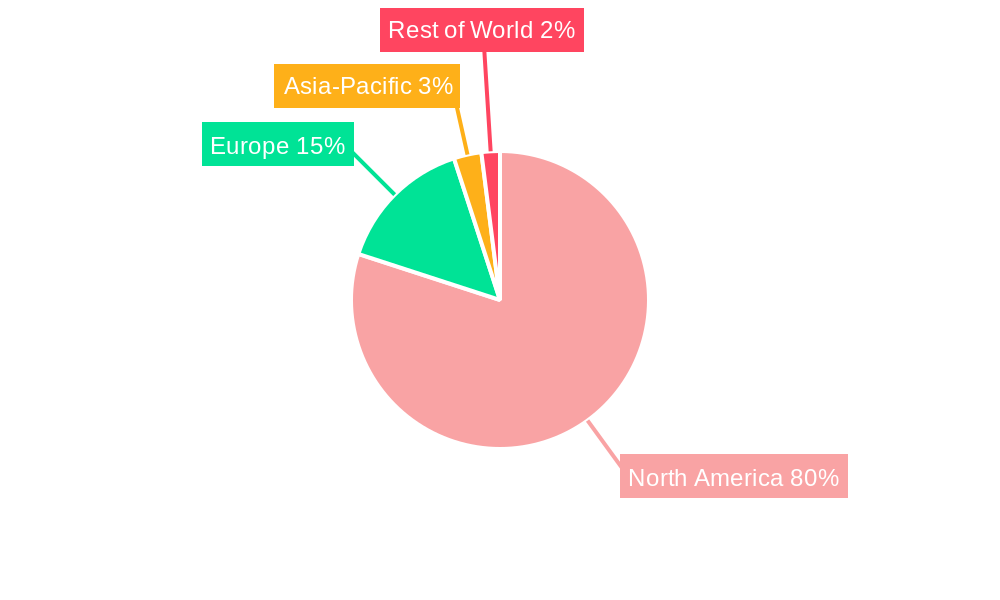
This section identifies the dominant markets and segments within the North American challenger banking landscape. The US remains the largest market, driven by strong economic growth, advanced technological infrastructure, and a receptive consumer base. Specific drivers include favorable regulatory environments that encourage innovation and competition. Key factors contributing to the US dominance include a high level of smartphone penetration and internet accessibility, leading to widespread adoption of digital banking services. Further, a strong emphasis on financial inclusion initiatives promotes wider access to challenger banks.
- Key Drivers (US Market):
- Strong economic growth.
- Advanced technological infrastructure.
- Favorable regulatory environment.
- High smartphone and internet penetration.
- Focus on financial inclusion.
Challenger Banks In North America Product Developments
Challenger banks are rapidly innovating their product offerings, leveraging technology to enhance customer experience and efficiency. This includes personalized financial management tools, AI-powered chatbots for customer service, and seamless integration with other financial platforms. The emphasis is on offering transparent and fee-friendly services, often catering to underserved demographics. The introduction of innovative features such as budgeting tools, automated savings plans, and early wage access aligns with growing consumer demand for streamlined financial management. These innovations are enhancing market fit and creating competitive advantages.
Report Scope & Segmentation Analysis
This report provides a comprehensive segmentation of the North American challenger bank market, offering granular insights into various aspects. Key segmentation factors include:
- Banking Services Offered: Detailed analysis of market performance across checking accounts, savings accounts, credit cards, loans, and other financial products.
- Target Customer Demographics: In-depth examination of market segments based on age (Millennials, Gen Z, Gen X, Baby Boomers), income levels, and other relevant demographic factors.
- Geographical Location: Separate analysis of market trends and dynamics in the US and Canada, considering regional variations in regulatory environments and consumer preferences.
Each segment exhibits unique growth projections and competitive dynamics. For example, the millennial and Gen Z segment continues to demonstrate exceptional growth potential, driven by their inherent comfort with technology and their preference for digital banking solutions. The full report provides detailed market size projections for each segment, accompanied by in-depth competitive analyses.
Key Drivers of Challenger Banks In North America Growth
The remarkable growth of challenger banks in North America is driven by a synergistic interplay of several key factors:
- Technological Advancements: Mobile banking apps, AI-driven personalization, and advanced security features are enhancing customer experience and operational efficiency.
- Favorable Regulatory Environments (in select regions): Progressive regulatory frameworks in certain regions encourage innovation and competition, fostering a dynamic ecosystem.
- Consumer Demand for Accessible and Transparent Services: Consumers are actively seeking banking services characterized by transparency, affordability, and ease of access.
- Seamless Digital Financial Management: The increasing preference for integrated and streamlined digital financial management tools is driving adoption.
- Open Banking and API Integration (expanded): The adoption of open banking APIs is not only fostering innovation but also facilitating the creation of new financial products and services through strategic partnerships.
These factors collectively contribute to a robust and expanding market for challenger banks.
Challenges in the Challenger Banks In North America Sector
Despite the growth potential, challenger banks face significant challenges. Stringent regulatory compliance requirements can impose high costs and limit innovation. Competition from established players with extensive networks and resources poses a threat. Attracting and retaining high-quality talent in a competitive tech landscape is crucial. Maintaining profitability in a low-interest-rate environment presents an ongoing challenge. Furthermore, cybersecurity concerns and managing customer data privacy are critical operational challenges.
Emerging Opportunities in Challenger Banks In North America
The North American challenger banking landscape presents numerous compelling opportunities for growth and expansion:
- Expansion into Underserved Markets: Targeting populations with limited access to traditional banking services presents substantial untapped potential.
- Blockchain Technology Integration: Leveraging blockchain technology can enhance security, transparency, and efficiency in transactions, attracting customers who value these features.
- Embedded Finance Solutions: Integrating financial services into non-financial platforms (e.g., e-commerce sites, ride-sharing apps) offers significant opportunities for growth and reach.
- Strategic Partnerships and Collaboration: Collaborating with other FinTech companies can broaden service offerings, enhance customer value propositions, and attract a wider customer base.
- Hyper-Personalization and AI-Driven Services: Utilizing advanced AI and machine learning to offer highly personalized financial products and services can lead to increased customer loyalty and engagement.
These opportunities, along with others, will shape the future of the North American challenger banking market.
Key Developments in Challenger Banks In North America Industry
- October 2022: Aspiration launched its Aspiration Zero Credit Card, offering cashback and focusing on sustainable practices.
- March 2023: Varo Bank raised USD 50 million at a USD 1.8 billion valuation, a 28% decline from its September 2021 valuation of USD 2.5 billion (after a USD 510 million Series E funding round).
Strategic Outlook for Challenger Banks In North America Market
The future of the North American challenger banking market is exceptionally promising, characterized by sustained growth fueled by technological advancements, evolving consumer preferences, and the ongoing demand for accessible financial services. Success will depend on a strategic approach encompassing:
- Market Expansion: Targeting new geographic markets and customer segments with tailored offerings.
- Strategic Partnerships: Collaborating with FinTechs and other industry players to create comprehensive financial solutions.
- Innovation in Product and Service Offerings: Developing cutting-edge financial products and services that cater to evolving customer needs and preferences.
- Technological Leadership: Embracing and leveraging advancements in AI, blockchain, and open banking to enhance operational efficiency and customer experience.
- Data-Driven Decision Making: Utilizing robust data analytics to inform strategic decisions, personalize offerings, and optimize operational processes.
The market is poised for substantial growth over the forecast period, driven by increasing financial inclusion and the relentless shift towards digital banking. Challenger banks that effectively adapt to these trends and capitalize on emerging opportunities are well-positioned for significant success.
Challenger Banks In North America Segmentation
-
1. Service Type
- 1.1. Loans
- 1.2. Mobile Banking
- 1.3. Checking & Savings Account
- 1.4. Payment & Money Transfer
- 1.5. Others
-
2. End-User Type
- 2.1. Business
- 2.2. Personal
Challenger Banks In North America Segmentation By Geography
-
1. North America
- 1.1. United States
- 1.2. Canada
- 1.3. Mexico
-
2. South America
- 2.1. Brazil
- 2.2. Argentina
- 2.3. Rest of South America
-
3. Europe
- 3.1. United Kingdom
- 3.2. Germany
- 3.3. France
- 3.4. Italy
- 3.5. Spain
- 3.6. Russia
- 3.7. Benelux
- 3.8. Nordics
- 3.9. Rest of Europe
-
4. Middle East & Africa
- 4.1. Turkey
- 4.2. Israel
- 4.3. GCC
- 4.4. North Africa
- 4.5. South Africa
- 4.6. Rest of Middle East & Africa
-
5. Asia Pacific
- 5.1. China
- 5.2. India
- 5.3. Japan
- 5.4. South Korea
- 5.5. ASEAN
- 5.6. Oceania
- 5.7. Rest of Asia Pacific
Challenger Banks In North America Regional Market Share
Geographic Coverage of Challenger Banks In North America
Challenger Banks In North America REPORT HIGHLIGHTS
| Aspects | Details |
|---|---|
| Study Period | 2020-2034 |
| Base Year | 2025 |
| Estimated Year | 2026 |
| Forecast Period | 2026-2034 |
| Historical Period | 2020-2025 |
| Growth Rate | CAGR of 9.12% from 2020-2034 |
| Segmentation |
|
Table of Contents
- 1. Introduction
- 1.1. Research Scope
- 1.2. Market Segmentation
- 1.3. Research Objective
- 1.4. Definitions and Assumptions
- 2. Executive Summary
- 2.1. Market Snapshot
- 3. Market Dynamics
- 3.1. Market Drivers
- 3.2. Market Restrains
- 3.3. Market Trends
- 3.4. Market Opportunities
- 4. Market Factor Analysis
- 4.1. Porters Five Forces
- 4.1.1. Bargaining Power of Suppliers
- 4.1.2. Bargaining Power of Buyers
- 4.1.3. Threat of New Entrants
- 4.1.4. Threat of Substitutes
- 4.1.5. Competitive Rivalry
- 4.2. PESTEL analysis
- 4.3. BCG Analysis
- 4.3.1. Stars (High Growth, High Market Share)
- 4.3.2. Cash Cows (Low Growth, High Market Share)
- 4.3.3. Question Mark (High Growth, Low Market Share)
- 4.3.4. Dogs (Low Growth, Low Market Share)
- 4.4. Ansoff Matrix Analysis
- 4.5. Supply Chain Analysis
- 4.6. Regulatory Landscape
- 4.7. Current Market Potential and Opportunity Assessment (TAM–SAM–SOM Framework)
- 4.8. RAX Analyst Note
- 4.1. Porters Five Forces
- 5. Market Analysis, Insights and Forecast 2021-2033
- 5.1. Market Analysis, Insights and Forecast - by Service Type
- 5.1.1. Loans
- 5.1.2. Mobile Banking
- 5.1.3. Checking & Savings Account
- 5.1.4. Payment & Money Transfer
- 5.1.5. Others
- 5.2. Market Analysis, Insights and Forecast - by End-User Type
- 5.2.1. Business
- 5.2.2. Personal
- 5.3. Market Analysis, Insights and Forecast - by Region
- 5.3.1. North America
- 5.3.2. South America
- 5.3.3. Europe
- 5.3.4. Middle East & Africa
- 5.3.5. Asia Pacific
- 5.1. Market Analysis, Insights and Forecast - by Service Type
- 6. Global Challenger Banks In North America Analysis, Insights and Forecast, 2021-2033
- 6.1. Market Analysis, Insights and Forecast - by Service Type
- 6.1.1. Loans
- 6.1.2. Mobile Banking
- 6.1.3. Checking & Savings Account
- 6.1.4. Payment & Money Transfer
- 6.1.5. Others
- 6.2. Market Analysis, Insights and Forecast - by End-User Type
- 6.2.1. Business
- 6.2.2. Personal
- 6.1. Market Analysis, Insights and Forecast - by Service Type
- 7. North America Challenger Banks In North America Analysis, Insights and Forecast, 2020-2032
- 7.1. Market Analysis, Insights and Forecast - by Service Type
- 7.1.1. Loans
- 7.1.2. Mobile Banking
- 7.1.3. Checking & Savings Account
- 7.1.4. Payment & Money Transfer
- 7.1.5. Others
- 7.2. Market Analysis, Insights and Forecast - by End-User Type
- 7.2.1. Business
- 7.2.2. Personal
- 7.1. Market Analysis, Insights and Forecast - by Service Type
- 8. South America Challenger Banks In North America Analysis, Insights and Forecast, 2020-2032
- 8.1. Market Analysis, Insights and Forecast - by Service Type
- 8.1.1. Loans
- 8.1.2. Mobile Banking
- 8.1.3. Checking & Savings Account
- 8.1.4. Payment & Money Transfer
- 8.1.5. Others
- 8.2. Market Analysis, Insights and Forecast - by End-User Type
- 8.2.1. Business
- 8.2.2. Personal
- 8.1. Market Analysis, Insights and Forecast - by Service Type
- 9. Europe Challenger Banks In North America Analysis, Insights and Forecast, 2020-2032
- 9.1. Market Analysis, Insights and Forecast - by Service Type
- 9.1.1. Loans
- 9.1.2. Mobile Banking
- 9.1.3. Checking & Savings Account
- 9.1.4. Payment & Money Transfer
- 9.1.5. Others
- 9.2. Market Analysis, Insights and Forecast - by End-User Type
- 9.2.1. Business
- 9.2.2. Personal
- 9.1. Market Analysis, Insights and Forecast - by Service Type
- 10. Middle East & Africa Challenger Banks In North America Analysis, Insights and Forecast, 2020-2032
- 10.1. Market Analysis, Insights and Forecast - by Service Type
- 10.1.1. Loans
- 10.1.2. Mobile Banking
- 10.1.3. Checking & Savings Account
- 10.1.4. Payment & Money Transfer
- 10.1.5. Others
- 10.2. Market Analysis, Insights and Forecast - by End-User Type
- 10.2.1. Business
- 10.2.2. Personal
- 10.1. Market Analysis, Insights and Forecast - by Service Type
- 11. Asia Pacific Challenger Banks In North America Analysis, Insights and Forecast, 2020-2032
- 11.1. Market Analysis, Insights and Forecast - by Service Type
- 11.1.1. Loans
- 11.1.2. Mobile Banking
- 11.1.3. Checking & Savings Account
- 11.1.4. Payment & Money Transfer
- 11.1.5. Others
- 11.2. Market Analysis, Insights and Forecast - by End-User Type
- 11.2.1. Business
- 11.2.2. Personal
- 11.1. Market Analysis, Insights and Forecast - by Service Type
- 12. Competitive Analysis
- 12.1. Company Profiles
- 12.1.1 Chime
- 12.1.1.1. Company Overview
- 12.1.1.2. Products
- 12.1.1.3. Company Financials
- 12.1.1.4. SWOT Analysis
- 12.1.2 Varo
- 12.1.2.1. Company Overview
- 12.1.2.2. Products
- 12.1.2.3. Company Financials
- 12.1.2.4. SWOT Analysis
- 12.1.3 Aspiration
- 12.1.3.1. Company Overview
- 12.1.3.2. Products
- 12.1.3.3. Company Financials
- 12.1.3.4. SWOT Analysis
- 12.1.4 MoneyLion
- 12.1.4.1. Company Overview
- 12.1.4.2. Products
- 12.1.4.3. Company Financials
- 12.1.4.4. SWOT Analysis
- 12.1.5 Qapital
- 12.1.5.1. Company Overview
- 12.1.5.2. Products
- 12.1.5.3. Company Financials
- 12.1.5.4. SWOT Analysis
- 12.1.6 BankMobile
- 12.1.6.1. Company Overview
- 12.1.6.2. Products
- 12.1.6.3. Company Financials
- 12.1.6.4. SWOT Analysis
- 12.1.7 Upgrade
- 12.1.7.1. Company Overview
- 12.1.7.2. Products
- 12.1.7.3. Company Financials
- 12.1.7.4. SWOT Analysis
- 12.1.8 Dave
- 12.1.8.1. Company Overview
- 12.1.8.2. Products
- 12.1.8.3. Company Financials
- 12.1.8.4. SWOT Analysis
- 12.1.9 Zero
- 12.1.9.1. Company Overview
- 12.1.9.2. Products
- 12.1.9.3. Company Financials
- 12.1.9.4. SWOT Analysis
- 12.1.10 Stash
- 12.1.10.1. Company Overview
- 12.1.10.2. Products
- 12.1.10.3. Company Financials
- 12.1.10.4. SWOT Analysis
- 12.1.11 Deserve
- 12.1.11.1. Company Overview
- 12.1.11.2. Products
- 12.1.11.3. Company Financials
- 12.1.11.4. SWOT Analysis
- 12.1.12 Current**List Not Exhaustive
- 12.1.12.1. Company Overview
- 12.1.12.2. Products
- 12.1.12.3. Company Financials
- 12.1.12.4. SWOT Analysis
- 12.1.1 Chime
- 12.2. Market Entropy
- 12.2.1 Company's Key Areas Served
- 12.2.2 Recent Developments
- 12.3. Company Market Share Analysis 2025
- 12.3.1 Top 5 Companies Market Share Analysis
- 12.3.2 Top 3 Companies Market Share Analysis
- 12.4. List of Potential Customers
- 13. Research Methodology
List of Figures
- Figure 1: Global Challenger Banks In North America Revenue Breakdown (Million, %) by Region 2025 & 2033
- Figure 2: Global Challenger Banks In North America Volume Breakdown (Billion, %) by Region 2025 & 2033
- Figure 3: North America Challenger Banks In North America Revenue (Million), by Service Type 2025 & 2033
- Figure 4: North America Challenger Banks In North America Volume (Billion), by Service Type 2025 & 2033
- Figure 5: North America Challenger Banks In North America Revenue Share (%), by Service Type 2025 & 2033
- Figure 6: North America Challenger Banks In North America Volume Share (%), by Service Type 2025 & 2033
- Figure 7: North America Challenger Banks In North America Revenue (Million), by End-User Type 2025 & 2033
- Figure 8: North America Challenger Banks In North America Volume (Billion), by End-User Type 2025 & 2033
- Figure 9: North America Challenger Banks In North America Revenue Share (%), by End-User Type 2025 & 2033
- Figure 10: North America Challenger Banks In North America Volume Share (%), by End-User Type 2025 & 2033
- Figure 11: North America Challenger Banks In North America Revenue (Million), by Country 2025 & 2033
- Figure 12: North America Challenger Banks In North America Volume (Billion), by Country 2025 & 2033
- Figure 13: North America Challenger Banks In North America Revenue Share (%), by Country 2025 & 2033
- Figure 14: North America Challenger Banks In North America Volume Share (%), by Country 2025 & 2033
- Figure 15: South America Challenger Banks In North America Revenue (Million), by Service Type 2025 & 2033
- Figure 16: South America Challenger Banks In North America Volume (Billion), by Service Type 2025 & 2033
- Figure 17: South America Challenger Banks In North America Revenue Share (%), by Service Type 2025 & 2033
- Figure 18: South America Challenger Banks In North America Volume Share (%), by Service Type 2025 & 2033
- Figure 19: South America Challenger Banks In North America Revenue (Million), by End-User Type 2025 & 2033
- Figure 20: South America Challenger Banks In North America Volume (Billion), by End-User Type 2025 & 2033
- Figure 21: South America Challenger Banks In North America Revenue Share (%), by End-User Type 2025 & 2033
- Figure 22: South America Challenger Banks In North America Volume Share (%), by End-User Type 2025 & 2033
- Figure 23: South America Challenger Banks In North America Revenue (Million), by Country 2025 & 2033
- Figure 24: South America Challenger Banks In North America Volume (Billion), by Country 2025 & 2033
- Figure 25: South America Challenger Banks In North America Revenue Share (%), by Country 2025 & 2033
- Figure 26: South America Challenger Banks In North America Volume Share (%), by Country 2025 & 2033
- Figure 27: Europe Challenger Banks In North America Revenue (Million), by Service Type 2025 & 2033
- Figure 28: Europe Challenger Banks In North America Volume (Billion), by Service Type 2025 & 2033
- Figure 29: Europe Challenger Banks In North America Revenue Share (%), by Service Type 2025 & 2033
- Figure 30: Europe Challenger Banks In North America Volume Share (%), by Service Type 2025 & 2033
- Figure 31: Europe Challenger Banks In North America Revenue (Million), by End-User Type 2025 & 2033
- Figure 32: Europe Challenger Banks In North America Volume (Billion), by End-User Type 2025 & 2033
- Figure 33: Europe Challenger Banks In North America Revenue Share (%), by End-User Type 2025 & 2033
- Figure 34: Europe Challenger Banks In North America Volume Share (%), by End-User Type 2025 & 2033
- Figure 35: Europe Challenger Banks In North America Revenue (Million), by Country 2025 & 2033
- Figure 36: Europe Challenger Banks In North America Volume (Billion), by Country 2025 & 2033
- Figure 37: Europe Challenger Banks In North America Revenue Share (%), by Country 2025 & 2033
- Figure 38: Europe Challenger Banks In North America Volume Share (%), by Country 2025 & 2033
- Figure 39: Middle East & Africa Challenger Banks In North America Revenue (Million), by Service Type 2025 & 2033
- Figure 40: Middle East & Africa Challenger Banks In North America Volume (Billion), by Service Type 2025 & 2033
- Figure 41: Middle East & Africa Challenger Banks In North America Revenue Share (%), by Service Type 2025 & 2033
- Figure 42: Middle East & Africa Challenger Banks In North America Volume Share (%), by Service Type 2025 & 2033
- Figure 43: Middle East & Africa Challenger Banks In North America Revenue (Million), by End-User Type 2025 & 2033
- Figure 44: Middle East & Africa Challenger Banks In North America Volume (Billion), by End-User Type 2025 & 2033
- Figure 45: Middle East & Africa Challenger Banks In North America Revenue Share (%), by End-User Type 2025 & 2033
- Figure 46: Middle East & Africa Challenger Banks In North America Volume Share (%), by End-User Type 2025 & 2033
- Figure 47: Middle East & Africa Challenger Banks In North America Revenue (Million), by Country 2025 & 2033
- Figure 48: Middle East & Africa Challenger Banks In North America Volume (Billion), by Country 2025 & 2033
- Figure 49: Middle East & Africa Challenger Banks In North America Revenue Share (%), by Country 2025 & 2033
- Figure 50: Middle East & Africa Challenger Banks In North America Volume Share (%), by Country 2025 & 2033
- Figure 51: Asia Pacific Challenger Banks In North America Revenue (Million), by Service Type 2025 & 2033
- Figure 52: Asia Pacific Challenger Banks In North America Volume (Billion), by Service Type 2025 & 2033
- Figure 53: Asia Pacific Challenger Banks In North America Revenue Share (%), by Service Type 2025 & 2033
- Figure 54: Asia Pacific Challenger Banks In North America Volume Share (%), by Service Type 2025 & 2033
- Figure 55: Asia Pacific Challenger Banks In North America Revenue (Million), by End-User Type 2025 & 2033
- Figure 56: Asia Pacific Challenger Banks In North America Volume (Billion), by End-User Type 2025 & 2033
- Figure 57: Asia Pacific Challenger Banks In North America Revenue Share (%), by End-User Type 2025 & 2033
- Figure 58: Asia Pacific Challenger Banks In North America Volume Share (%), by End-User Type 2025 & 2033
- Figure 59: Asia Pacific Challenger Banks In North America Revenue (Million), by Country 2025 & 2033
- Figure 60: Asia Pacific Challenger Banks In North America Volume (Billion), by Country 2025 & 2033
- Figure 61: Asia Pacific Challenger Banks In North America Revenue Share (%), by Country 2025 & 2033
- Figure 62: Asia Pacific Challenger Banks In North America Volume Share (%), by Country 2025 & 2033
List of Tables
- Table 1: Global Challenger Banks In North America Revenue Million Forecast, by Service Type 2020 & 2033
- Table 2: Global Challenger Banks In North America Volume Billion Forecast, by Service Type 2020 & 2033
- Table 3: Global Challenger Banks In North America Revenue Million Forecast, by End-User Type 2020 & 2033
- Table 4: Global Challenger Banks In North America Volume Billion Forecast, by End-User Type 2020 & 2033
- Table 5: Global Challenger Banks In North America Revenue Million Forecast, by Region 2020 & 2033
- Table 6: Global Challenger Banks In North America Volume Billion Forecast, by Region 2020 & 2033
- Table 7: Global Challenger Banks In North America Revenue Million Forecast, by Service Type 2020 & 2033
- Table 8: Global Challenger Banks In North America Volume Billion Forecast, by Service Type 2020 & 2033
- Table 9: Global Challenger Banks In North America Revenue Million Forecast, by End-User Type 2020 & 2033
- Table 10: Global Challenger Banks In North America Volume Billion Forecast, by End-User Type 2020 & 2033
- Table 11: Global Challenger Banks In North America Revenue Million Forecast, by Country 2020 & 2033
- Table 12: Global Challenger Banks In North America Volume Billion Forecast, by Country 2020 & 2033
- Table 13: United States Challenger Banks In North America Revenue (Million) Forecast, by Application 2020 & 2033
- Table 14: United States Challenger Banks In North America Volume (Billion) Forecast, by Application 2020 & 2033
- Table 15: Canada Challenger Banks In North America Revenue (Million) Forecast, by Application 2020 & 2033
- Table 16: Canada Challenger Banks In North America Volume (Billion) Forecast, by Application 2020 & 2033
- Table 17: Mexico Challenger Banks In North America Revenue (Million) Forecast, by Application 2020 & 2033
- Table 18: Mexico Challenger Banks In North America Volume (Billion) Forecast, by Application 2020 & 2033
- Table 19: Global Challenger Banks In North America Revenue Million Forecast, by Service Type 2020 & 2033
- Table 20: Global Challenger Banks In North America Volume Billion Forecast, by Service Type 2020 & 2033
- Table 21: Global Challenger Banks In North America Revenue Million Forecast, by End-User Type 2020 & 2033
- Table 22: Global Challenger Banks In North America Volume Billion Forecast, by End-User Type 2020 & 2033
- Table 23: Global Challenger Banks In North America Revenue Million Forecast, by Country 2020 & 2033
- Table 24: Global Challenger Banks In North America Volume Billion Forecast, by Country 2020 & 2033
- Table 25: Brazil Challenger Banks In North America Revenue (Million) Forecast, by Application 2020 & 2033
- Table 26: Brazil Challenger Banks In North America Volume (Billion) Forecast, by Application 2020 & 2033
- Table 27: Argentina Challenger Banks In North America Revenue (Million) Forecast, by Application 2020 & 2033
- Table 28: Argentina Challenger Banks In North America Volume (Billion) Forecast, by Application 2020 & 2033
- Table 29: Rest of South America Challenger Banks In North America Revenue (Million) Forecast, by Application 2020 & 2033
- Table 30: Rest of South America Challenger Banks In North America Volume (Billion) Forecast, by Application 2020 & 2033
- Table 31: Global Challenger Banks In North America Revenue Million Forecast, by Service Type 2020 & 2033
- Table 32: Global Challenger Banks In North America Volume Billion Forecast, by Service Type 2020 & 2033
- Table 33: Global Challenger Banks In North America Revenue Million Forecast, by End-User Type 2020 & 2033
- Table 34: Global Challenger Banks In North America Volume Billion Forecast, by End-User Type 2020 & 2033
- Table 35: Global Challenger Banks In North America Revenue Million Forecast, by Country 2020 & 2033
- Table 36: Global Challenger Banks In North America Volume Billion Forecast, by Country 2020 & 2033
- Table 37: United Kingdom Challenger Banks In North America Revenue (Million) Forecast, by Application 2020 & 2033
- Table 38: United Kingdom Challenger Banks In North America Volume (Billion) Forecast, by Application 2020 & 2033
- Table 39: Germany Challenger Banks In North America Revenue (Million) Forecast, by Application 2020 & 2033
- Table 40: Germany Challenger Banks In North America Volume (Billion) Forecast, by Application 2020 & 2033
- Table 41: France Challenger Banks In North America Revenue (Million) Forecast, by Application 2020 & 2033
- Table 42: France Challenger Banks In North America Volume (Billion) Forecast, by Application 2020 & 2033
- Table 43: Italy Challenger Banks In North America Revenue (Million) Forecast, by Application 2020 & 2033
- Table 44: Italy Challenger Banks In North America Volume (Billion) Forecast, by Application 2020 & 2033
- Table 45: Spain Challenger Banks In North America Revenue (Million) Forecast, by Application 2020 & 2033
- Table 46: Spain Challenger Banks In North America Volume (Billion) Forecast, by Application 2020 & 2033
- Table 47: Russia Challenger Banks In North America Revenue (Million) Forecast, by Application 2020 & 2033
- Table 48: Russia Challenger Banks In North America Volume (Billion) Forecast, by Application 2020 & 2033
- Table 49: Benelux Challenger Banks In North America Revenue (Million) Forecast, by Application 2020 & 2033
- Table 50: Benelux Challenger Banks In North America Volume (Billion) Forecast, by Application 2020 & 2033
- Table 51: Nordics Challenger Banks In North America Revenue (Million) Forecast, by Application 2020 & 2033
- Table 52: Nordics Challenger Banks In North America Volume (Billion) Forecast, by Application 2020 & 2033
- Table 53: Rest of Europe Challenger Banks In North America Revenue (Million) Forecast, by Application 2020 & 2033
- Table 54: Rest of Europe Challenger Banks In North America Volume (Billion) Forecast, by Application 2020 & 2033
- Table 55: Global Challenger Banks In North America Revenue Million Forecast, by Service Type 2020 & 2033
- Table 56: Global Challenger Banks In North America Volume Billion Forecast, by Service Type 2020 & 2033
- Table 57: Global Challenger Banks In North America Revenue Million Forecast, by End-User Type 2020 & 2033
- Table 58: Global Challenger Banks In North America Volume Billion Forecast, by End-User Type 2020 & 2033
- Table 59: Global Challenger Banks In North America Revenue Million Forecast, by Country 2020 & 2033
- Table 60: Global Challenger Banks In North America Volume Billion Forecast, by Country 2020 & 2033
- Table 61: Turkey Challenger Banks In North America Revenue (Million) Forecast, by Application 2020 & 2033
- Table 62: Turkey Challenger Banks In North America Volume (Billion) Forecast, by Application 2020 & 2033
- Table 63: Israel Challenger Banks In North America Revenue (Million) Forecast, by Application 2020 & 2033
- Table 64: Israel Challenger Banks In North America Volume (Billion) Forecast, by Application 2020 & 2033
- Table 65: GCC Challenger Banks In North America Revenue (Million) Forecast, by Application 2020 & 2033
- Table 66: GCC Challenger Banks In North America Volume (Billion) Forecast, by Application 2020 & 2033
- Table 67: North Africa Challenger Banks In North America Revenue (Million) Forecast, by Application 2020 & 2033
- Table 68: North Africa Challenger Banks In North America Volume (Billion) Forecast, by Application 2020 & 2033
- Table 69: South Africa Challenger Banks In North America Revenue (Million) Forecast, by Application 2020 & 2033
- Table 70: South Africa Challenger Banks In North America Volume (Billion) Forecast, by Application 2020 & 2033
- Table 71: Rest of Middle East & Africa Challenger Banks In North America Revenue (Million) Forecast, by Application 2020 & 2033
- Table 72: Rest of Middle East & Africa Challenger Banks In North America Volume (Billion) Forecast, by Application 2020 & 2033
- Table 73: Global Challenger Banks In North America Revenue Million Forecast, by Service Type 2020 & 2033
- Table 74: Global Challenger Banks In North America Volume Billion Forecast, by Service Type 2020 & 2033
- Table 75: Global Challenger Banks In North America Revenue Million Forecast, by End-User Type 2020 & 2033
- Table 76: Global Challenger Banks In North America Volume Billion Forecast, by End-User Type 2020 & 2033
- Table 77: Global Challenger Banks In North America Revenue Million Forecast, by Country 2020 & 2033
- Table 78: Global Challenger Banks In North America Volume Billion Forecast, by Country 2020 & 2033
- Table 79: China Challenger Banks In North America Revenue (Million) Forecast, by Application 2020 & 2033
- Table 80: China Challenger Banks In North America Volume (Billion) Forecast, by Application 2020 & 2033
- Table 81: India Challenger Banks In North America Revenue (Million) Forecast, by Application 2020 & 2033
- Table 82: India Challenger Banks In North America Volume (Billion) Forecast, by Application 2020 & 2033
- Table 83: Japan Challenger Banks In North America Revenue (Million) Forecast, by Application 2020 & 2033
- Table 84: Japan Challenger Banks In North America Volume (Billion) Forecast, by Application 2020 & 2033
- Table 85: South Korea Challenger Banks In North America Revenue (Million) Forecast, by Application 2020 & 2033
- Table 86: South Korea Challenger Banks In North America Volume (Billion) Forecast, by Application 2020 & 2033
- Table 87: ASEAN Challenger Banks In North America Revenue (Million) Forecast, by Application 2020 & 2033
- Table 88: ASEAN Challenger Banks In North America Volume (Billion) Forecast, by Application 2020 & 2033
- Table 89: Oceania Challenger Banks In North America Revenue (Million) Forecast, by Application 2020 & 2033
- Table 90: Oceania Challenger Banks In North America Volume (Billion) Forecast, by Application 2020 & 2033
- Table 91: Rest of Asia Pacific Challenger Banks In North America Revenue (Million) Forecast, by Application 2020 & 2033
- Table 92: Rest of Asia Pacific Challenger Banks In North America Volume (Billion) Forecast, by Application 2020 & 2033
Frequently Asked Questions
1. What is the projected Compound Annual Growth Rate (CAGR) of the Challenger Banks In North America?
The projected CAGR is approximately 9.12%.
2. Which companies are prominent players in the Challenger Banks In North America?
Key companies in the market include Chime, Varo, Aspiration, MoneyLion, Qapital, BankMobile, Upgrade, Dave, Zero, Stash, Deserve, Current**List Not Exhaustive.
3. What are the main segments of the Challenger Banks In North America?
The market segments include Service Type, End-User Type.
4. Can you provide details about the market size?
The market size is estimated to be USD 10 Million as of 2022.
5. What are some drivers contributing to market growth?
N/A
6. What are the notable trends driving market growth?
Convenience Offered to Consumers Drives The Market.
7. Are there any restraints impacting market growth?
N/A
8. Can you provide examples of recent developments in the market?
March 2023: US challenger Varo Bank is reportedly raising USD 50 million at a USD 1.8 billion valuation, a 28% decline in value since its last fundraising. The firm was valued at USD 2.5 billion in September 2021 after raising USD 510 million in a Series E funding round led by Lone Pine Capital.
9. What pricing options are available for accessing the report?
Pricing options include single-user, multi-user, and enterprise licenses priced at USD 4750, USD 4950, and USD 6800 respectively.
10. Is the market size provided in terms of value or volume?
The market size is provided in terms of value, measured in Million and volume, measured in Billion.
11. Are there any specific market keywords associated with the report?
Yes, the market keyword associated with the report is "Challenger Banks In North America," which aids in identifying and referencing the specific market segment covered.
12. How do I determine which pricing option suits my needs best?
The pricing options vary based on user requirements and access needs. Individual users may opt for single-user licenses, while businesses requiring broader access may choose multi-user or enterprise licenses for cost-effective access to the report.
13. Are there any additional resources or data provided in the Challenger Banks In North America report?
While the report offers comprehensive insights, it's advisable to review the specific contents or supplementary materials provided to ascertain if additional resources or data are available.
14. How can I stay updated on further developments or reports in the Challenger Banks In North America?
To stay informed about further developments, trends, and reports in the Challenger Banks In North America, consider subscribing to industry newsletters, following relevant companies and organizations, or regularly checking reputable industry news sources and publications.
Methodology
Step 1 - Identification of Relevant Samples Size from Population Database


Step 2 - Approaches for Defining Global Market Size (Value, Volume* & Price*)

Note*: In applicable scenarios
Step 3 - Data Sources
Primary Research
- Web Analytics
- Survey Reports
- Research Institute
- Latest Research Reports
- Opinion Leaders
Secondary Research
- Annual Reports
- White Paper
- Latest Press Release
- Industry Association
- Paid Database
- Investor Presentations

Step 4 - Data Triangulation
Involves using different sources of information in order to increase the validity of a study
These sources are likely to be stakeholders in a program - participants, other researchers, program staff, other community members, and so on.
Then we put all data in single framework & apply various statistical tools to find out the dynamic on the market.
During the analysis stage, feedback from the stakeholder groups would be compared to determine areas of agreement as well as areas of divergence