

Key Insights
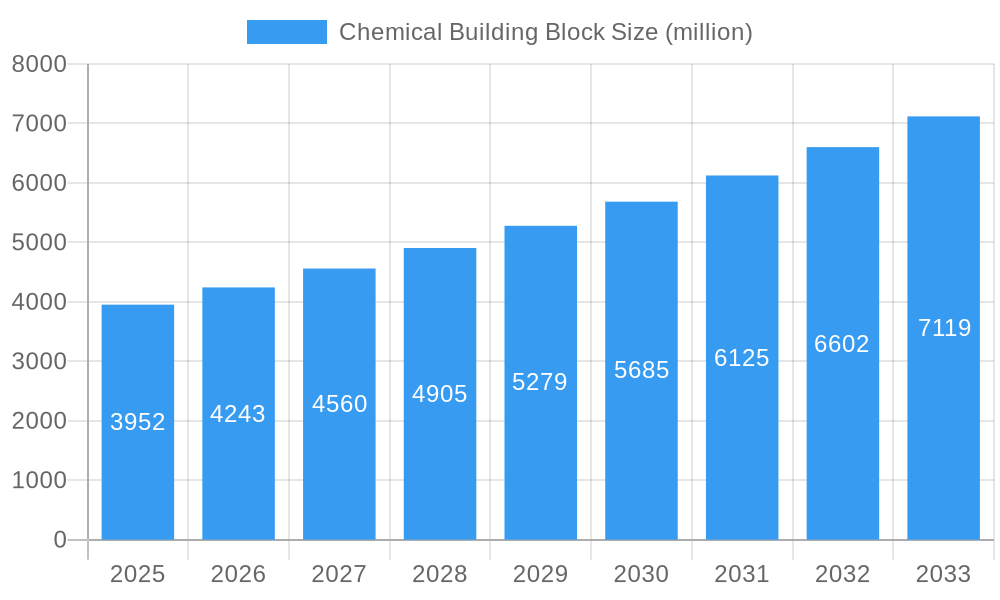
The chemical building block market, currently valued at $3,952 million in 2025, is projected to experience robust growth, driven by the increasing demand from the pharmaceutical and biotechnology industries. The 7.5% CAGR signifies a substantial expansion over the forecast period (2025-2033), fueled by advancements in drug discovery and development, particularly in areas like personalized medicine and targeted therapies. This necessitates a wider range of chemical building blocks with higher purity and specificity, thus driving market growth. The market is segmented based on product type (e.g., heterocyclic, aromatic, aliphatic compounds), application (pharmaceutical synthesis, agrochemical production, materials science), and end-user (pharmaceutical companies, research institutions, contract research organizations). Key players like Merck, Thermo Fisher Scientific, and Enamine dominate the market, leveraging their established research capabilities and extensive product portfolios. Competitive pressures are expected to remain high, stimulating innovation and the development of novel building blocks with improved properties. Growth will also be influenced by factors like stringent regulatory requirements, fluctuating raw material prices, and the ongoing need for sustainable and eco-friendly manufacturing practices within the chemical industry.
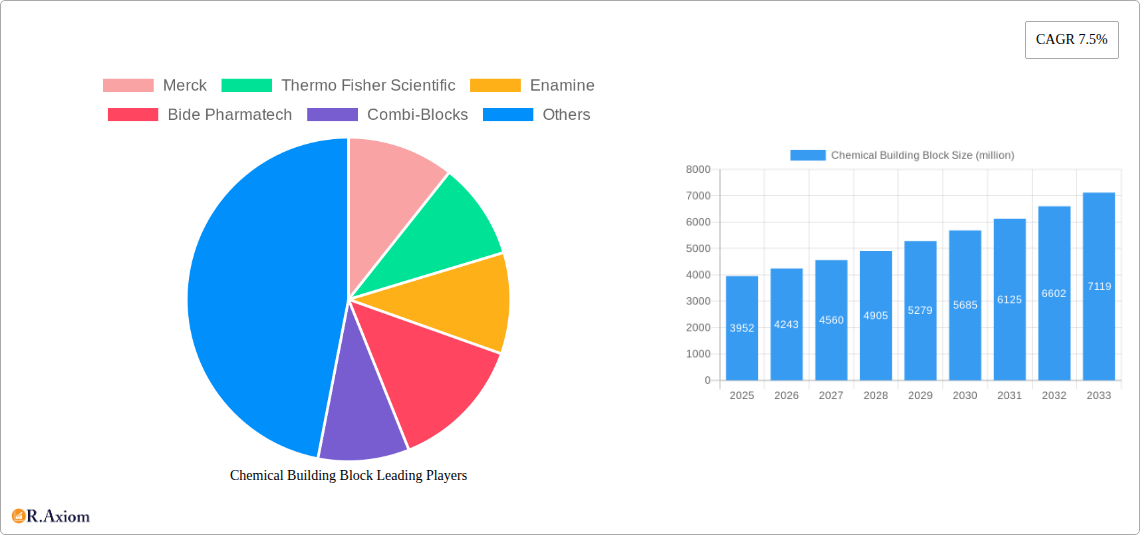
Chemical Building Block Market Size (In Billion)
The competitive landscape is characterized by both large multinational corporations and smaller, specialized chemical suppliers. Larger companies benefit from economies of scale and established distribution networks, while smaller players often excel in providing customized synthesis and niche building blocks. The market is geographically diverse, with significant presence in North America, Europe, and Asia-Pacific. Regional growth will be impacted by factors such as government regulations, research and development investments, and the presence of major pharmaceutical and biotech hubs. Over the forecast period, strategic partnerships, mergers and acquisitions, and continuous product development are anticipated to shape the competitive dynamics and propel the market toward further expansion. The growing focus on process efficiency and cost optimization in chemical synthesis is also expected to impact the adoption rates of various building blocks and influence supplier relationships.
Chemical Building Block Company Market Share
Chemical Building Block Market Report: 2019-2033 – A Comprehensive Analysis
This comprehensive report provides an in-depth analysis of the global Chemical Building Block market, offering valuable insights for industry stakeholders, investors, and researchers. Covering the period 2019-2033, with a focus on 2025, this report meticulously examines market dynamics, trends, and future projections. The report leverages extensive primary and secondary research to provide actionable intelligence, including detailed market sizing, growth forecasts, and competitive landscapes. This report is crucial for understanding the opportunities and challenges within this rapidly evolving market.
Chemical Building Block Market Concentration & Innovation
The global chemical building block market exhibits a moderately consolidated structure, with several key players holding significant market share. Merck, Thermo Fisher Scientific, and Enamine are among the leading companies, collectively accounting for an estimated xx% of the market in 2025. However, the market also includes numerous smaller players, fostering a dynamic competitive environment. Market share fluctuations are influenced by factors like technological advancements, pricing strategies, and M&A activities.
- Market Concentration: The Herfindahl-Hirschman Index (HHI) for the market is estimated at xx in 2025, indicating a moderately concentrated market.
- Innovation Drivers: Continuous research and development efforts focused on developing novel building blocks with enhanced properties (e.g., improved purity, reactivity, and cost-effectiveness) are key drivers.
- Regulatory Landscape: Stringent regulatory frameworks governing chemical manufacturing and handling influence market dynamics. Compliance costs and stringent approval processes can affect market entry and expansion.
- Product Substitutes: The availability of alternative materials and synthetic routes can impact the market. The emergence of bio-based alternatives is a significant factor to consider.
- End-User Trends: Growing demand from the pharmaceutical, agrochemical, and fine chemical industries fuels market growth. Increased focus on developing sustainable and environmentally friendly building blocks also shapes market trends.
- M&A Activity: The market has witnessed significant M&A activity in recent years, with deal values exceeding $xx million in the period 2019-2024. These activities reflect industry consolidation and efforts to expand product portfolios and geographical reach.
Chemical Building Block Industry Trends & Insights
The global chemical building block market is projected to experience substantial growth during the forecast period (2025-2033), driven by several key factors. The market is expected to reach $xx million by 2033, exhibiting a Compound Annual Growth Rate (CAGR) of xx% during the forecast period. This growth is fueled by the rising demand from various downstream industries, particularly the pharmaceutical sector, where the need for specialized building blocks for drug discovery and development is constantly increasing. Technological advancements such as the application of artificial intelligence (AI) and machine learning (ML) in process optimization and discovery are streamlining production, lowering costs, and accelerating time-to-market for new products. Consumer preferences are shifting towards sustainable and eco-friendly building blocks, creating opportunities for manufacturers who can effectively cater to this demand. The competitive landscape is characterized by both established players and emerging companies, resulting in innovative product offerings and price competition that stimulates overall market growth. Market penetration of novel building blocks with enhanced properties (like improved selectivity and efficiency in synthesis) is also anticipated to accelerate during the forecast period.
Dominant Markets & Segments in Chemical Building Block
The Asia-Pacific region is expected to dominate the chemical building block market during the forecast period, driven by factors such as the robust growth of the pharmaceutical and agrochemical industries in countries like China and India.
- Key Drivers in Asia-Pacific:
- Rapid economic growth and increasing industrialization.
- Favorable government policies supporting chemical manufacturing and R&D.
- Growing investment in pharmaceutical and agrochemical research and development.
- Expanding infrastructure and logistics networks.
The dominance of the Asia-Pacific region stems from the significant manufacturing presence and growing demand for building blocks from downstream industries. This region's cost-competitive manufacturing capabilities and favorable regulatory environment have attracted numerous chemical manufacturing companies, further strengthening its position in the global market. North America and Europe are also significant markets, though their growth rate is expected to be slower than the Asia-Pacific region.
Chemical Building Block Product Developments
Recent product developments in the chemical building block market focus on high-value, specialized building blocks with enhanced properties. The trend is toward creating more sustainable and environmentally friendly manufacturing processes. Innovative technologies like flow chemistry and continuous manufacturing are gaining traction, offering advantages such as improved yield, reduced waste, and enhanced process control. These advancements cater to the increasing demand for customized building blocks tailored to specific applications across diverse industries, offering superior efficacy and cost-effectiveness.
Report Scope & Segmentation Analysis
This report segments the chemical building block market based on several key parameters, including product type, application, and region. The product type segmentation includes various categories based on chemical structure and functionality. The application segment encompasses diverse industries such as pharmaceuticals, agrochemicals, and others. Regional segmentation covers major geographic areas, providing a detailed analysis of regional market dynamics. Each segment's growth projection, market size, and competitive landscape are analyzed thoroughly. The report also includes a detailed analysis of each market segment’s current market size, growth forecasts, and competitive landscape.
Key Drivers of Chemical Building Block Growth
The growth of the chemical building block market is propelled by several key factors. Firstly, the booming pharmaceutical industry demands a wide variety of building blocks for drug discovery and development, creating a significant market opportunity. Secondly, advances in technology like high-throughput screening and combinatorial chemistry expedite the development of new drug candidates, stimulating demand for building blocks. Thirdly, favorable government regulations and policies in several regions promote the growth of the chemical industry.
Challenges in the Chemical Building Block Sector
The chemical building block sector faces challenges, including stringent environmental regulations impacting production costs. Fluctuations in raw material prices pose a significant risk to profitability. Supply chain disruptions can lead to production delays and increased costs. Intense competition from established players and new entrants puts pressure on margins and necessitates ongoing innovation. These factors collectively influence market dynamics and profitability.
Emerging Opportunities in Chemical Building Block
The chemical building block market presents several emerging opportunities. The increasing demand for sustainable and bio-based building blocks presents a significant growth avenue. Advances in biotechnology and green chemistry technologies offer innovative solutions for more sustainable manufacturing. The development of novel building blocks with enhanced properties caters to the evolving needs of downstream industries. These opportunities drive innovation and investment in this dynamic sector.
Leading Players in the Chemical Building Block Market
- Merck
- Thermo Fisher Scientific
- Enamine
- Bide Pharmatech
- Combi-Blocks
- Tokyo Chemical Industry
- PharmaBlock Sciences
- Fluorochem
- Haoyuan Chemexpress
- AOBChem
- Aladdin
- AstaTech
- Life Chemicals
- Accela ChemBio
- Apollo Scientific
- BOC Sciences
- ChemBridge
Key Developments in Chemical Building Block Industry
- January 2023: Merck announced a significant expansion of its chemical building block manufacturing facility.
- March 2022: Enamine launched a new line of high-purity building blocks.
- June 2021: Thermo Fisher Scientific acquired a smaller building block supplier, enhancing its market position. (Further specific examples would be included in the complete report)
Strategic Outlook for Chemical Building Block Market
The future of the chemical building block market looks promising, driven by continued growth in the pharmaceutical and agrochemical sectors and ongoing technological innovations. Strategic investments in sustainable manufacturing processes and the development of novel building blocks with enhanced performance characteristics will be crucial for success. The increasing focus on personalized medicine and targeted therapies is also expected to fuel demand for specialized chemical building blocks in the coming years, creating significant opportunities for growth and innovation.
Chemical Building Block Segmentation
-
1. Application
- 1.1. Innovative Drug
- 1.2. Generic Drug
-
2. Type
- 2.1. Heterocyclic Building Block
- 2.2. Benzene Ring Building Block
- 2.3. Aliphatic Building Block
- 2.4. Others
Chemical Building Block Segmentation By Geography
-
1. North America
- 1.1. United States
- 1.2. Canada
- 1.3. Mexico
-
2. South America
- 2.1. Brazil
- 2.2. Argentina
- 2.3. Rest of South America
-
3. Europe
- 3.1. United Kingdom
- 3.2. Germany
- 3.3. France
- 3.4. Italy
- 3.5. Spain
- 3.6. Russia
- 3.7. Benelux
- 3.8. Nordics
- 3.9. Rest of Europe
-
4. Middle East & Africa
- 4.1. Turkey
- 4.2. Israel
- 4.3. GCC
- 4.4. North Africa
- 4.5. South Africa
- 4.6. Rest of Middle East & Africa
-
5. Asia Pacific
- 5.1. China
- 5.2. India
- 5.3. Japan
- 5.4. South Korea
- 5.5. ASEAN
- 5.6. Oceania
- 5.7. Rest of Asia Pacific

Chemical Building Block Regional Market Share
Geographic Coverage of Chemical Building Block
Chemical Building Block REPORT HIGHLIGHTS
| Aspects | Details |
|---|---|
| Study Period | 2020-2034 |
| Base Year | 2025 |
| Estimated Year | 2026 |
| Forecast Period | 2026-2034 |
| Historical Period | 2020-2025 |
| Growth Rate | CAGR of 7.5% from 2020-2034 |
| Segmentation |
|
Table of Contents
- 1. Introduction
- 1.1. Research Scope
- 1.2. Market Segmentation
- 1.3. Research Objective
- 1.4. Definitions and Assumptions
- 2. Executive Summary
- 2.1. Market Snapshot
- 3. Market Dynamics
- 3.1. Market Drivers
- 3.2. Market Restrains
- 3.3. Market Trends
- 3.4. Market Opportunities
- 4. Market Factor Analysis
- 4.1. Porters Five Forces
- 4.1.1. Bargaining Power of Suppliers
- 4.1.2. Bargaining Power of Buyers
- 4.1.3. Threat of New Entrants
- 4.1.4. Threat of Substitutes
- 4.1.5. Competitive Rivalry
- 4.2. PESTEL analysis
- 4.3. BCG Analysis
- 4.3.1. Stars (High Growth, High Market Share)
- 4.3.2. Cash Cows (Low Growth, High Market Share)
- 4.3.3. Question Mark (High Growth, Low Market Share)
- 4.3.4. Dogs (Low Growth, Low Market Share)
- 4.4. Ansoff Matrix Analysis
- 4.5. Supply Chain Analysis
- 4.6. Regulatory Landscape
- 4.7. Current Market Potential and Opportunity Assessment (TAM–SAM–SOM Framework)
- 4.8. RAX Analyst Note
- 4.1. Porters Five Forces
- 5. Market Analysis, Insights and Forecast 2021-2033
- 5.1. Market Analysis, Insights and Forecast - by Application
- 5.1.1. Innovative Drug
- 5.1.2. Generic Drug
- 5.2. Market Analysis, Insights and Forecast - by Type
- 5.2.1. Heterocyclic Building Block
- 5.2.2. Benzene Ring Building Block
- 5.2.3. Aliphatic Building Block
- 5.2.4. Others
- 5.3. Market Analysis, Insights and Forecast - by Region
- 5.3.1. North America
- 5.3.2. South America
- 5.3.3. Europe
- 5.3.4. Middle East & Africa
- 5.3.5. Asia Pacific
- 5.1. Market Analysis, Insights and Forecast - by Application
- 6. Global Chemical Building Block Analysis, Insights and Forecast, 2021-2033
- 6.1. Market Analysis, Insights and Forecast - by Application
- 6.1.1. Innovative Drug
- 6.1.2. Generic Drug
- 6.2. Market Analysis, Insights and Forecast - by Type
- 6.2.1. Heterocyclic Building Block
- 6.2.2. Benzene Ring Building Block
- 6.2.3. Aliphatic Building Block
- 6.2.4. Others
- 6.1. Market Analysis, Insights and Forecast - by Application
- 7. North America Chemical Building Block Analysis, Insights and Forecast, 2020-2032
- 7.1. Market Analysis, Insights and Forecast - by Application
- 7.1.1. Innovative Drug
- 7.1.2. Generic Drug
- 7.2. Market Analysis, Insights and Forecast - by Type
- 7.2.1. Heterocyclic Building Block
- 7.2.2. Benzene Ring Building Block
- 7.2.3. Aliphatic Building Block
- 7.2.4. Others
- 7.1. Market Analysis, Insights and Forecast - by Application
- 8. South America Chemical Building Block Analysis, Insights and Forecast, 2020-2032
- 8.1. Market Analysis, Insights and Forecast - by Application
- 8.1.1. Innovative Drug
- 8.1.2. Generic Drug
- 8.2. Market Analysis, Insights and Forecast - by Type
- 8.2.1. Heterocyclic Building Block
- 8.2.2. Benzene Ring Building Block
- 8.2.3. Aliphatic Building Block
- 8.2.4. Others
- 8.1. Market Analysis, Insights and Forecast - by Application
- 9. Europe Chemical Building Block Analysis, Insights and Forecast, 2020-2032
- 9.1. Market Analysis, Insights and Forecast - by Application
- 9.1.1. Innovative Drug
- 9.1.2. Generic Drug
- 9.2. Market Analysis, Insights and Forecast - by Type
- 9.2.1. Heterocyclic Building Block
- 9.2.2. Benzene Ring Building Block
- 9.2.3. Aliphatic Building Block
- 9.2.4. Others
- 9.1. Market Analysis, Insights and Forecast - by Application
- 10. Middle East & Africa Chemical Building Block Analysis, Insights and Forecast, 2020-2032
- 10.1. Market Analysis, Insights and Forecast - by Application
- 10.1.1. Innovative Drug
- 10.1.2. Generic Drug
- 10.2. Market Analysis, Insights and Forecast - by Type
- 10.2.1. Heterocyclic Building Block
- 10.2.2. Benzene Ring Building Block
- 10.2.3. Aliphatic Building Block
- 10.2.4. Others
- 10.1. Market Analysis, Insights and Forecast - by Application
- 11. Asia Pacific Chemical Building Block Analysis, Insights and Forecast, 2020-2032
- 11.1. Market Analysis, Insights and Forecast - by Application
- 11.1.1. Innovative Drug
- 11.1.2. Generic Drug
- 11.2. Market Analysis, Insights and Forecast - by Type
- 11.2.1. Heterocyclic Building Block
- 11.2.2. Benzene Ring Building Block
- 11.2.3. Aliphatic Building Block
- 11.2.4. Others
- 11.1. Market Analysis, Insights and Forecast - by Application
- 12. Competitive Analysis
- 12.1. Company Profiles
- 12.1.1 Merck
- 12.1.1.1. Company Overview
- 12.1.1.2. Products
- 12.1.1.3. Company Financials
- 12.1.1.4. SWOT Analysis
- 12.1.2 Thermo Fisher Scientific
- 12.1.2.1. Company Overview
- 12.1.2.2. Products
- 12.1.2.3. Company Financials
- 12.1.2.4. SWOT Analysis
- 12.1.3 Enamine
- 12.1.3.1. Company Overview
- 12.1.3.2. Products
- 12.1.3.3. Company Financials
- 12.1.3.4. SWOT Analysis
- 12.1.4 Bide Pharmatech
- 12.1.4.1. Company Overview
- 12.1.4.2. Products
- 12.1.4.3. Company Financials
- 12.1.4.4. SWOT Analysis
- 12.1.5 Combi-Blocks
- 12.1.5.1. Company Overview
- 12.1.5.2. Products
- 12.1.5.3. Company Financials
- 12.1.5.4. SWOT Analysis
- 12.1.6 Tokyo Chemical Industry
- 12.1.6.1. Company Overview
- 12.1.6.2. Products
- 12.1.6.3. Company Financials
- 12.1.6.4. SWOT Analysis
- 12.1.7 PharmaBlock Sciences
- 12.1.7.1. Company Overview
- 12.1.7.2. Products
- 12.1.7.3. Company Financials
- 12.1.7.4. SWOT Analysis
- 12.1.8 Fluorochem
- 12.1.8.1. Company Overview
- 12.1.8.2. Products
- 12.1.8.3. Company Financials
- 12.1.8.4. SWOT Analysis
- 12.1.9 Haoyuan Chemexpress
- 12.1.9.1. Company Overview
- 12.1.9.2. Products
- 12.1.9.3. Company Financials
- 12.1.9.4. SWOT Analysis
- 12.1.10 AOBChem
- 12.1.10.1. Company Overview
- 12.1.10.2. Products
- 12.1.10.3. Company Financials
- 12.1.10.4. SWOT Analysis
- 12.1.11 Aladdin
- 12.1.11.1. Company Overview
- 12.1.11.2. Products
- 12.1.11.3. Company Financials
- 12.1.11.4. SWOT Analysis
- 12.1.12 AstaTech
- 12.1.12.1. Company Overview
- 12.1.12.2. Products
- 12.1.12.3. Company Financials
- 12.1.12.4. SWOT Analysis
- 12.1.13 Life Chemicals
- 12.1.13.1. Company Overview
- 12.1.13.2. Products
- 12.1.13.3. Company Financials
- 12.1.13.4. SWOT Analysis
- 12.1.14 Accela ChemBio
- 12.1.14.1. Company Overview
- 12.1.14.2. Products
- 12.1.14.3. Company Financials
- 12.1.14.4. SWOT Analysis
- 12.1.15 Apollo Scientific
- 12.1.15.1. Company Overview
- 12.1.15.2. Products
- 12.1.15.3. Company Financials
- 12.1.15.4. SWOT Analysis
- 12.1.16 BOC Sciences
- 12.1.16.1. Company Overview
- 12.1.16.2. Products
- 12.1.16.3. Company Financials
- 12.1.16.4. SWOT Analysis
- 12.1.17 ChemBridge
- 12.1.17.1. Company Overview
- 12.1.17.2. Products
- 12.1.17.3. Company Financials
- 12.1.17.4. SWOT Analysis
- 12.1.1 Merck
- 12.2. Market Entropy
- 12.2.1 Company's Key Areas Served
- 12.2.2 Recent Developments
- 12.3. Company Market Share Analysis 2025
- 12.3.1 Top 5 Companies Market Share Analysis
- 12.3.2 Top 3 Companies Market Share Analysis
- 12.4. List of Potential Customers
- 13. Research Methodology
List of Figures
- Figure 1: Global Chemical Building Block Revenue Breakdown (million, %) by Region 2025 & 2033
- Figure 2: Global Chemical Building Block Volume Breakdown (K, %) by Region 2025 & 2033
- Figure 3: North America Chemical Building Block Revenue (million), by Application 2025 & 2033
- Figure 4: North America Chemical Building Block Volume (K), by Application 2025 & 2033
- Figure 5: North America Chemical Building Block Revenue Share (%), by Application 2025 & 2033
- Figure 6: North America Chemical Building Block Volume Share (%), by Application 2025 & 2033
- Figure 7: North America Chemical Building Block Revenue (million), by Type 2025 & 2033
- Figure 8: North America Chemical Building Block Volume (K), by Type 2025 & 2033
- Figure 9: North America Chemical Building Block Revenue Share (%), by Type 2025 & 2033
- Figure 10: North America Chemical Building Block Volume Share (%), by Type 2025 & 2033
- Figure 11: North America Chemical Building Block Revenue (million), by Country 2025 & 2033
- Figure 12: North America Chemical Building Block Volume (K), by Country 2025 & 2033
- Figure 13: North America Chemical Building Block Revenue Share (%), by Country 2025 & 2033
- Figure 14: North America Chemical Building Block Volume Share (%), by Country 2025 & 2033
- Figure 15: South America Chemical Building Block Revenue (million), by Application 2025 & 2033
- Figure 16: South America Chemical Building Block Volume (K), by Application 2025 & 2033
- Figure 17: South America Chemical Building Block Revenue Share (%), by Application 2025 & 2033
- Figure 18: South America Chemical Building Block Volume Share (%), by Application 2025 & 2033
- Figure 19: South America Chemical Building Block Revenue (million), by Type 2025 & 2033
- Figure 20: South America Chemical Building Block Volume (K), by Type 2025 & 2033
- Figure 21: South America Chemical Building Block Revenue Share (%), by Type 2025 & 2033
- Figure 22: South America Chemical Building Block Volume Share (%), by Type 2025 & 2033
- Figure 23: South America Chemical Building Block Revenue (million), by Country 2025 & 2033
- Figure 24: South America Chemical Building Block Volume (K), by Country 2025 & 2033
- Figure 25: South America Chemical Building Block Revenue Share (%), by Country 2025 & 2033
- Figure 26: South America Chemical Building Block Volume Share (%), by Country 2025 & 2033
- Figure 27: Europe Chemical Building Block Revenue (million), by Application 2025 & 2033
- Figure 28: Europe Chemical Building Block Volume (K), by Application 2025 & 2033
- Figure 29: Europe Chemical Building Block Revenue Share (%), by Application 2025 & 2033
- Figure 30: Europe Chemical Building Block Volume Share (%), by Application 2025 & 2033
- Figure 31: Europe Chemical Building Block Revenue (million), by Type 2025 & 2033
- Figure 32: Europe Chemical Building Block Volume (K), by Type 2025 & 2033
- Figure 33: Europe Chemical Building Block Revenue Share (%), by Type 2025 & 2033
- Figure 34: Europe Chemical Building Block Volume Share (%), by Type 2025 & 2033
- Figure 35: Europe Chemical Building Block Revenue (million), by Country 2025 & 2033
- Figure 36: Europe Chemical Building Block Volume (K), by Country 2025 & 2033
- Figure 37: Europe Chemical Building Block Revenue Share (%), by Country 2025 & 2033
- Figure 38: Europe Chemical Building Block Volume Share (%), by Country 2025 & 2033
- Figure 39: Middle East & Africa Chemical Building Block Revenue (million), by Application 2025 & 2033
- Figure 40: Middle East & Africa Chemical Building Block Volume (K), by Application 2025 & 2033
- Figure 41: Middle East & Africa Chemical Building Block Revenue Share (%), by Application 2025 & 2033
- Figure 42: Middle East & Africa Chemical Building Block Volume Share (%), by Application 2025 & 2033
- Figure 43: Middle East & Africa Chemical Building Block Revenue (million), by Type 2025 & 2033
- Figure 44: Middle East & Africa Chemical Building Block Volume (K), by Type 2025 & 2033
- Figure 45: Middle East & Africa Chemical Building Block Revenue Share (%), by Type 2025 & 2033
- Figure 46: Middle East & Africa Chemical Building Block Volume Share (%), by Type 2025 & 2033
- Figure 47: Middle East & Africa Chemical Building Block Revenue (million), by Country 2025 & 2033
- Figure 48: Middle East & Africa Chemical Building Block Volume (K), by Country 2025 & 2033
- Figure 49: Middle East & Africa Chemical Building Block Revenue Share (%), by Country 2025 & 2033
- Figure 50: Middle East & Africa Chemical Building Block Volume Share (%), by Country 2025 & 2033
- Figure 51: Asia Pacific Chemical Building Block Revenue (million), by Application 2025 & 2033
- Figure 52: Asia Pacific Chemical Building Block Volume (K), by Application 2025 & 2033
- Figure 53: Asia Pacific Chemical Building Block Revenue Share (%), by Application 2025 & 2033
- Figure 54: Asia Pacific Chemical Building Block Volume Share (%), by Application 2025 & 2033
- Figure 55: Asia Pacific Chemical Building Block Revenue (million), by Type 2025 & 2033
- Figure 56: Asia Pacific Chemical Building Block Volume (K), by Type 2025 & 2033
- Figure 57: Asia Pacific Chemical Building Block Revenue Share (%), by Type 2025 & 2033
- Figure 58: Asia Pacific Chemical Building Block Volume Share (%), by Type 2025 & 2033
- Figure 59: Asia Pacific Chemical Building Block Revenue (million), by Country 2025 & 2033
- Figure 60: Asia Pacific Chemical Building Block Volume (K), by Country 2025 & 2033
- Figure 61: Asia Pacific Chemical Building Block Revenue Share (%), by Country 2025 & 2033
- Figure 62: Asia Pacific Chemical Building Block Volume Share (%), by Country 2025 & 2033
List of Tables
- Table 1: Global Chemical Building Block Revenue million Forecast, by Application 2020 & 2033
- Table 2: Global Chemical Building Block Volume K Forecast, by Application 2020 & 2033
- Table 3: Global Chemical Building Block Revenue million Forecast, by Type 2020 & 2033
- Table 4: Global Chemical Building Block Volume K Forecast, by Type 2020 & 2033
- Table 5: Global Chemical Building Block Revenue million Forecast, by Region 2020 & 2033
- Table 6: Global Chemical Building Block Volume K Forecast, by Region 2020 & 2033
- Table 7: Global Chemical Building Block Revenue million Forecast, by Application 2020 & 2033
- Table 8: Global Chemical Building Block Volume K Forecast, by Application 2020 & 2033
- Table 9: Global Chemical Building Block Revenue million Forecast, by Type 2020 & 2033
- Table 10: Global Chemical Building Block Volume K Forecast, by Type 2020 & 2033
- Table 11: Global Chemical Building Block Revenue million Forecast, by Country 2020 & 2033
- Table 12: Global Chemical Building Block Volume K Forecast, by Country 2020 & 2033
- Table 13: United States Chemical Building Block Revenue (million) Forecast, by Application 2020 & 2033
- Table 14: United States Chemical Building Block Volume (K) Forecast, by Application 2020 & 2033
- Table 15: Canada Chemical Building Block Revenue (million) Forecast, by Application 2020 & 2033
- Table 16: Canada Chemical Building Block Volume (K) Forecast, by Application 2020 & 2033
- Table 17: Mexico Chemical Building Block Revenue (million) Forecast, by Application 2020 & 2033
- Table 18: Mexico Chemical Building Block Volume (K) Forecast, by Application 2020 & 2033
- Table 19: Global Chemical Building Block Revenue million Forecast, by Application 2020 & 2033
- Table 20: Global Chemical Building Block Volume K Forecast, by Application 2020 & 2033
- Table 21: Global Chemical Building Block Revenue million Forecast, by Type 2020 & 2033
- Table 22: Global Chemical Building Block Volume K Forecast, by Type 2020 & 2033
- Table 23: Global Chemical Building Block Revenue million Forecast, by Country 2020 & 2033
- Table 24: Global Chemical Building Block Volume K Forecast, by Country 2020 & 2033
- Table 25: Brazil Chemical Building Block Revenue (million) Forecast, by Application 2020 & 2033
- Table 26: Brazil Chemical Building Block Volume (K) Forecast, by Application 2020 & 2033
- Table 27: Argentina Chemical Building Block Revenue (million) Forecast, by Application 2020 & 2033
- Table 28: Argentina Chemical Building Block Volume (K) Forecast, by Application 2020 & 2033
- Table 29: Rest of South America Chemical Building Block Revenue (million) Forecast, by Application 2020 & 2033
- Table 30: Rest of South America Chemical Building Block Volume (K) Forecast, by Application 2020 & 2033
- Table 31: Global Chemical Building Block Revenue million Forecast, by Application 2020 & 2033
- Table 32: Global Chemical Building Block Volume K Forecast, by Application 2020 & 2033
- Table 33: Global Chemical Building Block Revenue million Forecast, by Type 2020 & 2033
- Table 34: Global Chemical Building Block Volume K Forecast, by Type 2020 & 2033
- Table 35: Global Chemical Building Block Revenue million Forecast, by Country 2020 & 2033
- Table 36: Global Chemical Building Block Volume K Forecast, by Country 2020 & 2033
- Table 37: United Kingdom Chemical Building Block Revenue (million) Forecast, by Application 2020 & 2033
- Table 38: United Kingdom Chemical Building Block Volume (K) Forecast, by Application 2020 & 2033
- Table 39: Germany Chemical Building Block Revenue (million) Forecast, by Application 2020 & 2033
- Table 40: Germany Chemical Building Block Volume (K) Forecast, by Application 2020 & 2033
- Table 41: France Chemical Building Block Revenue (million) Forecast, by Application 2020 & 2033
- Table 42: France Chemical Building Block Volume (K) Forecast, by Application 2020 & 2033
- Table 43: Italy Chemical Building Block Revenue (million) Forecast, by Application 2020 & 2033
- Table 44: Italy Chemical Building Block Volume (K) Forecast, by Application 2020 & 2033
- Table 45: Spain Chemical Building Block Revenue (million) Forecast, by Application 2020 & 2033
- Table 46: Spain Chemical Building Block Volume (K) Forecast, by Application 2020 & 2033
- Table 47: Russia Chemical Building Block Revenue (million) Forecast, by Application 2020 & 2033
- Table 48: Russia Chemical Building Block Volume (K) Forecast, by Application 2020 & 2033
- Table 49: Benelux Chemical Building Block Revenue (million) Forecast, by Application 2020 & 2033
- Table 50: Benelux Chemical Building Block Volume (K) Forecast, by Application 2020 & 2033
- Table 51: Nordics Chemical Building Block Revenue (million) Forecast, by Application 2020 & 2033
- Table 52: Nordics Chemical Building Block Volume (K) Forecast, by Application 2020 & 2033
- Table 53: Rest of Europe Chemical Building Block Revenue (million) Forecast, by Application 2020 & 2033
- Table 54: Rest of Europe Chemical Building Block Volume (K) Forecast, by Application 2020 & 2033
- Table 55: Global Chemical Building Block Revenue million Forecast, by Application 2020 & 2033
- Table 56: Global Chemical Building Block Volume K Forecast, by Application 2020 & 2033
- Table 57: Global Chemical Building Block Revenue million Forecast, by Type 2020 & 2033
- Table 58: Global Chemical Building Block Volume K Forecast, by Type 2020 & 2033
- Table 59: Global Chemical Building Block Revenue million Forecast, by Country 2020 & 2033
- Table 60: Global Chemical Building Block Volume K Forecast, by Country 2020 & 2033
- Table 61: Turkey Chemical Building Block Revenue (million) Forecast, by Application 2020 & 2033
- Table 62: Turkey Chemical Building Block Volume (K) Forecast, by Application 2020 & 2033
- Table 63: Israel Chemical Building Block Revenue (million) Forecast, by Application 2020 & 2033
- Table 64: Israel Chemical Building Block Volume (K) Forecast, by Application 2020 & 2033
- Table 65: GCC Chemical Building Block Revenue (million) Forecast, by Application 2020 & 2033
- Table 66: GCC Chemical Building Block Volume (K) Forecast, by Application 2020 & 2033
- Table 67: North Africa Chemical Building Block Revenue (million) Forecast, by Application 2020 & 2033
- Table 68: North Africa Chemical Building Block Volume (K) Forecast, by Application 2020 & 2033
- Table 69: South Africa Chemical Building Block Revenue (million) Forecast, by Application 2020 & 2033
- Table 70: South Africa Chemical Building Block Volume (K) Forecast, by Application 2020 & 2033
- Table 71: Rest of Middle East & Africa Chemical Building Block Revenue (million) Forecast, by Application 2020 & 2033
- Table 72: Rest of Middle East & Africa Chemical Building Block Volume (K) Forecast, by Application 2020 & 2033
- Table 73: Global Chemical Building Block Revenue million Forecast, by Application 2020 & 2033
- Table 74: Global Chemical Building Block Volume K Forecast, by Application 2020 & 2033
- Table 75: Global Chemical Building Block Revenue million Forecast, by Type 2020 & 2033
- Table 76: Global Chemical Building Block Volume K Forecast, by Type 2020 & 2033
- Table 77: Global Chemical Building Block Revenue million Forecast, by Country 2020 & 2033
- Table 78: Global Chemical Building Block Volume K Forecast, by Country 2020 & 2033
- Table 79: China Chemical Building Block Revenue (million) Forecast, by Application 2020 & 2033
- Table 80: China Chemical Building Block Volume (K) Forecast, by Application 2020 & 2033
- Table 81: India Chemical Building Block Revenue (million) Forecast, by Application 2020 & 2033
- Table 82: India Chemical Building Block Volume (K) Forecast, by Application 2020 & 2033
- Table 83: Japan Chemical Building Block Revenue (million) Forecast, by Application 2020 & 2033
- Table 84: Japan Chemical Building Block Volume (K) Forecast, by Application 2020 & 2033
- Table 85: South Korea Chemical Building Block Revenue (million) Forecast, by Application 2020 & 2033
- Table 86: South Korea Chemical Building Block Volume (K) Forecast, by Application 2020 & 2033
- Table 87: ASEAN Chemical Building Block Revenue (million) Forecast, by Application 2020 & 2033
- Table 88: ASEAN Chemical Building Block Volume (K) Forecast, by Application 2020 & 2033
- Table 89: Oceania Chemical Building Block Revenue (million) Forecast, by Application 2020 & 2033
- Table 90: Oceania Chemical Building Block Volume (K) Forecast, by Application 2020 & 2033
- Table 91: Rest of Asia Pacific Chemical Building Block Revenue (million) Forecast, by Application 2020 & 2033
- Table 92: Rest of Asia Pacific Chemical Building Block Volume (K) Forecast, by Application 2020 & 2033
Frequently Asked Questions
1. What is the projected Compound Annual Growth Rate (CAGR) of the Chemical Building Block?
The projected CAGR is approximately 7.5%.
2. Which companies are prominent players in the Chemical Building Block?
Key companies in the market include Merck, Thermo Fisher Scientific, Enamine, Bide Pharmatech, Combi-Blocks, Tokyo Chemical Industry, PharmaBlock Sciences, Fluorochem, Haoyuan Chemexpress, AOBChem, Aladdin, AstaTech, Life Chemicals, Accela ChemBio, Apollo Scientific, BOC Sciences, ChemBridge.
3. What are the main segments of the Chemical Building Block?
The market segments include Application, Type.
4. Can you provide details about the market size?
The market size is estimated to be USD 3952 million as of 2022.
5. What are some drivers contributing to market growth?
N/A
6. What are the notable trends driving market growth?
N/A
7. Are there any restraints impacting market growth?
N/A
8. Can you provide examples of recent developments in the market?
N/A
9. What pricing options are available for accessing the report?
Pricing options include single-user, multi-user, and enterprise licenses priced at USD 3950.00, USD 5925.00, and USD 7900.00 respectively.
10. Is the market size provided in terms of value or volume?
The market size is provided in terms of value, measured in million and volume, measured in K.
11. Are there any specific market keywords associated with the report?
Yes, the market keyword associated with the report is "Chemical Building Block," which aids in identifying and referencing the specific market segment covered.
12. How do I determine which pricing option suits my needs best?
The pricing options vary based on user requirements and access needs. Individual users may opt for single-user licenses, while businesses requiring broader access may choose multi-user or enterprise licenses for cost-effective access to the report.
13. Are there any additional resources or data provided in the Chemical Building Block report?
While the report offers comprehensive insights, it's advisable to review the specific contents or supplementary materials provided to ascertain if additional resources or data are available.
14. How can I stay updated on further developments or reports in the Chemical Building Block?
To stay informed about further developments, trends, and reports in the Chemical Building Block, consider subscribing to industry newsletters, following relevant companies and organizations, or regularly checking reputable industry news sources and publications.
Methodology
Step 1 - Identification of Relevant Samples Size from Population Database


Step 2 - Approaches for Defining Global Market Size (Value, Volume* & Price*)

Note*: In applicable scenarios
Step 3 - Data Sources
Primary Research
- Web Analytics
- Survey Reports
- Research Institute
- Latest Research Reports
- Opinion Leaders
Secondary Research
- Annual Reports
- White Paper
- Latest Press Release
- Industry Association
- Paid Database
- Investor Presentations

Step 4 - Data Triangulation
Involves using different sources of information in order to increase the validity of a study
These sources are likely to be stakeholders in a program - participants, other researchers, program staff, other community members, and so on.
Then we put all data in single framework & apply various statistical tools to find out the dynamic on the market.
During the analysis stage, feedback from the stakeholder groups would be compared to determine areas of agreement as well as areas of divergence