Key Insights
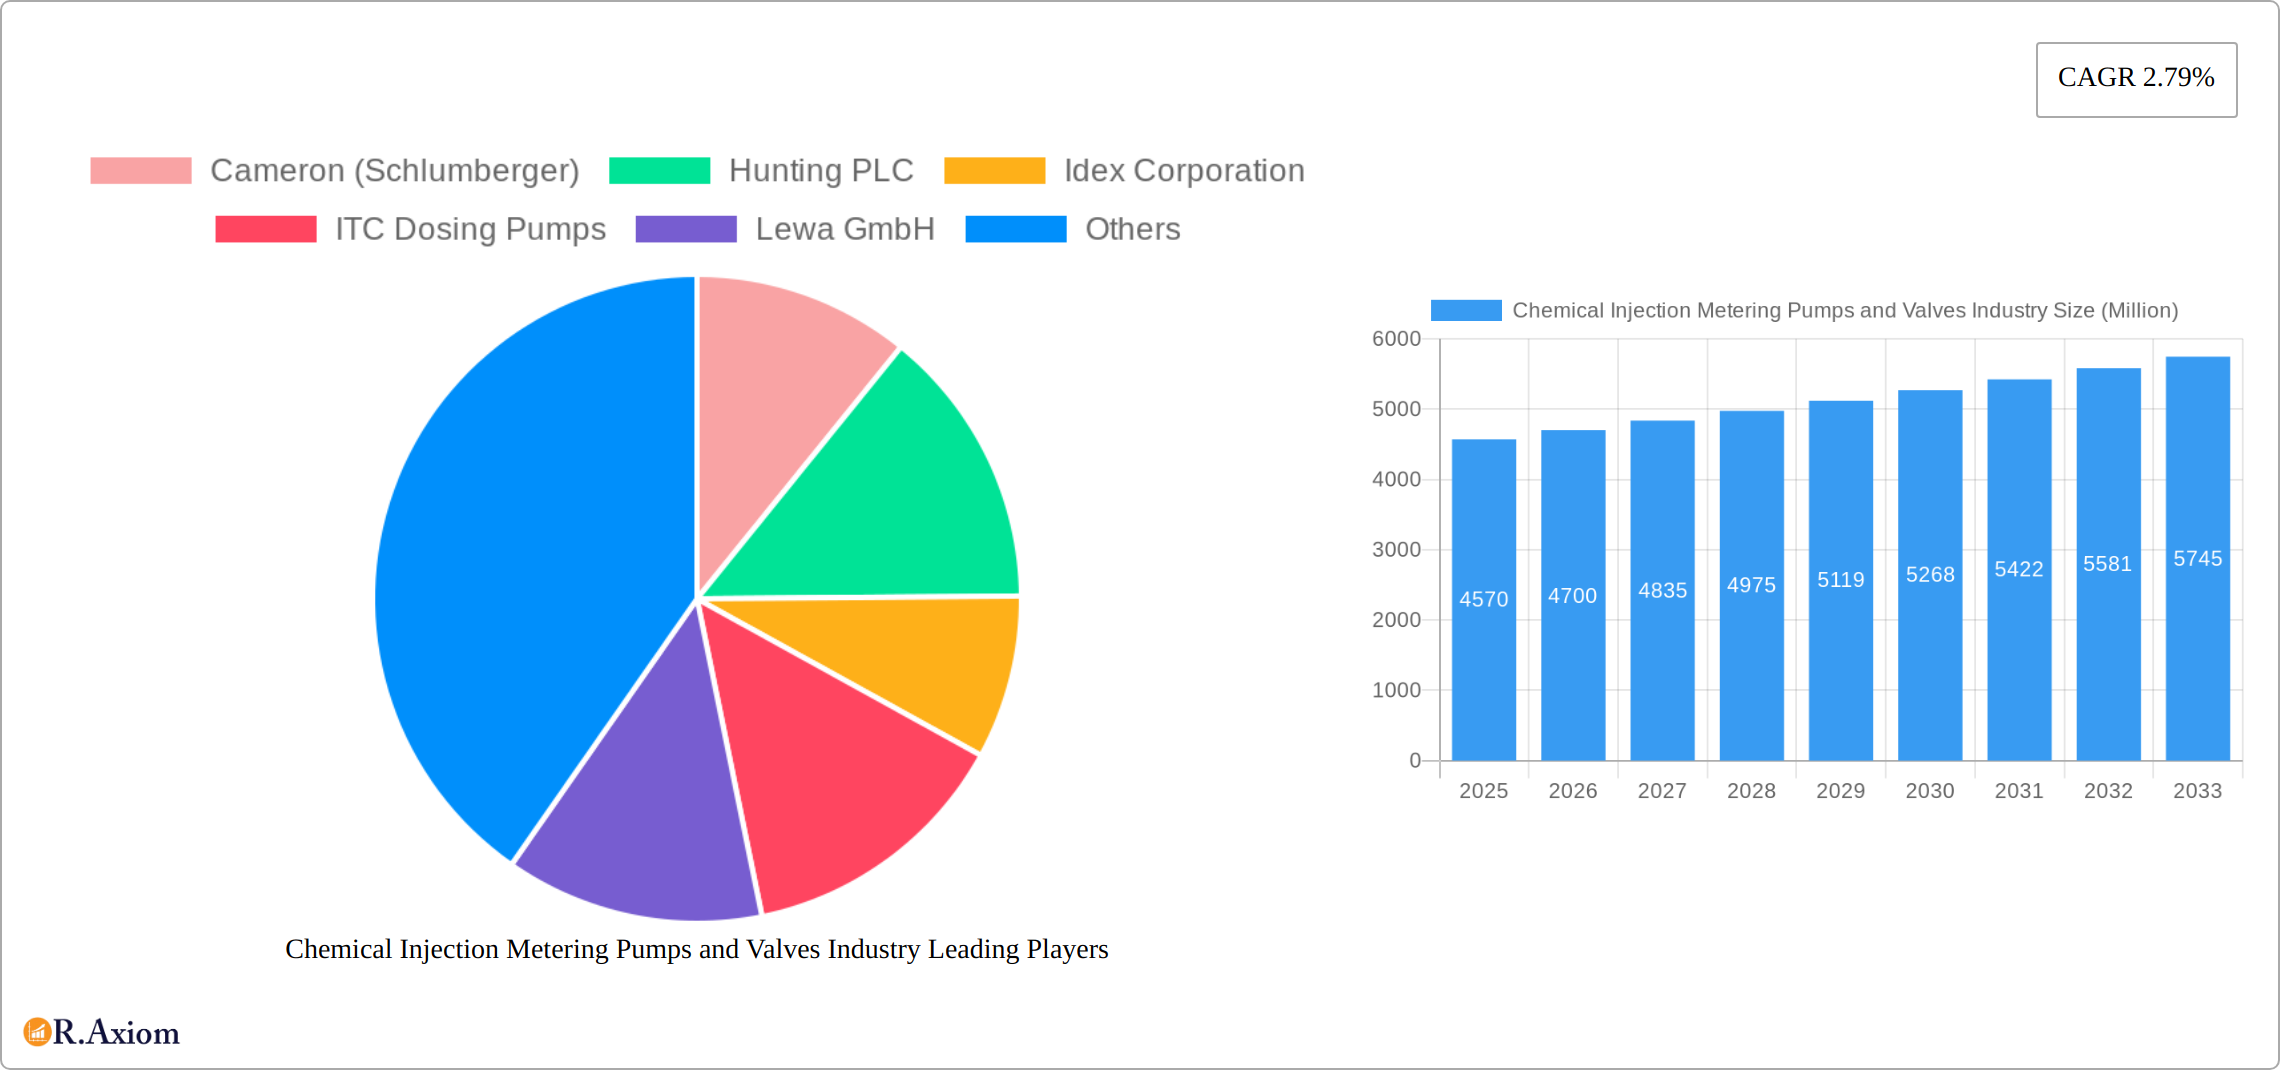
The global chemical injection metering pumps and valves market, valued at $4.57 billion in 2025, is projected to experience steady growth, driven by increasing demand across various industries. The Compound Annual Growth Rate (CAGR) of 2.79% from 2025 to 2033 indicates a robust, albeit moderate, expansion. Key drivers include the growing need for precise chemical injection in oil and gas extraction, water treatment, and the chemical processing sector itself. Automation and digitalization trends are further fueling market growth, with smart pumps and remote monitoring systems gaining traction. While regulatory compliance and stringent safety standards present some restraints, the overall market outlook remains positive, particularly due to rising environmental concerns and the consequent need for efficient and accurate chemical dosing in various applications. The market is segmented by pump type (e.g., diaphragm, piston, peristaltic), valve type (e.g., ball, butterfly, globe), application (e.g., oil and gas, water treatment, chemical processing), and region. Major players like Cameron (Schlumberger), Hunting PLC, and others are engaged in strategic partnerships, acquisitions, and technological advancements to maintain their market share in this competitive landscape.
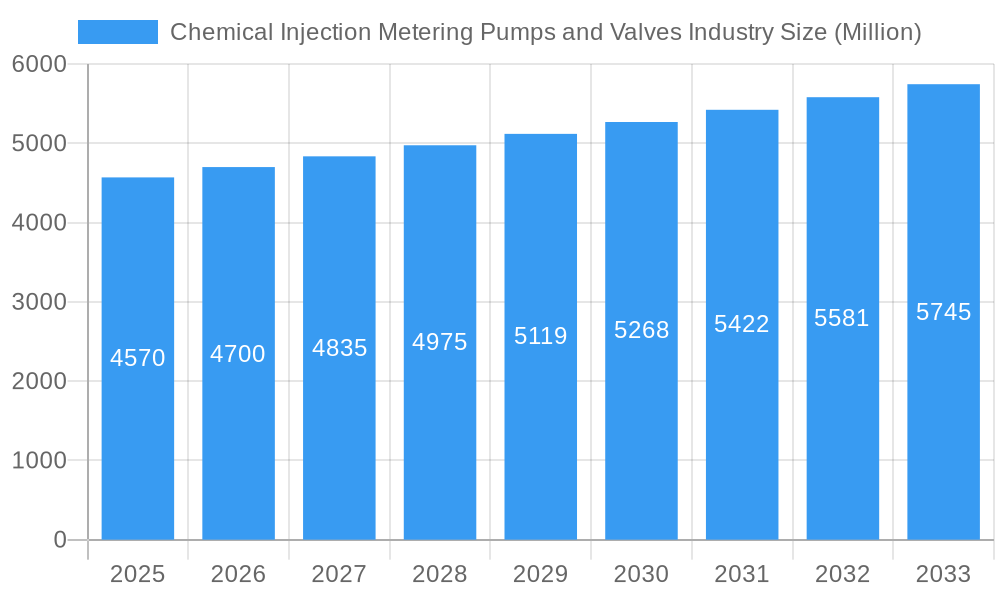
Chemical Injection Metering Pumps and Valves Industry Market Size (In Billion)
The market's expansion is expected to be driven by continuous innovation in pump and valve technology, resulting in improved efficiency, accuracy, and durability. Increased adoption of advanced materials resistant to corrosion and chemical degradation will also contribute to market growth. The consistent demand from developing economies, particularly in Asia-Pacific, is another significant factor. While pricing pressures and the availability of substitute technologies might pose challenges, the overall long-term projection suggests a continued, albeit gradual, expansion of the chemical injection metering pumps and valves market. This consistent demand is fueled by increasing industrial activity and stringent environmental regulations that require precise chemical handling and control. The competitive landscape is characterized by a mix of established players and emerging companies, all striving to cater to the diverse needs of different industrial sectors.
Chemical Injection Metering Pumps and Valves Industry Company Market Share
Chemical Injection Metering Pumps and Valves Industry: A Comprehensive Market Report (2019-2033)
This in-depth report provides a comprehensive analysis of the global Chemical Injection Metering Pumps and Valves industry, offering invaluable insights for stakeholders, investors, and industry professionals. The study covers the period 2019-2033, with a focus on the forecast period 2025-2033, using 2025 as the base year and estimated year. The report utilizes extensive primary and secondary research to deliver a detailed understanding of market dynamics, trends, and future prospects. The total market value in 2025 is estimated at $XX Million, projecting a CAGR of XX% during the forecast period.
Chemical Injection Metering Pumps and Valves Industry Market Concentration & Innovation
The Chemical Injection Metering Pumps and Valves industry is characterized by a moderately concentrated market structure. Leading global manufacturers such as Cameron (Schlumberger), Hunting PLC, Idex Corporation, ITC Dosing Pumps, Lewa GmbH, McFarland-Tritan LLC, Milton Roy, ProMinent, Seepex GmbH, Seko SpA, SkoFlo Industries Inc, SPX FLOW Inc, and Swelore Engineering Pvt Ltd, command significant market shares, though these can fluctuate across different product segments and geographical regions. In 2025, the top 5 market participants are estimated to collectively hold approximately 55-65% of the global market share, indicating a notable degree of market leadership.
Innovation remains a pivotal catalyst within the industry. Continuous advancements in material science, precision engineering, and sophisticated automation technologies are consistently yielding pumps and valves with enhanced operational efficiency, superior durability, and more precise control capabilities. The rigorous and evolving regulatory landscapes governing emissions and safety standards across diverse end-use sectors are powerful drivers of this innovation, compelling manufacturers to develop compliant and high-performance solutions. While alternative technologies exist, they often fall short in delivering the precision, reliability, and specialized functionalities demanded by critical chemical injection applications, thereby solidifying the market dominance of dedicated metering pumps and valves. Emerging end-user trends, particularly the growing demand for integrated automation and sophisticated remote monitoring systems, are significantly shaping product development strategies and pushing manufacturers towards smarter, connected solutions. Mergers and acquisitions (M&A) activity within the sector has been moderate, with strategic acquisitions over the past five years largely focused on securing specialized technological expertise and expanding global market footprints. Estimated total deal values in this period range from $150 to $250 Million, with an average deal value around $20 to $35 Million.
Chemical Injection Metering Pumps and Valves Industry Industry Trends & Insights
The Chemical Injection Metering Pumps and Valves industry is experiencing robust growth, fueled by several key factors. The increasing demand for sophisticated chemical injection solutions across diverse sectors, including oil & gas, water treatment, and chemical processing, is a significant driver. Technological advancements such as the integration of smart sensors, advanced control systems, and improved materials are enhancing efficiency and reliability. Furthermore, stringent environmental regulations are pushing for more precise and controlled chemical injection, increasing market adoption. Consumer preferences are shifting towards automated, energy-efficient, and low-maintenance systems. Competitive dynamics are characterized by intense competition among established players and the emergence of innovative startups offering specialized solutions. Market penetration in developing economies is rising gradually, contributing to overall market expansion.
The rising adoption of automation and remote monitoring solutions is a notable trend, with an estimated XX% market penetration by 2025. This trend is expected to propel market growth significantly in the forecast period. The industry continues to adapt to changing consumer needs and the increasing complexity of chemical processes.
Dominant Markets & Segments in Chemical Injection Metering Pumps and Valves Industry
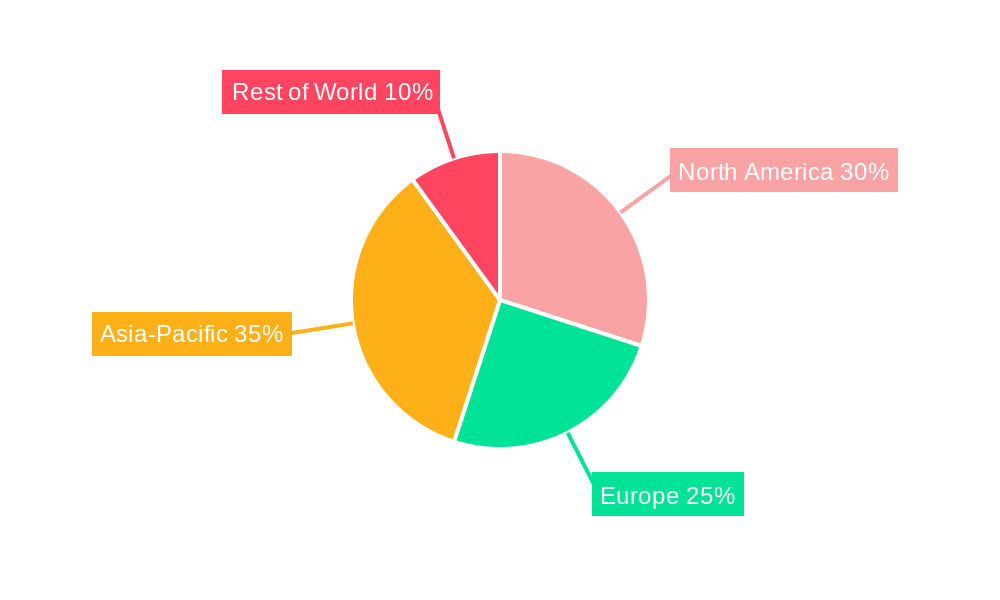
The North American region currently dominates the global market for chemical injection metering pumps and valves. This dominance stems from factors such as well-established industries, strong infrastructure, and high technological adoption rates. Within this region, the United States holds a significant share due to its large and diversified industrial base.
- Key Drivers in North America:
- Robust oil & gas sector requiring advanced chemical injection systems.
- Stringent environmental regulations driving demand for precise control solutions.
- Well-developed infrastructure supporting efficient supply chains.
- High technological adoption rates fostering innovation.
- Favorable government policies supporting industrial growth.
The European market is also a significant contributor, driven by its large chemical and pharmaceutical industries. However, North America's more advanced industrial base and stringent environmental regulations position it as the currently dominant market. The Asia-Pacific region demonstrates strong growth potential, driven by rapid industrialization and infrastructure development.
Chemical Injection Metering Pumps and Valves Industry Product Developments
Recent product innovations are heavily concentrated on elevating accuracy, optimizing operational efficiency, and enhancing real-time control. The strategic integration of advanced smart sensors, intelligent control systems, and sophisticated predictive maintenance algorithms is significantly improving system reliability and concurrently driving down overall operational expenditures. Furthermore, the adoption of cutting-edge materials, including highly corrosion-resistant alloys and advanced polymers, is effectively broadening the application spectrum of these pumps and valves, enabling them to handle an increasingly diverse range of aggressive and challenging chemicals. These advancements are a direct response to escalating customer demands for seamless automation, minimized downtime, and environmentally responsible solutions, thereby solidifying their competitive advantage and market relevance.
Report Scope & Segmentation Analysis
This report provides a comprehensive analysis of the Chemical Injection Metering Pumps and Valves market, segmented across key parameters:
-
By Pump Type: This segmentation includes Diaphragm Pumps, Piston Pumps, Plunger Pumps, and other specialized types, such as centrifugal pumps. Each category is analyzed for its projected growth trajectory and current market size. The diaphragm pump segment is anticipated to exhibit particularly robust growth due to its inherent versatility and widespread applicability across various industrial processes.
-
By Valve Type: The analysis covers Ball Valves, Butterfly Valves, Globe Valves, Check Valves, and other highly specialized valves engineered for specific chemical handling requirements. The escalating demand for corrosion-resistant valve solutions is projected to be a primary growth driver for this segment.
-
By End-User Industry: Key industries examined include Oil & Gas, Water Treatment, Chemical Processing, Power Generation, and others. The Oil & Gas sector currently represents the largest market share, but significant growth opportunities are emerging from expanding applications in sectors like water treatment.
-
By Region: The market is segmented into North America, Europe, Asia-Pacific, Middle East & Africa, and South America. North America currently holds the dominant market share, while the Asia-Pacific region is forecast to experience the most substantial growth rate in the coming years.
Each segment is subjected to detailed analysis, outlining its current market valuation, future growth projections, and the competitive landscape within that specific area.
Key Drivers of Chemical Injection Metering Pumps and Valves Industry Growth
Several factors are driving growth in this industry. The increasing demand for precise chemical injection across various industries, especially oil & gas and water treatment, is a primary driver. Stricter environmental regulations mandating precise chemical dosing are also contributing significantly. Technological advancements, including the development of smart sensors and advanced control systems, are enhancing the efficiency and reliability of these systems. Finally, the growing adoption of automation and remote monitoring capabilities is further boosting market expansion.
Challenges in the Chemical Injection Metering Pumps and Valves Industry Sector
The Chemical Injection Metering Pumps and Valves industry faces several challenges. Supply chain disruptions and fluctuations in raw material prices affect production costs and profitability. Intense competition among established players and the emergence of new entrants create pricing pressures. Stricter environmental regulations increase compliance costs and necessitate continuous product innovation. These factors collectively impact market growth and profitability.
Emerging Opportunities in Chemical Injection Metering Pumps and Valves Industry
Significant opportunities exist in expanding into developing economies with growing industrial sectors and improving infrastructure. The adoption of Industry 4.0 technologies, such as predictive maintenance and digital twinning, offers potential for improved efficiency and reduced downtime. The rising demand for sustainable and environmentally friendly solutions presents opportunities for the development of energy-efficient and eco-friendly pumps and valves. These areas represent significant avenues for future growth and innovation.
Leading Players in the Chemical Injection Metering Pumps and Valves Industry Market
- Cameron (Schlumberger)
- Hunting PLC
- Idex Corporation
- ITC Dosing Pumps
- Lewa GmbH
- McFarland-Tritan LLC
- Milton Roy
- ProMinent
- Seepex GmbH
- Seko SpA
- SkoFlo Industries Inc
- SPX FLOW Inc
- Swelore Engineering Pvt Ltd
- List Not Exhaustive
Key Developments in Chemical Injection Metering Pumps and Valves Industry Industry
- October 2022: SPX FLOW Inc. strategically launched an innovative new series of high-pressure diaphragm pumps, specifically engineered to meet the stringent demands of advanced chemical injection applications. This product introduction significantly expanded the company's existing portfolio and reinforced its competitive standing in the market.
- March 2023: Lewa GmbH established a strategic partnership with a premier sensor technology firm to integrate state-of-the-art monitoring capabilities into its pump systems. This collaborative effort has substantially enhanced pump efficiency and operational reliability, providing users with crucial, real-time insights into system performance.
- June 2023: A notable consolidation within the industry occurred with the merger of two smaller, specialized companies. This strategic alliance has resulted in an expanded market presence and an increased collective market share for the newly formed entity. Specific financial details of this transaction are pending further disclosure.
- Additional significant developments and their associated timelines will be comprehensively detailed in the final report.
Strategic Outlook for Chemical Injection Metering Pumps and Valves Industry Market
The Chemical Injection Metering Pumps and Valves industry is poised for continued growth, driven by technological advancements, increasing automation, and stringent environmental regulations. The focus on improving efficiency, reliability, and sustainability presents significant opportunities for innovation. Expanding into new markets and developing niche applications will be key to capturing future market share and driving further industry expansion. The growing adoption of digital technologies presents a significant opportunity to enhance system performance and predictive maintenance.
Chemical Injection Metering Pumps and Valves Industry Segmentation
-
1. Pump Type
- 1.1. Diaphragm
- 1.2. Piston/Plunger
- 1.3. Other Pump Types
-
2. End-user Industry
- 2.1. Energy, Power, and Chemicals
- 2.2. Oil and Gas
- 2.3. Water and Wastewater Treatment
- 2.4. Food and Beverage
- 2.5. Pharmaceutical
Chemical Injection Metering Pumps and Valves Industry Segmentation By Geography
-
1. Asia Pacific
- 1.1. China
- 1.2. India
- 1.3. Japan
- 1.4. South Korea
- 1.5. ASEAN Countries
- 1.6. Australia and New Zealand
- 1.7. Rest of Asia Pacific
-
2. North America
- 2.1. United States
- 2.2. Canada
- 2.3. Mexico
-
3. Europe
- 3.1. Germany
- 3.2. United Kingdom
- 3.3. Italy
- 3.4. France
- 3.5. Russia
- 3.6. Spain
- 3.7. Rest of Europe
-
4. South America
- 4.1. Brazil
- 4.2. Argentina
- 4.3. Rest of South America
-
5. Middle East and Africa
- 5.1. Saudi Arabia
- 5.2. South Africa
- 5.3. Rest of Middle East and Africa
Chemical Injection Metering Pumps and Valves Industry Regional Market Share
Geographic Coverage of Chemical Injection Metering Pumps and Valves Industry
Chemical Injection Metering Pumps and Valves Industry REPORT HIGHLIGHTS
| Aspects | Details |
|---|---|
| Study Period | 2020-2034 |
| Base Year | 2025 |
| Estimated Year | 2026 |
| Forecast Period | 2026-2034 |
| Historical Period | 2020-2025 |
| Growth Rate | CAGR of 2.79% from 2020-2034 |
| Segmentation |
|
Table of Contents
- 1. Introduction
- 1.1. Research Scope
- 1.2. Market Segmentation
- 1.3. Research Objective
- 1.4. Definitions and Assumptions
- 2. Executive Summary
- 2.1. Market Snapshot
- 3. Market Dynamics
- 3.1. Market Drivers
- 3.2. Market Restrains
- 3.3. Market Trends
- 3.4. Market Opportunities
- 4. Market Factor Analysis
- 4.1. Porters Five Forces
- 4.1.1. Bargaining Power of Suppliers
- 4.1.2. Bargaining Power of Buyers
- 4.1.3. Threat of New Entrants
- 4.1.4. Threat of Substitutes
- 4.1.5. Competitive Rivalry
- 4.2. PESTEL analysis
- 4.3. BCG Analysis
- 4.3.1. Stars (High Growth, High Market Share)
- 4.3.2. Cash Cows (Low Growth, High Market Share)
- 4.3.3. Question Mark (High Growth, Low Market Share)
- 4.3.4. Dogs (Low Growth, Low Market Share)
- 4.4. Ansoff Matrix Analysis
- 4.5. Supply Chain Analysis
- 4.6. Regulatory Landscape
- 4.7. Current Market Potential and Opportunity Assessment (TAM–SAM–SOM Framework)
- 4.8. RAX Analyst Note
- 4.1. Porters Five Forces
- 5. Market Analysis, Insights and Forecast 2021-2033
- 5.1. Market Analysis, Insights and Forecast - by Pump Type
- 5.1.1. Diaphragm
- 5.1.2. Piston/Plunger
- 5.1.3. Other Pump Types
- 5.2. Market Analysis, Insights and Forecast - by End-user Industry
- 5.2.1. Energy, Power, and Chemicals
- 5.2.2. Oil and Gas
- 5.2.3. Water and Wastewater Treatment
- 5.2.4. Food and Beverage
- 5.2.5. Pharmaceutical
- 5.3. Market Analysis, Insights and Forecast - by Region
- 5.3.1. Asia Pacific
- 5.3.2. North America
- 5.3.3. Europe
- 5.3.4. South America
- 5.3.5. Middle East and Africa
- 5.1. Market Analysis, Insights and Forecast - by Pump Type
- 6. Global Chemical Injection Metering Pumps and Valves Industry Analysis, Insights and Forecast, 2021-2033
- 6.1. Market Analysis, Insights and Forecast - by Pump Type
- 6.1.1. Diaphragm
- 6.1.2. Piston/Plunger
- 6.1.3. Other Pump Types
- 6.2. Market Analysis, Insights and Forecast - by End-user Industry
- 6.2.1. Energy, Power, and Chemicals
- 6.2.2. Oil and Gas
- 6.2.3. Water and Wastewater Treatment
- 6.2.4. Food and Beverage
- 6.2.5. Pharmaceutical
- 6.1. Market Analysis, Insights and Forecast - by Pump Type
- 7. Asia Pacific Chemical Injection Metering Pumps and Valves Industry Analysis, Insights and Forecast, 2020-2032
- 7.1. Market Analysis, Insights and Forecast - by Pump Type
- 7.1.1. Diaphragm
- 7.1.2. Piston/Plunger
- 7.1.3. Other Pump Types
- 7.2. Market Analysis, Insights and Forecast - by End-user Industry
- 7.2.1. Energy, Power, and Chemicals
- 7.2.2. Oil and Gas
- 7.2.3. Water and Wastewater Treatment
- 7.2.4. Food and Beverage
- 7.2.5. Pharmaceutical
- 7.1. Market Analysis, Insights and Forecast - by Pump Type
- 8. North America Chemical Injection Metering Pumps and Valves Industry Analysis, Insights and Forecast, 2020-2032
- 8.1. Market Analysis, Insights and Forecast - by Pump Type
- 8.1.1. Diaphragm
- 8.1.2. Piston/Plunger
- 8.1.3. Other Pump Types
- 8.2. Market Analysis, Insights and Forecast - by End-user Industry
- 8.2.1. Energy, Power, and Chemicals
- 8.2.2. Oil and Gas
- 8.2.3. Water and Wastewater Treatment
- 8.2.4. Food and Beverage
- 8.2.5. Pharmaceutical
- 8.1. Market Analysis, Insights and Forecast - by Pump Type
- 9. Europe Chemical Injection Metering Pumps and Valves Industry Analysis, Insights and Forecast, 2020-2032
- 9.1. Market Analysis, Insights and Forecast - by Pump Type
- 9.1.1. Diaphragm
- 9.1.2. Piston/Plunger
- 9.1.3. Other Pump Types
- 9.2. Market Analysis, Insights and Forecast - by End-user Industry
- 9.2.1. Energy, Power, and Chemicals
- 9.2.2. Oil and Gas
- 9.2.3. Water and Wastewater Treatment
- 9.2.4. Food and Beverage
- 9.2.5. Pharmaceutical
- 9.1. Market Analysis, Insights and Forecast - by Pump Type
- 10. South America Chemical Injection Metering Pumps and Valves Industry Analysis, Insights and Forecast, 2020-2032
- 10.1. Market Analysis, Insights and Forecast - by Pump Type
- 10.1.1. Diaphragm
- 10.1.2. Piston/Plunger
- 10.1.3. Other Pump Types
- 10.2. Market Analysis, Insights and Forecast - by End-user Industry
- 10.2.1. Energy, Power, and Chemicals
- 10.2.2. Oil and Gas
- 10.2.3. Water and Wastewater Treatment
- 10.2.4. Food and Beverage
- 10.2.5. Pharmaceutical
- 10.1. Market Analysis, Insights and Forecast - by Pump Type
- 11. Middle East and Africa Chemical Injection Metering Pumps and Valves Industry Analysis, Insights and Forecast, 2020-2032
- 11.1. Market Analysis, Insights and Forecast - by Pump Type
- 11.1.1. Diaphragm
- 11.1.2. Piston/Plunger
- 11.1.3. Other Pump Types
- 11.2. Market Analysis, Insights and Forecast - by End-user Industry
- 11.2.1. Energy, Power, and Chemicals
- 11.2.2. Oil and Gas
- 11.2.3. Water and Wastewater Treatment
- 11.2.4. Food and Beverage
- 11.2.5. Pharmaceutical
- 11.1. Market Analysis, Insights and Forecast - by Pump Type
- 12. Competitive Analysis
- 12.1. Company Profiles
- 12.1.1 Cameron (Schlumberger)
- 12.1.1.1. Company Overview
- 12.1.1.2. Products
- 12.1.1.3. Company Financials
- 12.1.1.4. SWOT Analysis
- 12.1.2 Hunting PLC
- 12.1.2.1. Company Overview
- 12.1.2.2. Products
- 12.1.2.3. Company Financials
- 12.1.2.4. SWOT Analysis
- 12.1.3 Idex Corporation
- 12.1.3.1. Company Overview
- 12.1.3.2. Products
- 12.1.3.3. Company Financials
- 12.1.3.4. SWOT Analysis
- 12.1.4 ITC Dosing Pumps
- 12.1.4.1. Company Overview
- 12.1.4.2. Products
- 12.1.4.3. Company Financials
- 12.1.4.4. SWOT Analysis
- 12.1.5 Lewa GmbH
- 12.1.5.1. Company Overview
- 12.1.5.2. Products
- 12.1.5.3. Company Financials
- 12.1.5.4. SWOT Analysis
- 12.1.6 McFarland-Tritan LLC
- 12.1.6.1. Company Overview
- 12.1.6.2. Products
- 12.1.6.3. Company Financials
- 12.1.6.4. SWOT Analysis
- 12.1.7 Milton Roy
- 12.1.7.1. Company Overview
- 12.1.7.2. Products
- 12.1.7.3. Company Financials
- 12.1.7.4. SWOT Analysis
- 12.1.8 ProMinent
- 12.1.8.1. Company Overview
- 12.1.8.2. Products
- 12.1.8.3. Company Financials
- 12.1.8.4. SWOT Analysis
- 12.1.9 Seepex GmbH
- 12.1.9.1. Company Overview
- 12.1.9.2. Products
- 12.1.9.3. Company Financials
- 12.1.9.4. SWOT Analysis
- 12.1.10 Seko SpA
- 12.1.10.1. Company Overview
- 12.1.10.2. Products
- 12.1.10.3. Company Financials
- 12.1.10.4. SWOT Analysis
- 12.1.11 SkoFlo Industries Inc
- 12.1.11.1. Company Overview
- 12.1.11.2. Products
- 12.1.11.3. Company Financials
- 12.1.11.4. SWOT Analysis
- 12.1.12 SPX FLOW Inc
- 12.1.12.1. Company Overview
- 12.1.12.2. Products
- 12.1.12.3. Company Financials
- 12.1.12.4. SWOT Analysis
- 12.1.13 Swelore Engineering Pvt Ltd *List Not Exhaustive
- 12.1.13.1. Company Overview
- 12.1.13.2. Products
- 12.1.13.3. Company Financials
- 12.1.13.4. SWOT Analysis
- 12.1.1 Cameron (Schlumberger)
- 12.2. Market Entropy
- 12.2.1 Company's Key Areas Served
- 12.2.2 Recent Developments
- 12.3. Company Market Share Analysis 2025
- 12.3.1 Top 5 Companies Market Share Analysis
- 12.3.2 Top 3 Companies Market Share Analysis
- 12.4. List of Potential Customers
- 13. Research Methodology
List of Figures
- Figure 1: Global Chemical Injection Metering Pumps and Valves Industry Revenue Breakdown (Million, %) by Region 2025 & 2033
- Figure 2: Global Chemical Injection Metering Pumps and Valves Industry Volume Breakdown (Billion, %) by Region 2025 & 2033
- Figure 3: Asia Pacific Chemical Injection Metering Pumps and Valves Industry Revenue (Million), by Pump Type 2025 & 2033
- Figure 4: Asia Pacific Chemical Injection Metering Pumps and Valves Industry Volume (Billion), by Pump Type 2025 & 2033
- Figure 5: Asia Pacific Chemical Injection Metering Pumps and Valves Industry Revenue Share (%), by Pump Type 2025 & 2033
- Figure 6: Asia Pacific Chemical Injection Metering Pumps and Valves Industry Volume Share (%), by Pump Type 2025 & 2033
- Figure 7: Asia Pacific Chemical Injection Metering Pumps and Valves Industry Revenue (Million), by End-user Industry 2025 & 2033
- Figure 8: Asia Pacific Chemical Injection Metering Pumps and Valves Industry Volume (Billion), by End-user Industry 2025 & 2033
- Figure 9: Asia Pacific Chemical Injection Metering Pumps and Valves Industry Revenue Share (%), by End-user Industry 2025 & 2033
- Figure 10: Asia Pacific Chemical Injection Metering Pumps and Valves Industry Volume Share (%), by End-user Industry 2025 & 2033
- Figure 11: Asia Pacific Chemical Injection Metering Pumps and Valves Industry Revenue (Million), by Country 2025 & 2033
- Figure 12: Asia Pacific Chemical Injection Metering Pumps and Valves Industry Volume (Billion), by Country 2025 & 2033
- Figure 13: Asia Pacific Chemical Injection Metering Pumps and Valves Industry Revenue Share (%), by Country 2025 & 2033
- Figure 14: Asia Pacific Chemical Injection Metering Pumps and Valves Industry Volume Share (%), by Country 2025 & 2033
- Figure 15: North America Chemical Injection Metering Pumps and Valves Industry Revenue (Million), by Pump Type 2025 & 2033
- Figure 16: North America Chemical Injection Metering Pumps and Valves Industry Volume (Billion), by Pump Type 2025 & 2033
- Figure 17: North America Chemical Injection Metering Pumps and Valves Industry Revenue Share (%), by Pump Type 2025 & 2033
- Figure 18: North America Chemical Injection Metering Pumps and Valves Industry Volume Share (%), by Pump Type 2025 & 2033
- Figure 19: North America Chemical Injection Metering Pumps and Valves Industry Revenue (Million), by End-user Industry 2025 & 2033
- Figure 20: North America Chemical Injection Metering Pumps and Valves Industry Volume (Billion), by End-user Industry 2025 & 2033
- Figure 21: North America Chemical Injection Metering Pumps and Valves Industry Revenue Share (%), by End-user Industry 2025 & 2033
- Figure 22: North America Chemical Injection Metering Pumps and Valves Industry Volume Share (%), by End-user Industry 2025 & 2033
- Figure 23: North America Chemical Injection Metering Pumps and Valves Industry Revenue (Million), by Country 2025 & 2033
- Figure 24: North America Chemical Injection Metering Pumps and Valves Industry Volume (Billion), by Country 2025 & 2033
- Figure 25: North America Chemical Injection Metering Pumps and Valves Industry Revenue Share (%), by Country 2025 & 2033
- Figure 26: North America Chemical Injection Metering Pumps and Valves Industry Volume Share (%), by Country 2025 & 2033
- Figure 27: Europe Chemical Injection Metering Pumps and Valves Industry Revenue (Million), by Pump Type 2025 & 2033
- Figure 28: Europe Chemical Injection Metering Pumps and Valves Industry Volume (Billion), by Pump Type 2025 & 2033
- Figure 29: Europe Chemical Injection Metering Pumps and Valves Industry Revenue Share (%), by Pump Type 2025 & 2033
- Figure 30: Europe Chemical Injection Metering Pumps and Valves Industry Volume Share (%), by Pump Type 2025 & 2033
- Figure 31: Europe Chemical Injection Metering Pumps and Valves Industry Revenue (Million), by End-user Industry 2025 & 2033
- Figure 32: Europe Chemical Injection Metering Pumps and Valves Industry Volume (Billion), by End-user Industry 2025 & 2033
- Figure 33: Europe Chemical Injection Metering Pumps and Valves Industry Revenue Share (%), by End-user Industry 2025 & 2033
- Figure 34: Europe Chemical Injection Metering Pumps and Valves Industry Volume Share (%), by End-user Industry 2025 & 2033
- Figure 35: Europe Chemical Injection Metering Pumps and Valves Industry Revenue (Million), by Country 2025 & 2033
- Figure 36: Europe Chemical Injection Metering Pumps and Valves Industry Volume (Billion), by Country 2025 & 2033
- Figure 37: Europe Chemical Injection Metering Pumps and Valves Industry Revenue Share (%), by Country 2025 & 2033
- Figure 38: Europe Chemical Injection Metering Pumps and Valves Industry Volume Share (%), by Country 2025 & 2033
- Figure 39: South America Chemical Injection Metering Pumps and Valves Industry Revenue (Million), by Pump Type 2025 & 2033
- Figure 40: South America Chemical Injection Metering Pumps and Valves Industry Volume (Billion), by Pump Type 2025 & 2033
- Figure 41: South America Chemical Injection Metering Pumps and Valves Industry Revenue Share (%), by Pump Type 2025 & 2033
- Figure 42: South America Chemical Injection Metering Pumps and Valves Industry Volume Share (%), by Pump Type 2025 & 2033
- Figure 43: South America Chemical Injection Metering Pumps and Valves Industry Revenue (Million), by End-user Industry 2025 & 2033
- Figure 44: South America Chemical Injection Metering Pumps and Valves Industry Volume (Billion), by End-user Industry 2025 & 2033
- Figure 45: South America Chemical Injection Metering Pumps and Valves Industry Revenue Share (%), by End-user Industry 2025 & 2033
- Figure 46: South America Chemical Injection Metering Pumps and Valves Industry Volume Share (%), by End-user Industry 2025 & 2033
- Figure 47: South America Chemical Injection Metering Pumps and Valves Industry Revenue (Million), by Country 2025 & 2033
- Figure 48: South America Chemical Injection Metering Pumps and Valves Industry Volume (Billion), by Country 2025 & 2033
- Figure 49: South America Chemical Injection Metering Pumps and Valves Industry Revenue Share (%), by Country 2025 & 2033
- Figure 50: South America Chemical Injection Metering Pumps and Valves Industry Volume Share (%), by Country 2025 & 2033
- Figure 51: Middle East and Africa Chemical Injection Metering Pumps and Valves Industry Revenue (Million), by Pump Type 2025 & 2033
- Figure 52: Middle East and Africa Chemical Injection Metering Pumps and Valves Industry Volume (Billion), by Pump Type 2025 & 2033
- Figure 53: Middle East and Africa Chemical Injection Metering Pumps and Valves Industry Revenue Share (%), by Pump Type 2025 & 2033
- Figure 54: Middle East and Africa Chemical Injection Metering Pumps and Valves Industry Volume Share (%), by Pump Type 2025 & 2033
- Figure 55: Middle East and Africa Chemical Injection Metering Pumps and Valves Industry Revenue (Million), by End-user Industry 2025 & 2033
- Figure 56: Middle East and Africa Chemical Injection Metering Pumps and Valves Industry Volume (Billion), by End-user Industry 2025 & 2033
- Figure 57: Middle East and Africa Chemical Injection Metering Pumps and Valves Industry Revenue Share (%), by End-user Industry 2025 & 2033
- Figure 58: Middle East and Africa Chemical Injection Metering Pumps and Valves Industry Volume Share (%), by End-user Industry 2025 & 2033
- Figure 59: Middle East and Africa Chemical Injection Metering Pumps and Valves Industry Revenue (Million), by Country 2025 & 2033
- Figure 60: Middle East and Africa Chemical Injection Metering Pumps and Valves Industry Volume (Billion), by Country 2025 & 2033
- Figure 61: Middle East and Africa Chemical Injection Metering Pumps and Valves Industry Revenue Share (%), by Country 2025 & 2033
- Figure 62: Middle East and Africa Chemical Injection Metering Pumps and Valves Industry Volume Share (%), by Country 2025 & 2033
List of Tables
- Table 1: Global Chemical Injection Metering Pumps and Valves Industry Revenue Million Forecast, by Pump Type 2020 & 2033
- Table 2: Global Chemical Injection Metering Pumps and Valves Industry Volume Billion Forecast, by Pump Type 2020 & 2033
- Table 3: Global Chemical Injection Metering Pumps and Valves Industry Revenue Million Forecast, by End-user Industry 2020 & 2033
- Table 4: Global Chemical Injection Metering Pumps and Valves Industry Volume Billion Forecast, by End-user Industry 2020 & 2033
- Table 5: Global Chemical Injection Metering Pumps and Valves Industry Revenue Million Forecast, by Region 2020 & 2033
- Table 6: Global Chemical Injection Metering Pumps and Valves Industry Volume Billion Forecast, by Region 2020 & 2033
- Table 7: Global Chemical Injection Metering Pumps and Valves Industry Revenue Million Forecast, by Pump Type 2020 & 2033
- Table 8: Global Chemical Injection Metering Pumps and Valves Industry Volume Billion Forecast, by Pump Type 2020 & 2033
- Table 9: Global Chemical Injection Metering Pumps and Valves Industry Revenue Million Forecast, by End-user Industry 2020 & 2033
- Table 10: Global Chemical Injection Metering Pumps and Valves Industry Volume Billion Forecast, by End-user Industry 2020 & 2033
- Table 11: Global Chemical Injection Metering Pumps and Valves Industry Revenue Million Forecast, by Country 2020 & 2033
- Table 12: Global Chemical Injection Metering Pumps and Valves Industry Volume Billion Forecast, by Country 2020 & 2033
- Table 13: China Chemical Injection Metering Pumps and Valves Industry Revenue (Million) Forecast, by Application 2020 & 2033
- Table 14: China Chemical Injection Metering Pumps and Valves Industry Volume (Billion) Forecast, by Application 2020 & 2033
- Table 15: India Chemical Injection Metering Pumps and Valves Industry Revenue (Million) Forecast, by Application 2020 & 2033
- Table 16: India Chemical Injection Metering Pumps and Valves Industry Volume (Billion) Forecast, by Application 2020 & 2033
- Table 17: Japan Chemical Injection Metering Pumps and Valves Industry Revenue (Million) Forecast, by Application 2020 & 2033
- Table 18: Japan Chemical Injection Metering Pumps and Valves Industry Volume (Billion) Forecast, by Application 2020 & 2033
- Table 19: South Korea Chemical Injection Metering Pumps and Valves Industry Revenue (Million) Forecast, by Application 2020 & 2033
- Table 20: South Korea Chemical Injection Metering Pumps and Valves Industry Volume (Billion) Forecast, by Application 2020 & 2033
- Table 21: ASEAN Countries Chemical Injection Metering Pumps and Valves Industry Revenue (Million) Forecast, by Application 2020 & 2033
- Table 22: ASEAN Countries Chemical Injection Metering Pumps and Valves Industry Volume (Billion) Forecast, by Application 2020 & 2033
- Table 23: Australia and New Zealand Chemical Injection Metering Pumps and Valves Industry Revenue (Million) Forecast, by Application 2020 & 2033
- Table 24: Australia and New Zealand Chemical Injection Metering Pumps and Valves Industry Volume (Billion) Forecast, by Application 2020 & 2033
- Table 25: Rest of Asia Pacific Chemical Injection Metering Pumps and Valves Industry Revenue (Million) Forecast, by Application 2020 & 2033
- Table 26: Rest of Asia Pacific Chemical Injection Metering Pumps and Valves Industry Volume (Billion) Forecast, by Application 2020 & 2033
- Table 27: Global Chemical Injection Metering Pumps and Valves Industry Revenue Million Forecast, by Pump Type 2020 & 2033
- Table 28: Global Chemical Injection Metering Pumps and Valves Industry Volume Billion Forecast, by Pump Type 2020 & 2033
- Table 29: Global Chemical Injection Metering Pumps and Valves Industry Revenue Million Forecast, by End-user Industry 2020 & 2033
- Table 30: Global Chemical Injection Metering Pumps and Valves Industry Volume Billion Forecast, by End-user Industry 2020 & 2033
- Table 31: Global Chemical Injection Metering Pumps and Valves Industry Revenue Million Forecast, by Country 2020 & 2033
- Table 32: Global Chemical Injection Metering Pumps and Valves Industry Volume Billion Forecast, by Country 2020 & 2033
- Table 33: United States Chemical Injection Metering Pumps and Valves Industry Revenue (Million) Forecast, by Application 2020 & 2033
- Table 34: United States Chemical Injection Metering Pumps and Valves Industry Volume (Billion) Forecast, by Application 2020 & 2033
- Table 35: Canada Chemical Injection Metering Pumps and Valves Industry Revenue (Million) Forecast, by Application 2020 & 2033
- Table 36: Canada Chemical Injection Metering Pumps and Valves Industry Volume (Billion) Forecast, by Application 2020 & 2033
- Table 37: Mexico Chemical Injection Metering Pumps and Valves Industry Revenue (Million) Forecast, by Application 2020 & 2033
- Table 38: Mexico Chemical Injection Metering Pumps and Valves Industry Volume (Billion) Forecast, by Application 2020 & 2033
- Table 39: Global Chemical Injection Metering Pumps and Valves Industry Revenue Million Forecast, by Pump Type 2020 & 2033
- Table 40: Global Chemical Injection Metering Pumps and Valves Industry Volume Billion Forecast, by Pump Type 2020 & 2033
- Table 41: Global Chemical Injection Metering Pumps and Valves Industry Revenue Million Forecast, by End-user Industry 2020 & 2033
- Table 42: Global Chemical Injection Metering Pumps and Valves Industry Volume Billion Forecast, by End-user Industry 2020 & 2033
- Table 43: Global Chemical Injection Metering Pumps and Valves Industry Revenue Million Forecast, by Country 2020 & 2033
- Table 44: Global Chemical Injection Metering Pumps and Valves Industry Volume Billion Forecast, by Country 2020 & 2033
- Table 45: Germany Chemical Injection Metering Pumps and Valves Industry Revenue (Million) Forecast, by Application 2020 & 2033
- Table 46: Germany Chemical Injection Metering Pumps and Valves Industry Volume (Billion) Forecast, by Application 2020 & 2033
- Table 47: United Kingdom Chemical Injection Metering Pumps and Valves Industry Revenue (Million) Forecast, by Application 2020 & 2033
- Table 48: United Kingdom Chemical Injection Metering Pumps and Valves Industry Volume (Billion) Forecast, by Application 2020 & 2033
- Table 49: Italy Chemical Injection Metering Pumps and Valves Industry Revenue (Million) Forecast, by Application 2020 & 2033
- Table 50: Italy Chemical Injection Metering Pumps and Valves Industry Volume (Billion) Forecast, by Application 2020 & 2033
- Table 51: France Chemical Injection Metering Pumps and Valves Industry Revenue (Million) Forecast, by Application 2020 & 2033
- Table 52: France Chemical Injection Metering Pumps and Valves Industry Volume (Billion) Forecast, by Application 2020 & 2033
- Table 53: Russia Chemical Injection Metering Pumps and Valves Industry Revenue (Million) Forecast, by Application 2020 & 2033
- Table 54: Russia Chemical Injection Metering Pumps and Valves Industry Volume (Billion) Forecast, by Application 2020 & 2033
- Table 55: Spain Chemical Injection Metering Pumps and Valves Industry Revenue (Million) Forecast, by Application 2020 & 2033
- Table 56: Spain Chemical Injection Metering Pumps and Valves Industry Volume (Billion) Forecast, by Application 2020 & 2033
- Table 57: Rest of Europe Chemical Injection Metering Pumps and Valves Industry Revenue (Million) Forecast, by Application 2020 & 2033
- Table 58: Rest of Europe Chemical Injection Metering Pumps and Valves Industry Volume (Billion) Forecast, by Application 2020 & 2033
- Table 59: Global Chemical Injection Metering Pumps and Valves Industry Revenue Million Forecast, by Pump Type 2020 & 2033
- Table 60: Global Chemical Injection Metering Pumps and Valves Industry Volume Billion Forecast, by Pump Type 2020 & 2033
- Table 61: Global Chemical Injection Metering Pumps and Valves Industry Revenue Million Forecast, by End-user Industry 2020 & 2033
- Table 62: Global Chemical Injection Metering Pumps and Valves Industry Volume Billion Forecast, by End-user Industry 2020 & 2033
- Table 63: Global Chemical Injection Metering Pumps and Valves Industry Revenue Million Forecast, by Country 2020 & 2033
- Table 64: Global Chemical Injection Metering Pumps and Valves Industry Volume Billion Forecast, by Country 2020 & 2033
- Table 65: Brazil Chemical Injection Metering Pumps and Valves Industry Revenue (Million) Forecast, by Application 2020 & 2033
- Table 66: Brazil Chemical Injection Metering Pumps and Valves Industry Volume (Billion) Forecast, by Application 2020 & 2033
- Table 67: Argentina Chemical Injection Metering Pumps and Valves Industry Revenue (Million) Forecast, by Application 2020 & 2033
- Table 68: Argentina Chemical Injection Metering Pumps and Valves Industry Volume (Billion) Forecast, by Application 2020 & 2033
- Table 69: Rest of South America Chemical Injection Metering Pumps and Valves Industry Revenue (Million) Forecast, by Application 2020 & 2033
- Table 70: Rest of South America Chemical Injection Metering Pumps and Valves Industry Volume (Billion) Forecast, by Application 2020 & 2033
- Table 71: Global Chemical Injection Metering Pumps and Valves Industry Revenue Million Forecast, by Pump Type 2020 & 2033
- Table 72: Global Chemical Injection Metering Pumps and Valves Industry Volume Billion Forecast, by Pump Type 2020 & 2033
- Table 73: Global Chemical Injection Metering Pumps and Valves Industry Revenue Million Forecast, by End-user Industry 2020 & 2033
- Table 74: Global Chemical Injection Metering Pumps and Valves Industry Volume Billion Forecast, by End-user Industry 2020 & 2033
- Table 75: Global Chemical Injection Metering Pumps and Valves Industry Revenue Million Forecast, by Country 2020 & 2033
- Table 76: Global Chemical Injection Metering Pumps and Valves Industry Volume Billion Forecast, by Country 2020 & 2033
- Table 77: Saudi Arabia Chemical Injection Metering Pumps and Valves Industry Revenue (Million) Forecast, by Application 2020 & 2033
- Table 78: Saudi Arabia Chemical Injection Metering Pumps and Valves Industry Volume (Billion) Forecast, by Application 2020 & 2033
- Table 79: South Africa Chemical Injection Metering Pumps and Valves Industry Revenue (Million) Forecast, by Application 2020 & 2033
- Table 80: South Africa Chemical Injection Metering Pumps and Valves Industry Volume (Billion) Forecast, by Application 2020 & 2033
- Table 81: Rest of Middle East and Africa Chemical Injection Metering Pumps and Valves Industry Revenue (Million) Forecast, by Application 2020 & 2033
- Table 82: Rest of Middle East and Africa Chemical Injection Metering Pumps and Valves Industry Volume (Billion) Forecast, by Application 2020 & 2033
Frequently Asked Questions
1. What is the projected Compound Annual Growth Rate (CAGR) of the Chemical Injection Metering Pumps and Valves Industry?
The projected CAGR is approximately 2.79%.
2. Which companies are prominent players in the Chemical Injection Metering Pumps and Valves Industry?
Key companies in the market include Cameron (Schlumberger), Hunting PLC, Idex Corporation, ITC Dosing Pumps, Lewa GmbH, McFarland-Tritan LLC, Milton Roy, ProMinent, Seepex GmbH, Seko SpA, SkoFlo Industries Inc, SPX FLOW Inc, Swelore Engineering Pvt Ltd *List Not Exhaustive.
3. What are the main segments of the Chemical Injection Metering Pumps and Valves Industry?
The market segments include Pump Type, End-user Industry.
4. Can you provide details about the market size?
The market size is estimated to be USD 4.57 Million as of 2022.
5. What are some drivers contributing to market growth?
Accelerating Demand from Wastewater Treatment Applications; Robust Operational Procedures for Regulating Environmental Concerns; Other Drivers.
6. What are the notable trends driving market growth?
Energy. Power. and Chemicals to Dominate the Market.
7. Are there any restraints impacting market growth?
Accelerating Demand from Wastewater Treatment Applications; Robust Operational Procedures for Regulating Environmental Concerns; Other Drivers.
8. Can you provide examples of recent developments in the market?
9. What pricing options are available for accessing the report?
Pricing options include single-user, multi-user, and enterprise licenses priced at USD 4750, USD 5250, and USD 8750 respectively.
10. Is the market size provided in terms of value or volume?
The market size is provided in terms of value, measured in Million and volume, measured in Billion.
11. Are there any specific market keywords associated with the report?
Yes, the market keyword associated with the report is "Chemical Injection Metering Pumps and Valves Industry," which aids in identifying and referencing the specific market segment covered.
12. How do I determine which pricing option suits my needs best?
The pricing options vary based on user requirements and access needs. Individual users may opt for single-user licenses, while businesses requiring broader access may choose multi-user or enterprise licenses for cost-effective access to the report.
13. Are there any additional resources or data provided in the Chemical Injection Metering Pumps and Valves Industry report?
While the report offers comprehensive insights, it's advisable to review the specific contents or supplementary materials provided to ascertain if additional resources or data are available.
14. How can I stay updated on further developments or reports in the Chemical Injection Metering Pumps and Valves Industry?
To stay informed about further developments, trends, and reports in the Chemical Injection Metering Pumps and Valves Industry, consider subscribing to industry newsletters, following relevant companies and organizations, or regularly checking reputable industry news sources and publications.
Methodology
Step 1 - Identification of Relevant Samples Size from Population Database


Step 2 - Approaches for Defining Global Market Size (Value, Volume* & Price*)

Note*: In applicable scenarios
Step 3 - Data Sources
Primary Research
- Web Analytics
- Survey Reports
- Research Institute
- Latest Research Reports
- Opinion Leaders
Secondary Research
- Annual Reports
- White Paper
- Latest Press Release
- Industry Association
- Paid Database
- Investor Presentations

Step 4 - Data Triangulation
Involves using different sources of information in order to increase the validity of a study
These sources are likely to be stakeholders in a program - participants, other researchers, program staff, other community members, and so on.
Then we put all data in single framework & apply various statistical tools to find out the dynamic on the market.
During the analysis stage, feedback from the stakeholder groups would be compared to determine areas of agreement as well as areas of divergence

