
Key Insights
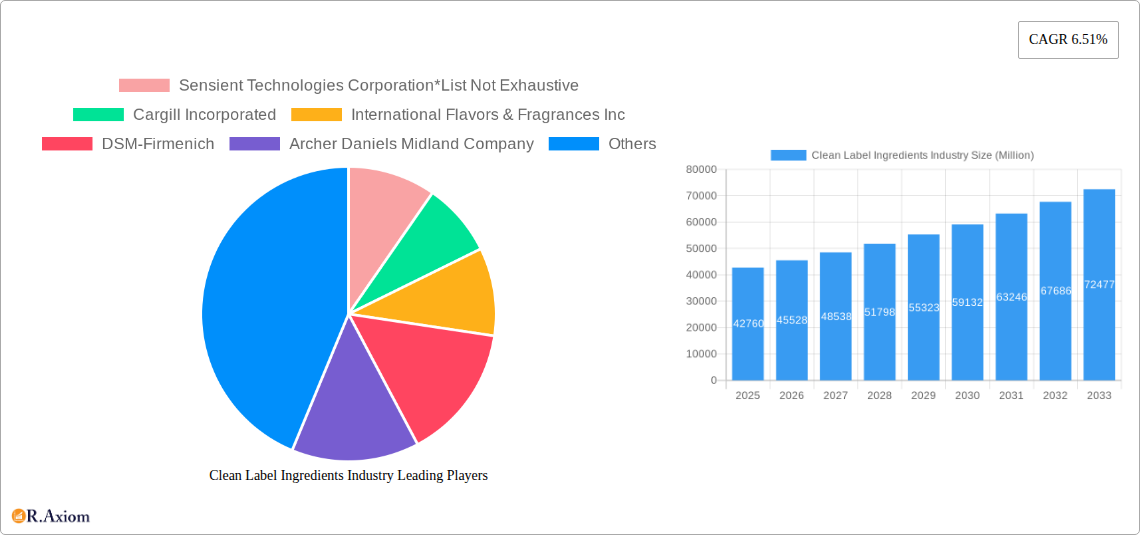
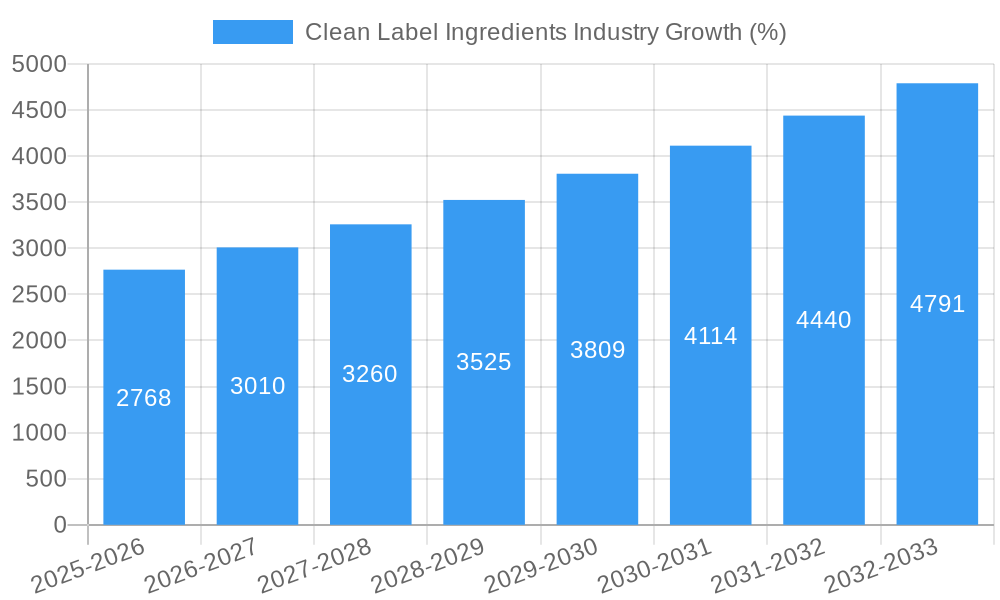
The clean label ingredients market, valued at $42.76 billion in 2025, is experiencing robust growth, projected to expand at a Compound Annual Growth Rate (CAGR) of 6.51% from 2025 to 2033. This surge is driven by increasing consumer demand for natural, minimally processed foods with transparent and easily understandable ingredient lists. Health-conscious consumers are actively seeking products free from artificial colors, flavors, preservatives, and high-fructose corn syrup, fueling the adoption of clean label ingredients across various food and beverage categories. The bakery and confectionery segment holds a significant market share, followed closely by dairy and frozen desserts, and beverages. Key players like Sensient Technologies, Cargill, and International Flavors & Fragrances are investing heavily in research and development to innovate and cater to this growing demand, offering a wide range of natural alternatives to traditional ingredients. The market's expansion is further propelled by stringent food safety regulations and the increasing awareness among manufacturers about the benefits of clean label products in enhancing brand reputation and consumer loyalty. Specific product categories such as food preservatives, sweeteners, and colorants are witnessing substantial growth, owing to the availability of natural and organic alternatives that provide comparable functionality without compromising on quality or taste. The Asia-Pacific region is expected to show significant growth potential, driven by rising disposable incomes and changing consumer preferences in countries like China and India. However, factors such as the relatively higher cost of clean label ingredients compared to conventional options could potentially hinder market growth to some extent.
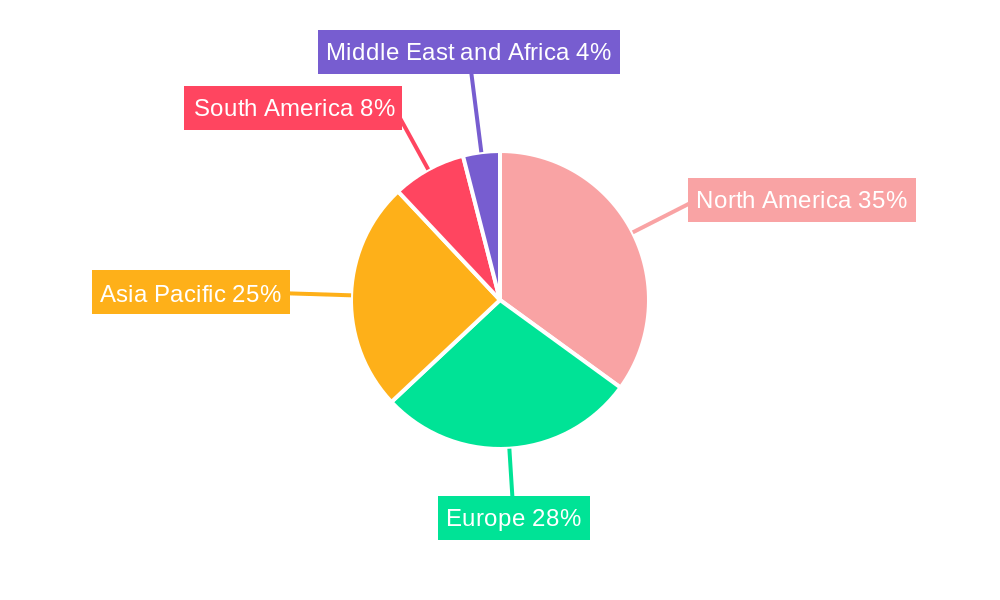
Geographic expansion continues to be a key strategy for major players, with a strong focus on emerging markets. The North American region currently dominates the market due to heightened consumer awareness and the presence of established players. However, the Asia-Pacific region is projected to experience rapid growth, driven by increasing disposable incomes and a burgeoning middle class seeking healthier food options. Europe follows closely behind with established regulatory frameworks encouraging clean label practices. The continued focus on product innovation and expansion into new applications will be critical to the future success of companies operating in this dynamic and expanding market. Further growth will be fueled by the increasing demand for plant-based alternatives and the growing popularity of functional foods.
Clean Label Ingredients Industry Market Report: 2019-2033
This comprehensive report provides an in-depth analysis of the Clean Label Ingredients industry, offering invaluable insights for stakeholders seeking to navigate this dynamic market. The report covers the period 2019-2033, with a focus on the forecast period 2025-2033 and a base year of 2025. The market is valued at xx Million in 2025 and is projected to reach xx Million by 2033, exhibiting a robust CAGR of xx%. This report analyzes key segments, including Food Preservatives, Food Sweeteners, Food Colorants, Food Hydrocolloids, Food Flavors and Enhancers, and other product types, across applications such as Bakery and Confectionery, Dairy and Frozen Desserts, Beverages, Meat and Meat Products, Sauces and Condiments, and other applications. Leading players like Sensient Technologies Corporation, Cargill Incorporated, International Flavors & Fragrances Inc, and others are profiled, providing a holistic view of the competitive landscape.
Clean Label Ingredients Industry Market Concentration & Innovation
The Clean Label Ingredients market exhibits a moderately concentrated structure, with several major players holding significant market share. While precise market share data for each company is proprietary, we estimate that the top 5 companies hold approximately xx% of the global market. The industry is characterized by intense competition, driving continuous innovation in product development and process optimization.
Innovation Drivers:
- Growing consumer demand for natural and minimally processed foods.
- Stringent regulatory frameworks promoting transparency and clean labeling.
- Technological advancements in ingredient extraction, processing, and formulation.
Regulatory Frameworks: Varying regulatory landscapes across different geographies significantly influence the market. Compliance with labeling standards and ingredient regulations is crucial for market entry and success.
Product Substitutes: The availability of substitutes, both natural and synthetic, presents competitive pressure and influences pricing strategies.
End-User Trends: Increasing health consciousness and a shift towards plant-based diets are key drivers of demand for clean label ingredients.
M&A Activities: The industry has witnessed several mergers and acquisitions in recent years, with deal values exceeding xx Million in some instances. These activities reflect strategic moves to expand product portfolios and geographical reach.
Clean Label Ingredients Industry Industry Trends & Insights
The Clean Label Ingredients market is experiencing significant growth, driven by several key factors. The rising global population, coupled with increasing disposable incomes, fuels demand for processed foods, which, in turn, increases the demand for clean label ingredients. The shift towards health-conscious lifestyles is further boosting the market. Consumer preference for natural, non-GMO, and organic ingredients is a major trend. Technological advancements such as precision fermentation and advanced extraction techniques are enabling the development of novel clean label ingredients. The competitive landscape is characterized by intense rivalry, with companies focusing on innovation, product diversification, and strategic partnerships to gain a competitive edge. The market is anticipated to experience a CAGR of xx% during the forecast period (2025-2033), with market penetration increasing steadily across various applications.
Dominant Markets & Segments in Clean Label Ingredients Industry
The North American market currently holds the dominant position in the Clean Label Ingredients industry. This dominance is attributable to several key factors:
- High consumer awareness and demand for clean label products.
- Stringent regulatory frameworks driving innovation.
- Robust food processing and manufacturing infrastructure.
- High disposable incomes and spending power.
Dominant Product Type: Food Flavors and Enhancers currently holds the largest market share within the product type segment. Its growth is driven by the increasing demand for healthier and more flavorful processed food items.
Dominant Application: The Bakery and Confectionery sector displays the highest demand for clean label ingredients due to the significant volume of processed foods in this category. Dairy and frozen desserts also constitute a sizeable application segment.
Clean Label Ingredients Industry Product Developments
Recent product developments focus on extending the shelf life of products while retaining natural attributes. Advancements in extraction techniques, for instance, enable the production of cleaner, more potent natural colorants and preservatives. Technological innovation in enzymes and fermentation processes allows for the creation of clean label alternatives to traditionally sourced ingredients. These improvements cater to consumer preferences and stricter regulations, strengthening competitiveness within the market.
Report Scope & Segmentation Analysis
This report segments the Clean Label Ingredients market based on product type (Food Preservatives, Food Sweeteners, Food Colorants, Food Hydrocolloids, Food Flavors and Enhancers, Other Product Types) and application (Bakery and Confectionery, Dairy and Frozen Desserts, Beverages, Meat and Meat Products, Sauces and Condiments, Other Applications). Each segment's growth projection, market size, and competitive dynamics are analyzed. For example, the Food Flavors and Enhancers segment is expected to experience significant growth due to increasing consumer demand for natural flavoring agents. Similarly, the Bakery and Confectionery application segment is projected to dominate due to the high consumption of baked goods and confectionery products globally.
Key Drivers of Clean Label Ingredients Industry Growth
The Clean Label Ingredients market is driven by several key factors:
- Growing consumer awareness: Consumers are increasingly aware of the ingredients in their food and are actively seeking cleaner, healthier options.
- Stringent regulations: Governments worldwide are implementing stricter regulations related to food labeling and ingredient safety, pushing manufacturers to adopt clean label practices.
- Technological advancements: Innovations in food processing and ingredient extraction are enabling the development of new and improved clean label products.
- Rise of the health and wellness industry: The increasing popularity of health and wellness trends fuels the demand for natural and organic ingredients.
Challenges in the Clean Label Ingredients Industry Sector
The Clean Label Ingredients industry faces several challenges:
- High production costs: The production of clean label ingredients can be more expensive than conventional alternatives, impacting profitability.
- Supply chain complexities: Ensuring the consistent supply of high-quality raw materials can be challenging, particularly for niche or sustainably sourced ingredients.
- Maintaining product stability: Clean label ingredients can sometimes be less stable than their conventional counterparts, requiring specialized formulation and packaging techniques.
Emerging Opportunities in Clean Label Ingredients Industry
Several opportunities exist for growth within the Clean Label Ingredients industry:
- Expansion into emerging markets: The rising middle class in developing countries presents significant growth potential for clean label products.
- Development of novel ingredients: Innovation in ingredient extraction and processing can lead to the development of entirely new clean label offerings.
- Strategic partnerships and collaborations: Collaborations between ingredient manufacturers and food companies can accelerate the development and adoption of clean label products.
Leading Players in the Clean Label Ingredients Industry Market
- Sensient Technologies Corporation
- Cargill Incorporated
- International Flavors & Fragrances Inc
- DSM-Firmenich
- Archer Daniels Midland Company
- Ajinomoto Co Inc
- Tate & Lyle PLC
- Kerry Group PLC
- Ingredion Incorporated
- Corbion NV
Key Developments in Clean Label Ingredients Industry Industry
- February 2024: Ajinomoto Co. opened a new office in Silicon Valley, expanding its reach in the US clean label ingredients market.
- October 2023: International Flavors & Fragrances Inc. launched Methanova, a plant-based methylcellulose for the biotechnology industry, highlighting innovation in bio-based ingredients.
- August 2022: Archer-Daniels-Midland Company partnered with New Culture, signifying the growing focus on sustainable and animal-free alternatives within the food industry.
Strategic Outlook for Clean Label Ingredients Industry Market
The Clean Label Ingredients market is poised for continued growth, driven by strong consumer demand, favorable regulatory changes, and ongoing technological advancements. The focus on sustainability and the exploration of novel ingredient sources will be key to future success. Companies that successfully adapt to these evolving trends and invest in research and development will be best positioned to capture significant market share in the coming years.
Clean Label Ingredients Industry Segmentation
-
1. Product Type
- 1.1. Food Preservatives
- 1.2. Food Sweeteners
- 1.3. Food Colorants
- 1.4. Food Hydrocolloids
- 1.5. Food Flavors and Enhancers
- 1.6. Other Product Types
-
2. Application
- 2.1. Bakery and Confectionery
- 2.2. Dairy and Frozen Desserts
- 2.3. Beverages
- 2.4. Meat and Meat Products
- 2.5. Sauces and Condiments
- 2.6. Other Applications
Clean Label Ingredients Industry Segmentation By Geography
-
1. North America
- 1.1. United States
- 1.2. Canada
- 1.3. Mexico
- 1.4. Rest of North America
-
2. Europe
- 2.1. United Kingdom
- 2.2. Germany
- 2.3. Spain
- 2.4. France
- 2.5. Italy
- 2.6. Russia
- 2.7. Rest of Europe
-
3. Asia Pacific
- 3.1. China
- 3.2. Japan
- 3.3. India
- 3.4. Australia
- 3.5. Rest of Asia Pacific
-
4. South America
- 4.1. Brazil
- 4.2. Argentina
- 4.3. Rest of South America
-
5. Middle East and Africa
- 5.1. South Africa
- 5.2. Saudi Arabia
- 5.3. Rest of Middle East and Africa
Clean Label Ingredients Industry REPORT HIGHLIGHTS
| Aspects | Details |
|---|---|
| Study Period | 2019-2033 |
| Base Year | 2024 |
| Estimated Year | 2025 |
| Forecast Period | 2025-2033 |
| Historical Period | 2019-2024 |
| Growth Rate | CAGR of 6.51% from 2019-2033 |
| Segmentation |
|
Table of Contents
- 1. Introduction
- 1.1. Research Scope
- 1.2. Market Segmentation
- 1.3. Research Methodology
- 1.4. Definitions and Assumptions
- 2. Executive Summary
- 2.1. Introduction
- 3. Market Dynamics
- 3.1. Introduction
- 3.2. Market Drivers
- 3.2.1. Increasing Health and Wellness Trends Fueling Market Growth; Rising Demand for Natural Ingredients
- 3.3. Market Restrains
- 3.3.1. High Cost Hampering Market Growth
- 3.4. Market Trends
- 3.4.1. Increasing Health and Wellness Trends Fueling Market Growth
- 4. Market Factor Analysis
- 4.1. Porters Five Forces
- 4.2. Supply/Value Chain
- 4.3. PESTEL analysis
- 4.4. Market Entropy
- 4.5. Patent/Trademark Analysis
- 5. Global Clean Label Ingredients Industry Analysis, Insights and Forecast, 2019-2031
- 5.1. Market Analysis, Insights and Forecast - by Product Type
- 5.1.1. Food Preservatives
- 5.1.2. Food Sweeteners
- 5.1.3. Food Colorants
- 5.1.4. Food Hydrocolloids
- 5.1.5. Food Flavors and Enhancers
- 5.1.6. Other Product Types
- 5.2. Market Analysis, Insights and Forecast - by Application
- 5.2.1. Bakery and Confectionery
- 5.2.2. Dairy and Frozen Desserts
- 5.2.3. Beverages
- 5.2.4. Meat and Meat Products
- 5.2.5. Sauces and Condiments
- 5.2.6. Other Applications
- 5.3. Market Analysis, Insights and Forecast - by Region
- 5.3.1. North America
- 5.3.2. Europe
- 5.3.3. Asia Pacific
- 5.3.4. South America
- 5.3.5. Middle East and Africa
- 5.1. Market Analysis, Insights and Forecast - by Product Type
- 6. North America Clean Label Ingredients Industry Analysis, Insights and Forecast, 2019-2031
- 6.1. Market Analysis, Insights and Forecast - by Product Type
- 6.1.1. Food Preservatives
- 6.1.2. Food Sweeteners
- 6.1.3. Food Colorants
- 6.1.4. Food Hydrocolloids
- 6.1.5. Food Flavors and Enhancers
- 6.1.6. Other Product Types
- 6.2. Market Analysis, Insights and Forecast - by Application
- 6.2.1. Bakery and Confectionery
- 6.2.2. Dairy and Frozen Desserts
- 6.2.3. Beverages
- 6.2.4. Meat and Meat Products
- 6.2.5. Sauces and Condiments
- 6.2.6. Other Applications
- 6.1. Market Analysis, Insights and Forecast - by Product Type
- 7. Europe Clean Label Ingredients Industry Analysis, Insights and Forecast, 2019-2031
- 7.1. Market Analysis, Insights and Forecast - by Product Type
- 7.1.1. Food Preservatives
- 7.1.2. Food Sweeteners
- 7.1.3. Food Colorants
- 7.1.4. Food Hydrocolloids
- 7.1.5. Food Flavors and Enhancers
- 7.1.6. Other Product Types
- 7.2. Market Analysis, Insights and Forecast - by Application
- 7.2.1. Bakery and Confectionery
- 7.2.2. Dairy and Frozen Desserts
- 7.2.3. Beverages
- 7.2.4. Meat and Meat Products
- 7.2.5. Sauces and Condiments
- 7.2.6. Other Applications
- 7.1. Market Analysis, Insights and Forecast - by Product Type
- 8. Asia Pacific Clean Label Ingredients Industry Analysis, Insights and Forecast, 2019-2031
- 8.1. Market Analysis, Insights and Forecast - by Product Type
- 8.1.1. Food Preservatives
- 8.1.2. Food Sweeteners
- 8.1.3. Food Colorants
- 8.1.4. Food Hydrocolloids
- 8.1.5. Food Flavors and Enhancers
- 8.1.6. Other Product Types
- 8.2. Market Analysis, Insights and Forecast - by Application
- 8.2.1. Bakery and Confectionery
- 8.2.2. Dairy and Frozen Desserts
- 8.2.3. Beverages
- 8.2.4. Meat and Meat Products
- 8.2.5. Sauces and Condiments
- 8.2.6. Other Applications
- 8.1. Market Analysis, Insights and Forecast - by Product Type
- 9. South America Clean Label Ingredients Industry Analysis, Insights and Forecast, 2019-2031
- 9.1. Market Analysis, Insights and Forecast - by Product Type
- 9.1.1. Food Preservatives
- 9.1.2. Food Sweeteners
- 9.1.3. Food Colorants
- 9.1.4. Food Hydrocolloids
- 9.1.5. Food Flavors and Enhancers
- 9.1.6. Other Product Types
- 9.2. Market Analysis, Insights and Forecast - by Application
- 9.2.1. Bakery and Confectionery
- 9.2.2. Dairy and Frozen Desserts
- 9.2.3. Beverages
- 9.2.4. Meat and Meat Products
- 9.2.5. Sauces and Condiments
- 9.2.6. Other Applications
- 9.1. Market Analysis, Insights and Forecast - by Product Type
- 10. Middle East and Africa Clean Label Ingredients Industry Analysis, Insights and Forecast, 2019-2031
- 10.1. Market Analysis, Insights and Forecast - by Product Type
- 10.1.1. Food Preservatives
- 10.1.2. Food Sweeteners
- 10.1.3. Food Colorants
- 10.1.4. Food Hydrocolloids
- 10.1.5. Food Flavors and Enhancers
- 10.1.6. Other Product Types
- 10.2. Market Analysis, Insights and Forecast - by Application
- 10.2.1. Bakery and Confectionery
- 10.2.2. Dairy and Frozen Desserts
- 10.2.3. Beverages
- 10.2.4. Meat and Meat Products
- 10.2.5. Sauces and Condiments
- 10.2.6. Other Applications
- 10.1. Market Analysis, Insights and Forecast - by Product Type
- 11. North America Clean Label Ingredients Industry Analysis, Insights and Forecast, 2019-2031
- 11.1. Market Analysis, Insights and Forecast - By Country/Sub-region
- 11.1.1 United States
- 11.1.2 Canada
- 11.1.3 Mexico
- 11.1.4 Rest of North America
- 12. Europe Clean Label Ingredients Industry Analysis, Insights and Forecast, 2019-2031
- 12.1. Market Analysis, Insights and Forecast - By Country/Sub-region
- 12.1.1 United Kingdom
- 12.1.2 Germany
- 12.1.3 Spain
- 12.1.4 France
- 12.1.5 Italy
- 12.1.6 Russia
- 12.1.7 Rest of Europe
- 13. Asia Pacific Clean Label Ingredients Industry Analysis, Insights and Forecast, 2019-2031
- 13.1. Market Analysis, Insights and Forecast - By Country/Sub-region
- 13.1.1 China
- 13.1.2 Japan
- 13.1.3 India
- 13.1.4 Australia
- 13.1.5 Rest of Asia Pacific
- 14. South America Clean Label Ingredients Industry Analysis, Insights and Forecast, 2019-2031
- 14.1. Market Analysis, Insights and Forecast - By Country/Sub-region
- 14.1.1 Brazil
- 14.1.2 Argentina
- 14.1.3 Rest of South America
- 15. Middle East and Africa Clean Label Ingredients Industry Analysis, Insights and Forecast, 2019-2031
- 15.1. Market Analysis, Insights and Forecast - By Country/Sub-region
- 15.1.1 South Africa
- 15.1.2 Saudi Arabia
- 15.1.3 Rest of Middle East and Africa
- 16. Competitive Analysis
- 16.1. Global Market Share Analysis 2024
- 16.2. Company Profiles
- 16.2.1 Sensient Technologies Corporation*List Not Exhaustive
- 16.2.1.1. Overview
- 16.2.1.2. Products
- 16.2.1.3. SWOT Analysis
- 16.2.1.4. Recent Developments
- 16.2.1.5. Financials (Based on Availability)
- 16.2.2 Cargill Incorporated
- 16.2.2.1. Overview
- 16.2.2.2. Products
- 16.2.2.3. SWOT Analysis
- 16.2.2.4. Recent Developments
- 16.2.2.5. Financials (Based on Availability)
- 16.2.3 International Flavors & Fragrances Inc
- 16.2.3.1. Overview
- 16.2.3.2. Products
- 16.2.3.3. SWOT Analysis
- 16.2.3.4. Recent Developments
- 16.2.3.5. Financials (Based on Availability)
- 16.2.4 DSM-Firmenich
- 16.2.4.1. Overview
- 16.2.4.2. Products
- 16.2.4.3. SWOT Analysis
- 16.2.4.4. Recent Developments
- 16.2.4.5. Financials (Based on Availability)
- 16.2.5 Archer Daniels Midland Company
- 16.2.5.1. Overview
- 16.2.5.2. Products
- 16.2.5.3. SWOT Analysis
- 16.2.5.4. Recent Developments
- 16.2.5.5. Financials (Based on Availability)
- 16.2.6 Ajinomoto Co Inc
- 16.2.6.1. Overview
- 16.2.6.2. Products
- 16.2.6.3. SWOT Analysis
- 16.2.6.4. Recent Developments
- 16.2.6.5. Financials (Based on Availability)
- 16.2.7 Tate & Lyle PLC
- 16.2.7.1. Overview
- 16.2.7.2. Products
- 16.2.7.3. SWOT Analysis
- 16.2.7.4. Recent Developments
- 16.2.7.5. Financials (Based on Availability)
- 16.2.8 Kerry Group PLC
- 16.2.8.1. Overview
- 16.2.8.2. Products
- 16.2.8.3. SWOT Analysis
- 16.2.8.4. Recent Developments
- 16.2.8.5. Financials (Based on Availability)
- 16.2.9 Ingredion Incorporated
- 16.2.9.1. Overview
- 16.2.9.2. Products
- 16.2.9.3. SWOT Analysis
- 16.2.9.4. Recent Developments
- 16.2.9.5. Financials (Based on Availability)
- 16.2.10 Corbion NV
- 16.2.10.1. Overview
- 16.2.10.2. Products
- 16.2.10.3. SWOT Analysis
- 16.2.10.4. Recent Developments
- 16.2.10.5. Financials (Based on Availability)
- 16.2.1 Sensient Technologies Corporation*List Not Exhaustive
List of Figures
- Figure 1: Global Clean Label Ingredients Industry Revenue Breakdown (Million, %) by Region 2024 & 2032
- Figure 2: North America Clean Label Ingredients Industry Revenue (Million), by Country 2024 & 2032
- Figure 3: North America Clean Label Ingredients Industry Revenue Share (%), by Country 2024 & 2032
- Figure 4: Europe Clean Label Ingredients Industry Revenue (Million), by Country 2024 & 2032
- Figure 5: Europe Clean Label Ingredients Industry Revenue Share (%), by Country 2024 & 2032
- Figure 6: Asia Pacific Clean Label Ingredients Industry Revenue (Million), by Country 2024 & 2032
- Figure 7: Asia Pacific Clean Label Ingredients Industry Revenue Share (%), by Country 2024 & 2032
- Figure 8: South America Clean Label Ingredients Industry Revenue (Million), by Country 2024 & 2032
- Figure 9: South America Clean Label Ingredients Industry Revenue Share (%), by Country 2024 & 2032
- Figure 10: Middle East and Africa Clean Label Ingredients Industry Revenue (Million), by Country 2024 & 2032
- Figure 11: Middle East and Africa Clean Label Ingredients Industry Revenue Share (%), by Country 2024 & 2032
- Figure 12: North America Clean Label Ingredients Industry Revenue (Million), by Product Type 2024 & 2032
- Figure 13: North America Clean Label Ingredients Industry Revenue Share (%), by Product Type 2024 & 2032
- Figure 14: North America Clean Label Ingredients Industry Revenue (Million), by Application 2024 & 2032
- Figure 15: North America Clean Label Ingredients Industry Revenue Share (%), by Application 2024 & 2032
- Figure 16: North America Clean Label Ingredients Industry Revenue (Million), by Country 2024 & 2032
- Figure 17: North America Clean Label Ingredients Industry Revenue Share (%), by Country 2024 & 2032
- Figure 18: Europe Clean Label Ingredients Industry Revenue (Million), by Product Type 2024 & 2032
- Figure 19: Europe Clean Label Ingredients Industry Revenue Share (%), by Product Type 2024 & 2032
- Figure 20: Europe Clean Label Ingredients Industry Revenue (Million), by Application 2024 & 2032
- Figure 21: Europe Clean Label Ingredients Industry Revenue Share (%), by Application 2024 & 2032
- Figure 22: Europe Clean Label Ingredients Industry Revenue (Million), by Country 2024 & 2032
- Figure 23: Europe Clean Label Ingredients Industry Revenue Share (%), by Country 2024 & 2032
- Figure 24: Asia Pacific Clean Label Ingredients Industry Revenue (Million), by Product Type 2024 & 2032
- Figure 25: Asia Pacific Clean Label Ingredients Industry Revenue Share (%), by Product Type 2024 & 2032
- Figure 26: Asia Pacific Clean Label Ingredients Industry Revenue (Million), by Application 2024 & 2032
- Figure 27: Asia Pacific Clean Label Ingredients Industry Revenue Share (%), by Application 2024 & 2032
- Figure 28: Asia Pacific Clean Label Ingredients Industry Revenue (Million), by Country 2024 & 2032
- Figure 29: Asia Pacific Clean Label Ingredients Industry Revenue Share (%), by Country 2024 & 2032
- Figure 30: South America Clean Label Ingredients Industry Revenue (Million), by Product Type 2024 & 2032
- Figure 31: South America Clean Label Ingredients Industry Revenue Share (%), by Product Type 2024 & 2032
- Figure 32: South America Clean Label Ingredients Industry Revenue (Million), by Application 2024 & 2032
- Figure 33: South America Clean Label Ingredients Industry Revenue Share (%), by Application 2024 & 2032
- Figure 34: South America Clean Label Ingredients Industry Revenue (Million), by Country 2024 & 2032
- Figure 35: South America Clean Label Ingredients Industry Revenue Share (%), by Country 2024 & 2032
- Figure 36: Middle East and Africa Clean Label Ingredients Industry Revenue (Million), by Product Type 2024 & 2032
- Figure 37: Middle East and Africa Clean Label Ingredients Industry Revenue Share (%), by Product Type 2024 & 2032
- Figure 38: Middle East and Africa Clean Label Ingredients Industry Revenue (Million), by Application 2024 & 2032
- Figure 39: Middle East and Africa Clean Label Ingredients Industry Revenue Share (%), by Application 2024 & 2032
- Figure 40: Middle East and Africa Clean Label Ingredients Industry Revenue (Million), by Country 2024 & 2032
- Figure 41: Middle East and Africa Clean Label Ingredients Industry Revenue Share (%), by Country 2024 & 2032
List of Tables
- Table 1: Global Clean Label Ingredients Industry Revenue Million Forecast, by Region 2019 & 2032
- Table 2: Global Clean Label Ingredients Industry Revenue Million Forecast, by Product Type 2019 & 2032
- Table 3: Global Clean Label Ingredients Industry Revenue Million Forecast, by Application 2019 & 2032
- Table 4: Global Clean Label Ingredients Industry Revenue Million Forecast, by Region 2019 & 2032
- Table 5: Global Clean Label Ingredients Industry Revenue Million Forecast, by Country 2019 & 2032
- Table 6: United States Clean Label Ingredients Industry Revenue (Million) Forecast, by Application 2019 & 2032
- Table 7: Canada Clean Label Ingredients Industry Revenue (Million) Forecast, by Application 2019 & 2032
- Table 8: Mexico Clean Label Ingredients Industry Revenue (Million) Forecast, by Application 2019 & 2032
- Table 9: Rest of North America Clean Label Ingredients Industry Revenue (Million) Forecast, by Application 2019 & 2032
- Table 10: Global Clean Label Ingredients Industry Revenue Million Forecast, by Country 2019 & 2032
- Table 11: United Kingdom Clean Label Ingredients Industry Revenue (Million) Forecast, by Application 2019 & 2032
- Table 12: Germany Clean Label Ingredients Industry Revenue (Million) Forecast, by Application 2019 & 2032
- Table 13: Spain Clean Label Ingredients Industry Revenue (Million) Forecast, by Application 2019 & 2032
- Table 14: France Clean Label Ingredients Industry Revenue (Million) Forecast, by Application 2019 & 2032
- Table 15: Italy Clean Label Ingredients Industry Revenue (Million) Forecast, by Application 2019 & 2032
- Table 16: Russia Clean Label Ingredients Industry Revenue (Million) Forecast, by Application 2019 & 2032
- Table 17: Rest of Europe Clean Label Ingredients Industry Revenue (Million) Forecast, by Application 2019 & 2032
- Table 18: Global Clean Label Ingredients Industry Revenue Million Forecast, by Country 2019 & 2032
- Table 19: China Clean Label Ingredients Industry Revenue (Million) Forecast, by Application 2019 & 2032
- Table 20: Japan Clean Label Ingredients Industry Revenue (Million) Forecast, by Application 2019 & 2032
- Table 21: India Clean Label Ingredients Industry Revenue (Million) Forecast, by Application 2019 & 2032
- Table 22: Australia Clean Label Ingredients Industry Revenue (Million) Forecast, by Application 2019 & 2032
- Table 23: Rest of Asia Pacific Clean Label Ingredients Industry Revenue (Million) Forecast, by Application 2019 & 2032
- Table 24: Global Clean Label Ingredients Industry Revenue Million Forecast, by Country 2019 & 2032
- Table 25: Brazil Clean Label Ingredients Industry Revenue (Million) Forecast, by Application 2019 & 2032
- Table 26: Argentina Clean Label Ingredients Industry Revenue (Million) Forecast, by Application 2019 & 2032
- Table 27: Rest of South America Clean Label Ingredients Industry Revenue (Million) Forecast, by Application 2019 & 2032
- Table 28: Global Clean Label Ingredients Industry Revenue Million Forecast, by Country 2019 & 2032
- Table 29: South Africa Clean Label Ingredients Industry Revenue (Million) Forecast, by Application 2019 & 2032
- Table 30: Saudi Arabia Clean Label Ingredients Industry Revenue (Million) Forecast, by Application 2019 & 2032
- Table 31: Rest of Middle East and Africa Clean Label Ingredients Industry Revenue (Million) Forecast, by Application 2019 & 2032
- Table 32: Global Clean Label Ingredients Industry Revenue Million Forecast, by Product Type 2019 & 2032
- Table 33: Global Clean Label Ingredients Industry Revenue Million Forecast, by Application 2019 & 2032
- Table 34: Global Clean Label Ingredients Industry Revenue Million Forecast, by Country 2019 & 2032
- Table 35: United States Clean Label Ingredients Industry Revenue (Million) Forecast, by Application 2019 & 2032
- Table 36: Canada Clean Label Ingredients Industry Revenue (Million) Forecast, by Application 2019 & 2032
- Table 37: Mexico Clean Label Ingredients Industry Revenue (Million) Forecast, by Application 2019 & 2032
- Table 38: Rest of North America Clean Label Ingredients Industry Revenue (Million) Forecast, by Application 2019 & 2032
- Table 39: Global Clean Label Ingredients Industry Revenue Million Forecast, by Product Type 2019 & 2032
- Table 40: Global Clean Label Ingredients Industry Revenue Million Forecast, by Application 2019 & 2032
- Table 41: Global Clean Label Ingredients Industry Revenue Million Forecast, by Country 2019 & 2032
- Table 42: United Kingdom Clean Label Ingredients Industry Revenue (Million) Forecast, by Application 2019 & 2032
- Table 43: Germany Clean Label Ingredients Industry Revenue (Million) Forecast, by Application 2019 & 2032
- Table 44: Spain Clean Label Ingredients Industry Revenue (Million) Forecast, by Application 2019 & 2032
- Table 45: France Clean Label Ingredients Industry Revenue (Million) Forecast, by Application 2019 & 2032
- Table 46: Italy Clean Label Ingredients Industry Revenue (Million) Forecast, by Application 2019 & 2032
- Table 47: Russia Clean Label Ingredients Industry Revenue (Million) Forecast, by Application 2019 & 2032
- Table 48: Rest of Europe Clean Label Ingredients Industry Revenue (Million) Forecast, by Application 2019 & 2032
- Table 49: Global Clean Label Ingredients Industry Revenue Million Forecast, by Product Type 2019 & 2032
- Table 50: Global Clean Label Ingredients Industry Revenue Million Forecast, by Application 2019 & 2032
- Table 51: Global Clean Label Ingredients Industry Revenue Million Forecast, by Country 2019 & 2032
- Table 52: China Clean Label Ingredients Industry Revenue (Million) Forecast, by Application 2019 & 2032
- Table 53: Japan Clean Label Ingredients Industry Revenue (Million) Forecast, by Application 2019 & 2032
- Table 54: India Clean Label Ingredients Industry Revenue (Million) Forecast, by Application 2019 & 2032
- Table 55: Australia Clean Label Ingredients Industry Revenue (Million) Forecast, by Application 2019 & 2032
- Table 56: Rest of Asia Pacific Clean Label Ingredients Industry Revenue (Million) Forecast, by Application 2019 & 2032
- Table 57: Global Clean Label Ingredients Industry Revenue Million Forecast, by Product Type 2019 & 2032
- Table 58: Global Clean Label Ingredients Industry Revenue Million Forecast, by Application 2019 & 2032
- Table 59: Global Clean Label Ingredients Industry Revenue Million Forecast, by Country 2019 & 2032
- Table 60: Brazil Clean Label Ingredients Industry Revenue (Million) Forecast, by Application 2019 & 2032
- Table 61: Argentina Clean Label Ingredients Industry Revenue (Million) Forecast, by Application 2019 & 2032
- Table 62: Rest of South America Clean Label Ingredients Industry Revenue (Million) Forecast, by Application 2019 & 2032
- Table 63: Global Clean Label Ingredients Industry Revenue Million Forecast, by Product Type 2019 & 2032
- Table 64: Global Clean Label Ingredients Industry Revenue Million Forecast, by Application 2019 & 2032
- Table 65: Global Clean Label Ingredients Industry Revenue Million Forecast, by Country 2019 & 2032
- Table 66: South Africa Clean Label Ingredients Industry Revenue (Million) Forecast, by Application 2019 & 2032
- Table 67: Saudi Arabia Clean Label Ingredients Industry Revenue (Million) Forecast, by Application 2019 & 2032
- Table 68: Rest of Middle East and Africa Clean Label Ingredients Industry Revenue (Million) Forecast, by Application 2019 & 2032
Frequently Asked Questions
1. What is the projected Compound Annual Growth Rate (CAGR) of the Clean Label Ingredients Industry?
The projected CAGR is approximately 6.51%.
2. Which companies are prominent players in the Clean Label Ingredients Industry?
Key companies in the market include Sensient Technologies Corporation*List Not Exhaustive, Cargill Incorporated, International Flavors & Fragrances Inc, DSM-Firmenich, Archer Daniels Midland Company, Ajinomoto Co Inc, Tate & Lyle PLC, Kerry Group PLC, Ingredion Incorporated, Corbion NV.
3. What are the main segments of the Clean Label Ingredients Industry?
The market segments include Product Type, Application.
4. Can you provide details about the market size?
The market size is estimated to be USD 42.76 Million as of 2022.
5. What are some drivers contributing to market growth?
Increasing Health and Wellness Trends Fueling Market Growth; Rising Demand for Natural Ingredients.
6. What are the notable trends driving market growth?
Increasing Health and Wellness Trends Fueling Market Growth.
7. Are there any restraints impacting market growth?
High Cost Hampering Market Growth.
8. Can you provide examples of recent developments in the market?
February 2024: Ajinomoto Co. opened a new office in Silicon Valley, United States. The office provides different types of food solutions, including clean label ingredients in the US market. The purpose of this expansion was to expand the company’s business.
9. What pricing options are available for accessing the report?
Pricing options include single-user, multi-user, and enterprise licenses priced at USD 4750, USD 5250, and USD 8750 respectively.
10. Is the market size provided in terms of value or volume?
The market size is provided in terms of value, measured in Million.
11. Are there any specific market keywords associated with the report?
Yes, the market keyword associated with the report is "Clean Label Ingredients Industry," which aids in identifying and referencing the specific market segment covered.
12. How do I determine which pricing option suits my needs best?
The pricing options vary based on user requirements and access needs. Individual users may opt for single-user licenses, while businesses requiring broader access may choose multi-user or enterprise licenses for cost-effective access to the report.
13. Are there any additional resources or data provided in the Clean Label Ingredients Industry report?
While the report offers comprehensive insights, it's advisable to review the specific contents or supplementary materials provided to ascertain if additional resources or data are available.
14. How can I stay updated on further developments or reports in the Clean Label Ingredients Industry?
To stay informed about further developments, trends, and reports in the Clean Label Ingredients Industry, consider subscribing to industry newsletters, following relevant companies and organizations, or regularly checking reputable industry news sources and publications.
Methodology
Step 1 - Identification of Relevant Samples Size from Population Database


Step 2 - Approaches for Defining Global Market Size (Value, Volume* & Price*)

Note*: In applicable scenarios
Step 3 - Data Sources
Primary Research
- Web Analytics
- Survey Reports
- Research Institute
- Latest Research Reports
- Opinion Leaders
Secondary Research
- Annual Reports
- White Paper
- Latest Press Release
- Industry Association
- Paid Database
- Investor Presentations

Step 4 - Data Triangulation
Involves using different sources of information in order to increase the validity of a study
These sources are likely to be stakeholders in a program - participants, other researchers, program staff, other community members, and so on.
Then we put all data in single framework & apply various statistical tools to find out the dynamic on the market.
During the analysis stage, feedback from the stakeholder groups would be compared to determine areas of agreement as well as areas of divergence


