

Key Insights
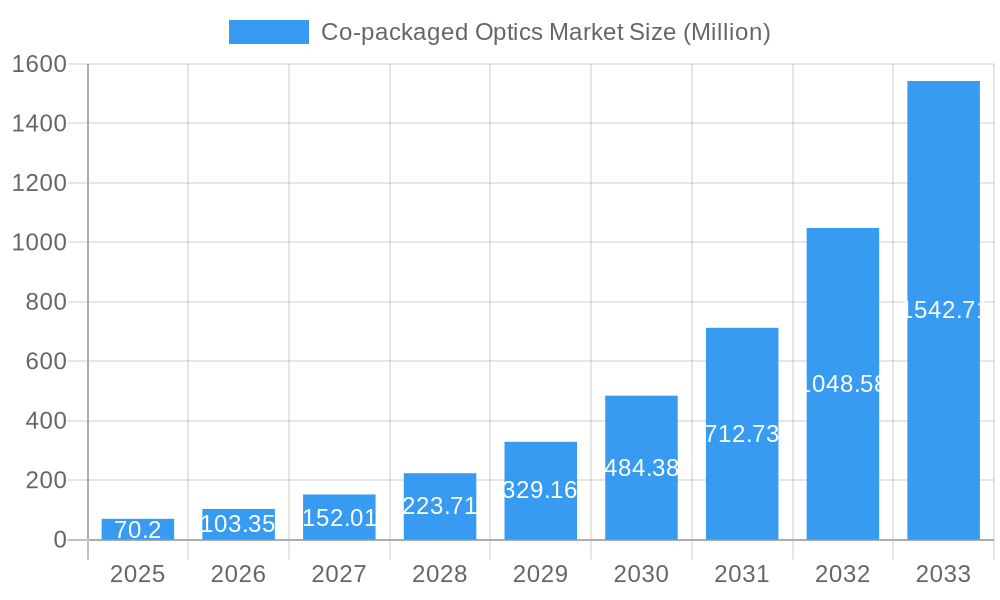
The Co-Packaged Optics (CPO) market is poised for explosive growth, driven by the relentless demand for higher bandwidth and improved energy efficiency in data centers and high-performance computing. With a market size of $70.20 million in the base year of 2025, the sector is projected to witness an astounding CAGR of 47.12% during the forecast period of 2025-2033. This remarkable expansion is fueled by critical drivers such as the proliferation of AI and machine learning workloads, the increasing adoption of 5G networks, and the continuous need for faster data transfer rates in cloud computing and enterprise networks. The limitations of traditional pluggable optical modules in meeting these escalating demands are pushing the industry towards integrated solutions like CPO, which offer significant advantages in terms of power consumption, latency reduction, and form factor optimization.
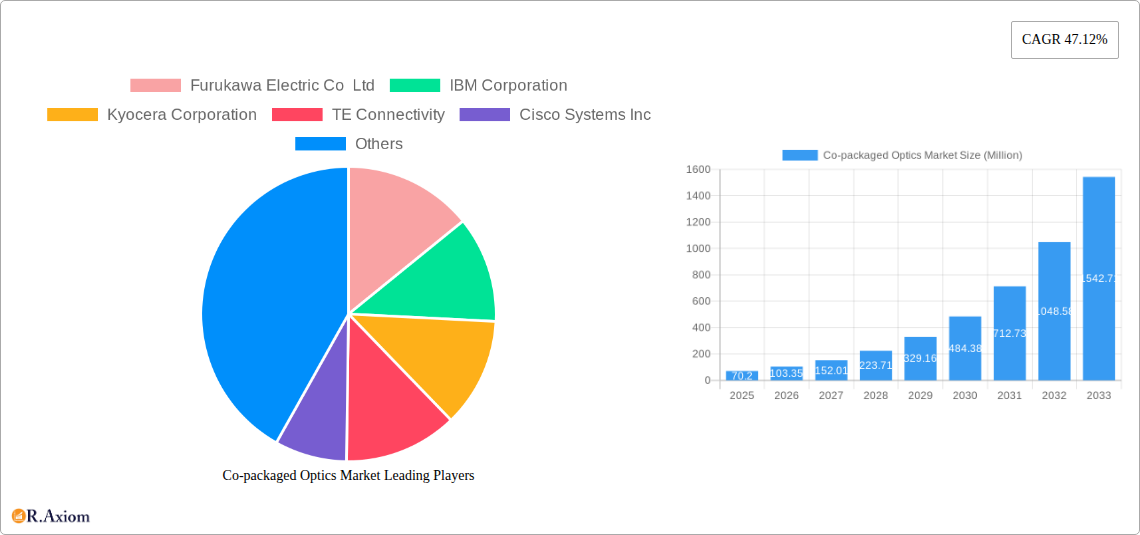
Co-packaged Optics Market Market Size (In Million)
The market is segmented by data rates, with demand expected to be particularly strong for 3.2 T and 6.4 T solutions as data centers evolve to handle increasingly complex computations and massive data flows. While specific regional market share figures were not provided, it is logical to infer that North America and Asia, with their significant investments in data center infrastructure and technological innovation, will likely dominate the market landscape. The immense growth trajectory is, however, not without its challenges. Restraints such as the high initial development and manufacturing costs, the need for standardization, and the integration complexities with existing infrastructure could temper the pace of adoption. Nevertheless, the transformative potential of CPO in enabling next-generation computing and communication systems is undeniable, making it a focal point for major industry players like IBM, Cisco, Broadcom, and Intel, as well as specialized innovators like Ayar Labs and POET Technologies.
Co-packaged Optics Market Company Market Share
This comprehensive report offers an in-depth analysis of the Co-packaged Optics (CPO) market, a pivotal technology enabling unprecedented data transmission speeds and efficiency. Catering to the escalating demands of AI infrastructure, data centers, high-performance computing (HPC), and telecommunications, this study provides critical insights for stakeholders navigating this rapidly evolving landscape. The report covers a detailed market analysis from 2019 to 2033, with a base year of 2025 and a forecast period of 2025–2033, encompassing historical data from 2019–2024. We explore key segments including data rates of Less than 1.6 T, 3.2 T, and 6.4 T, offering actionable intelligence on market dynamics, growth drivers, and future opportunities.
Co-packaged Optics Market Market Concentration & Innovation
The Co-packaged Optics market is characterized by a moderate to high degree of concentration, driven by significant R&D investments and the need for advanced manufacturing capabilities. Key players are investing heavily in innovation to overcome technical hurdles and meet the surging demand for higher bandwidth solutions. The market is experiencing a surge in innovation, particularly in the development of integrated silicon photonics technologies that reduce power consumption and increase data transfer rates. Regulatory frameworks are largely focused on standardization and interoperability to facilitate widespread adoption. Product substitutes, such as traditional pluggable optics, are increasingly being challenged by CPO's superior performance and efficiency, especially in demanding applications. End-user trends clearly indicate a strong preference for solutions that offer lower latency, higher bandwidth density, and improved power efficiency, directly aligning with CPO's core benefits. Merger and acquisition (M&A) activities, while not extensively disclosed, are anticipated to increase as larger technology firms seek to acquire specialized CPO expertise and intellectual property. Specific M&A deal values are not publicly available but are estimated to be in the hundreds of millions of dollars for significant acquisitions. Market share is gradually shifting towards CPO solutions as deployment accelerates.
Co-packaged Optics Market Industry Trends & Insights
The Co-packaged Optics market is experiencing explosive growth, driven by the insatiable demand for bandwidth generated by artificial intelligence (AI) workloads, hyperscale data centers, and the continuous evolution of high-performance computing. The integration of optical interconnects directly onto or within processor packages is revolutionizing data transmission, offering significant advantages over traditional electrical interconnects. This technological shift is paramount in overcoming the power and performance bottlenecks that limit current networking infrastructure. The CAGR for the CPO market is projected to be robust, estimated at over 25% during the forecast period, reflecting the rapid adoption of these advanced solutions. Market penetration is steadily increasing, particularly in enterprise and hyperscale data centers where the need for high-speed, low-power interconnects is most acute. Technological disruptions, such as the development of highly integrated silicon photonics chips and advanced laser integration, are continuously pushing the boundaries of what's possible in optical communication. Consumer preferences are evolving to demand more efficient and powerful computing and networking capabilities, with CPO directly addressing these needs by enabling higher data rates within smaller footprints and with reduced energy consumption. The competitive dynamics are intense, with major semiconductor and networking equipment manufacturers vying for leadership through strategic partnerships, acquisitions, and in-house R&D. The increasing sophistication of AI models, the exponential growth of data generation, and the ongoing digital transformation across industries are all powerful market growth drivers that position CPO as a critical enabler for future technological advancements. The trend towards disaggregation in data center architectures also favors CPO solutions, allowing for more flexible and scalable designs. The integration of AI and machine learning at the network edge will further necessitate the capabilities offered by CPO.
Dominant Markets & Segments in Co-packaged Optics Market
The Co-packaged Optics market is experiencing significant dominance from North America, particularly the United States, which is at the forefront of AI development and hyperscale data center expansion. This region benefits from strong government initiatives supporting technological innovation, substantial venture capital investment in cutting-edge semiconductor and networking technologies, and the presence of major technology giants driving demand for advanced interconnect solutions. Key drivers for this dominance include robust economic policies fostering R&D, extensive investments in digital infrastructure, and a high concentration of AI research and development centers.
Data Rates:
- 3.2 T: This data rate segment is currently experiencing significant traction and is anticipated to be a dominant segment within the forecast period.
- Key Drivers: The increasing demand for higher bandwidth in AI training and inference applications, coupled with the need for more efficient inter-chip communication within high-performance servers.
- Dominance Analysis: Servers and switches designed for AI workloads are increasingly adopting 3.2 T capabilities, making this segment a focal point for innovation and deployment. The maturity of manufacturing processes for 3.2 T components also contributes to its current strength.
- 6.4 T: This segment represents the next frontier in CPO technology and is poised for substantial growth as applications mature and demand continues to escalate.
- Key Drivers: Future-proofing data center infrastructure against ever-increasing data demands, enabling next-generation AI models, and supporting the expansion of edge computing and advanced telecommunications.
- Dominance Analysis: While still in its nascent stages of widespread adoption, the 6.4 T segment is a critical area of investment and development, with leading players aiming to establish early market leadership. Its dominance will likely be realized in the later years of the forecast period.
- Less than 1.6 T: This segment, while foundational, is gradually being superseded by higher data rate solutions as the market matures.
- Key Drivers: Legacy systems and applications that do not yet require the highest bandwidth capabilities.
- Dominance Analysis: This segment will likely see a decline in market share relative to higher data rate segments but will continue to serve specific niche applications and existing infrastructure.
The Asia-Pacific region, particularly China, is also emerging as a significant market due to substantial investments in data center infrastructure and the rapid growth of its domestic technology sector, including telecommunications and AI. Europe, with its focus on industrial digitalization and research initiatives, also contributes to the overall market growth.
Co-packaged Optics Market Product Developments
Product developments in the Co-packaged Optics market are centered on enhancing integration, speed, and efficiency. Innovations focus on embedding optical engines closer to compute and memory components, leading to dramatic reductions in power consumption and latency. Advancements in silicon photonics, such as Intel's recent development of a 4 Tbps bidirectional OCI chiplet, showcase the potential for highly integrated solutions with on-chip lasers and re-usable optical connectors. These advancements are crucial for addressing the bandwidth demands of AI infrastructure and enabling future scalability. The competitive advantage lies in achieving higher bandwidth density, lower power per bit, and smaller form factors, directly supporting the evolution of data centers and HPC systems.
Report Scope & Segmentation Analysis
This report meticulously analyzes the Co-packaged Optics market, segmented by crucial data rates that define its technological progression and application scope. The segmentation is designed to provide granular insights into market dynamics and growth projections.
- Less than 1.6 T: This segment encompasses current and foundational CPO solutions. While representing a mature market, it continues to serve specific applications where extreme bandwidth is not the primary requirement. Growth projections for this segment are moderate, with a focus on maintaining market share in existing deployments.
- 3.2 T: This segment is a key growth engine for the CPO market, driven by its suitability for high-performance computing, AI accelerators, and demanding data center interconnects. Market sizes for this segment are expanding rapidly, with significant competitive dynamics emerging as vendors introduce advanced 3.2 T CPO modules.
- 6.4 T: Representing the cutting edge of CPO technology, the 6.4 T segment is projected for exponential growth during the forecast period. This segment targets future-proof infrastructure, advanced AI models, and next-generation networking. Market sizes are currently smaller but are expected to surge as technology matures and adoption accelerates, indicating intense competitive interest.
Key Drivers of Co-packaged Optics Market Growth
The Co-packaged Optics market is propelled by a confluence of powerful growth drivers. Foremost is the insatiable demand for bandwidth fueled by artificial intelligence (AI) and machine learning (ML) workloads, which require increasingly faster and more efficient data transfer between processors, memory, and network interfaces. The rapid expansion of hyperscale data centers, driven by cloud computing and Big Data analytics, necessitates solutions that can handle massive data volumes with optimal power efficiency. Technological advancements in silicon photonics are a critical enabler, allowing for the miniaturization and integration of optical components, thereby reducing power consumption and latency. Furthermore, the need for greater energy efficiency in data centers, driven by environmental concerns and operational cost reduction, strongly favors CPO solutions over traditional interconnects. Government initiatives and investments in digital infrastructure and R&D also play a significant role in fostering market growth.
Challenges in the Co-packaged Optics Market Sector
Despite its immense potential, the Co-packaged Optics market faces several significant challenges that could impede its widespread adoption. High manufacturing costs associated with advanced silicon photonics and complex integration processes remain a primary barrier, making CPO solutions more expensive than traditional pluggable optics in the short term. Technical complexity in design, testing, and thermal management presents ongoing hurdles for widespread deployment. Supply chain disruptions and the need for specialized manufacturing capabilities can lead to production bottlenecks and longer lead times. Moreover, ensuring interoperability and standardization across different vendors' CPO solutions is crucial for broader market acceptance. Competitive pressures from advanced pluggable optics and ongoing advancements in electrical interconnect technologies also pose a challenge.
Emerging Opportunities in Co-packaged Optics Market
The Co-packaged Optics market is ripe with emerging opportunities driven by technological innovation and evolving market demands. The burgeoning field of AI computing, especially the development of larger and more complex AI models, presents a substantial opportunity for CPO to provide the necessary bandwidth and low latency. The increasing demand for edge computing solutions, which require high-performance processing and connectivity in distributed environments, also opens new avenues for CPO adoption. Furthermore, the integration of CPO in next-generation telecommunications infrastructure, such as 5G and future 6G networks, offers significant growth potential. The development of novel materials and advanced packaging techniques promises further improvements in performance and cost-effectiveness, creating opportunities for new product designs and specialized applications. The push for greater energy efficiency in all aspects of computing will continue to favor CPO's inherent advantages.
Leading Players in the Co-packaged Optics Market Market
- Furukawa Electric Co Ltd
- IBM Corporation
- Kyocera Corporation
- TE Connectivity
- Cisco Systems Inc
- Broadcom Inc
- Microsoft Corporation
- Ayar Labs Inc
- Huawei Technologies Co Ltd
- SENKO Advanced Components Inc
- Hisense Broadband Multimedia Technology Co Ltd
- Sumitomo Electric Industries Lt
- Intel Corporation
- POET Technologies
Key Developments in Co-packaged Optics Market Industry
- March 2024: Intel developed a 4 Tbps bidirectional fully integrated OCI chiplet based on Intel’s in-house silicon photonics technology. This chiplet, or tile, contains a single silicon photonics integrated circuit (PIC) with integrated lasers, an electrical IC (EIC), and a path to incorporate a detachable/re-usable optical connector. The purpose of this development is to address the AI infrastructure’s significant need for bandwidth and to enable future scalability.
- September 2023: TSMC collaborated with Broadcom and Nvidia to develop silicon photonics and co-packaged optics (CPO) following increased demand for data transmission due to the AI trend, as reported exclusively by local media outlet Economic Daily News. The company has already assembled an R&D team of over 200 employees to focus on emerging opportunities in high-speed computing chips based on silicon photonics technology. Production was expected to commence as early as the second half of this year. TSMC declined to comment on this matter.
Strategic Outlook for Co-packaged Optics Market Market
The strategic outlook for the Co-packaged Optics market is exceptionally bright, poised for sustained and significant growth. The fundamental driver remains the relentless demand for higher bandwidth and lower power consumption, directly addressed by CPO technology. As AI applications become more sophisticated and data center architectures evolve towards greater density and efficiency, CPO will transition from an emerging technology to a mainstream solution. Strategic investments in R&D by leading technology firms, coupled with the ongoing maturation of silicon photonics manufacturing processes, will reduce costs and improve performance, accelerating adoption. Partnerships and collaborations across the ecosystem, from component manufacturers to system integrators, will be crucial for overcoming technical challenges and establishing industry standards. The market is expected to see continued innovation in areas such as advanced cooling solutions for integrated optics and novel architectures that leverage CPO's capabilities to their fullest potential, ensuring its strategic importance in enabling future technological advancements.
Co-packaged Optics Market Segmentation
-
1. Data Rates
- 1.1. Less than 1.6 T
- 1.2. 3.2 T
- 1.3. 6.4 T
Co-packaged Optics Market Segmentation By Geography
- 1. North America
- 2. Europe
- 3. Asia
- 4. Australia and New Zealand
- 5. Latin America
- 6. Middle East and Africa
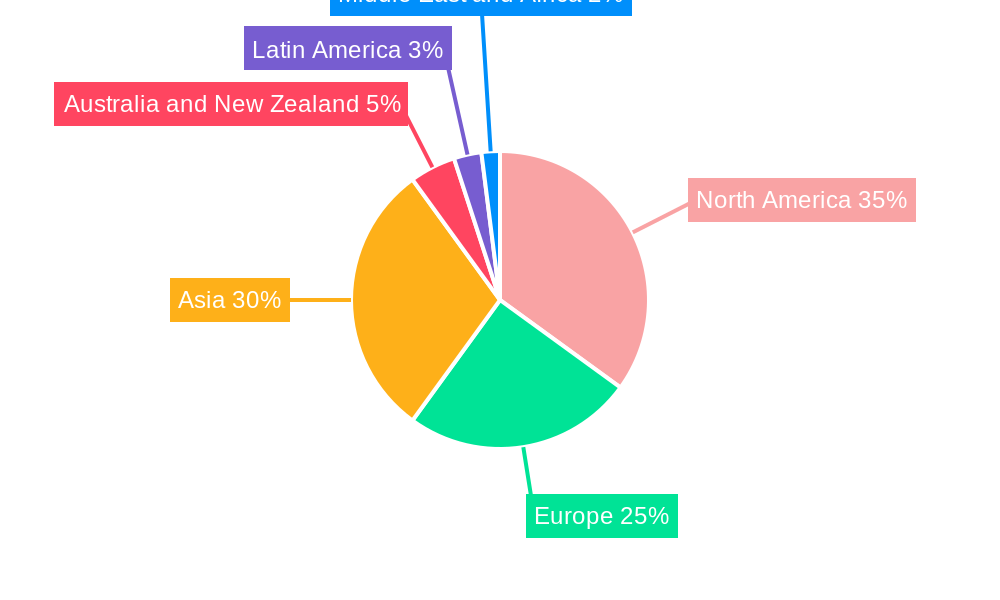
Co-packaged Optics Market Regional Market Share
Geographic Coverage of Co-packaged Optics Market
Co-packaged Optics Market REPORT HIGHLIGHTS
| Aspects | Details |
|---|---|
| Study Period | 2020-2034 |
| Base Year | 2025 |
| Estimated Year | 2026 |
| Forecast Period | 2026-2034 |
| Historical Period | 2020-2025 |
| Growth Rate | CAGR of 47.12% from 2020-2034 |
| Segmentation |
|
Table of Contents
- 1. Introduction
- 1.1. Research Scope
- 1.2. Market Segmentation
- 1.3. Research Objective
- 1.4. Definitions and Assumptions
- 2. Executive Summary
- 2.1. Market Snapshot
- 3. Market Dynamics
- 3.1. Market Drivers
- 3.2. Market Restrains
- 3.3. Market Trends
- 3.4. Market Opportunities
- 4. Market Factor Analysis
- 4.1. Porters Five Forces
- 4.1.1. Bargaining Power of Suppliers
- 4.1.2. Bargaining Power of Buyers
- 4.1.3. Threat of New Entrants
- 4.1.4. Threat of Substitutes
- 4.1.5. Competitive Rivalry
- 4.2. PESTEL analysis
- 4.3. BCG Analysis
- 4.3.1. Stars (High Growth, High Market Share)
- 4.3.2. Cash Cows (Low Growth, High Market Share)
- 4.3.3. Question Mark (High Growth, Low Market Share)
- 4.3.4. Dogs (Low Growth, Low Market Share)
- 4.4. Ansoff Matrix Analysis
- 4.5. Supply Chain Analysis
- 4.6. Regulatory Landscape
- 4.7. Current Market Potential and Opportunity Assessment (TAM–SAM–SOM Framework)
- 4.8. RAX Analyst Note
- 4.1. Porters Five Forces
- 5. Market Analysis, Insights and Forecast 2021-2033
- 5.1. Market Analysis, Insights and Forecast - by Data Rates
- 5.1.1. Less than 1.6 T
- 5.1.2. 3.2 T
- 5.1.3. 6.4 T
- 5.2. Market Analysis, Insights and Forecast - by Region
- 5.2.1. North America
- 5.2.2. Europe
- 5.2.3. Asia
- 5.2.4. Australia and New Zealand
- 5.2.5. Latin America
- 5.2.6. Middle East and Africa
- 5.1. Market Analysis, Insights and Forecast - by Data Rates
- 6. Global Co-packaged Optics Market Analysis, Insights and Forecast, 2021-2033
- 6.1. Market Analysis, Insights and Forecast - by Data Rates
- 6.1.1. Less than 1.6 T
- 6.1.2. 3.2 T
- 6.1.3. 6.4 T
- 6.1. Market Analysis, Insights and Forecast - by Data Rates
- 7. North America Co-packaged Optics Market Analysis, Insights and Forecast, 2020-2032
- 7.1. Market Analysis, Insights and Forecast - by Data Rates
- 7.1.1. Less than 1.6 T
- 7.1.2. 3.2 T
- 7.1.3. 6.4 T
- 7.1. Market Analysis, Insights and Forecast - by Data Rates
- 8. Europe Co-packaged Optics Market Analysis, Insights and Forecast, 2020-2032
- 8.1. Market Analysis, Insights and Forecast - by Data Rates
- 8.1.1. Less than 1.6 T
- 8.1.2. 3.2 T
- 8.1.3. 6.4 T
- 8.1. Market Analysis, Insights and Forecast - by Data Rates
- 9. Asia Co-packaged Optics Market Analysis, Insights and Forecast, 2020-2032
- 9.1. Market Analysis, Insights and Forecast - by Data Rates
- 9.1.1. Less than 1.6 T
- 9.1.2. 3.2 T
- 9.1.3. 6.4 T
- 9.1. Market Analysis, Insights and Forecast - by Data Rates
- 10. Australia and New Zealand Co-packaged Optics Market Analysis, Insights and Forecast, 2020-2032
- 10.1. Market Analysis, Insights and Forecast - by Data Rates
- 10.1.1. Less than 1.6 T
- 10.1.2. 3.2 T
- 10.1.3. 6.4 T
- 10.1. Market Analysis, Insights and Forecast - by Data Rates
- 11. Latin America Co-packaged Optics Market Analysis, Insights and Forecast, 2020-2032
- 11.1. Market Analysis, Insights and Forecast - by Data Rates
- 11.1.1. Less than 1.6 T
- 11.1.2. 3.2 T
- 11.1.3. 6.4 T
- 11.1. Market Analysis, Insights and Forecast - by Data Rates
- 12. Middle East and Africa Co-packaged Optics Market Analysis, Insights and Forecast, 2020-2032
- 12.1. Market Analysis, Insights and Forecast - by Data Rates
- 12.1.1. Less than 1.6 T
- 12.1.2. 3.2 T
- 12.1.3. 6.4 T
- 12.1. Market Analysis, Insights and Forecast - by Data Rates
- 13. Competitive Analysis
- 13.1. Company Profiles
- 13.1.1 Furukawa Electric Co Ltd
- 13.1.1.1. Company Overview
- 13.1.1.2. Products
- 13.1.1.3. Company Financials
- 13.1.1.4. SWOT Analysis
- 13.1.2 IBM Corporation
- 13.1.2.1. Company Overview
- 13.1.2.2. Products
- 13.1.2.3. Company Financials
- 13.1.2.4. SWOT Analysis
- 13.1.3 Kyocera Corporation
- 13.1.3.1. Company Overview
- 13.1.3.2. Products
- 13.1.3.3. Company Financials
- 13.1.3.4. SWOT Analysis
- 13.1.4 TE Connectivity
- 13.1.4.1. Company Overview
- 13.1.4.2. Products
- 13.1.4.3. Company Financials
- 13.1.4.4. SWOT Analysis
- 13.1.5 Cisco Systems Inc
- 13.1.5.1. Company Overview
- 13.1.5.2. Products
- 13.1.5.3. Company Financials
- 13.1.5.4. SWOT Analysis
- 13.1.6 Broadcom Inc
- 13.1.6.1. Company Overview
- 13.1.6.2. Products
- 13.1.6.3. Company Financials
- 13.1.6.4. SWOT Analysis
- 13.1.7 Microsoft Corporation
- 13.1.7.1. Company Overview
- 13.1.7.2. Products
- 13.1.7.3. Company Financials
- 13.1.7.4. SWOT Analysis
- 13.1.8 Ayar Labs Inc
- 13.1.8.1. Company Overview
- 13.1.8.2. Products
- 13.1.8.3. Company Financials
- 13.1.8.4. SWOT Analysis
- 13.1.9 Huawei Technologies Co Ltd
- 13.1.9.1. Company Overview
- 13.1.9.2. Products
- 13.1.9.3. Company Financials
- 13.1.9.4. SWOT Analysis
- 13.1.10 SENKO Advanced Components Inc
- 13.1.10.1. Company Overview
- 13.1.10.2. Products
- 13.1.10.3. Company Financials
- 13.1.10.4. SWOT Analysis
- 13.1.11 Hisense Broadband Multimedia Technology Co Ltd
- 13.1.11.1. Company Overview
- 13.1.11.2. Products
- 13.1.11.3. Company Financials
- 13.1.11.4. SWOT Analysis
- 13.1.12 Sumitomo Electric Industries Lt
- 13.1.12.1. Company Overview
- 13.1.12.2. Products
- 13.1.12.3. Company Financials
- 13.1.12.4. SWOT Analysis
- 13.1.13 Intel Corporation
- 13.1.13.1. Company Overview
- 13.1.13.2. Products
- 13.1.13.3. Company Financials
- 13.1.13.4. SWOT Analysis
- 13.1.14 POET Technologies
- 13.1.14.1. Company Overview
- 13.1.14.2. Products
- 13.1.14.3. Company Financials
- 13.1.14.4. SWOT Analysis
- 13.1.1 Furukawa Electric Co Ltd
- 13.2. Market Entropy
- 13.2.1 Company's Key Areas Served
- 13.2.2 Recent Developments
- 13.3. Company Market Share Analysis 2025
- 13.3.1 Top 5 Companies Market Share Analysis
- 13.3.2 Top 3 Companies Market Share Analysis
- 13.4. List of Potential Customers
- 14. Research Methodology
List of Figures
- Figure 1: Global Co-packaged Optics Market Revenue Breakdown (Million, %) by Region 2025 & 2033
- Figure 2: Global Co-packaged Optics Market Volume Breakdown (K Unit, %) by Region 2025 & 2033
- Figure 3: North America Co-packaged Optics Market Revenue (Million), by Data Rates 2025 & 2033
- Figure 4: North America Co-packaged Optics Market Volume (K Unit), by Data Rates 2025 & 2033
- Figure 5: North America Co-packaged Optics Market Revenue Share (%), by Data Rates 2025 & 2033
- Figure 6: North America Co-packaged Optics Market Volume Share (%), by Data Rates 2025 & 2033
- Figure 7: North America Co-packaged Optics Market Revenue (Million), by Country 2025 & 2033
- Figure 8: North America Co-packaged Optics Market Volume (K Unit), by Country 2025 & 2033
- Figure 9: North America Co-packaged Optics Market Revenue Share (%), by Country 2025 & 2033
- Figure 10: North America Co-packaged Optics Market Volume Share (%), by Country 2025 & 2033
- Figure 11: Europe Co-packaged Optics Market Revenue (Million), by Data Rates 2025 & 2033
- Figure 12: Europe Co-packaged Optics Market Volume (K Unit), by Data Rates 2025 & 2033
- Figure 13: Europe Co-packaged Optics Market Revenue Share (%), by Data Rates 2025 & 2033
- Figure 14: Europe Co-packaged Optics Market Volume Share (%), by Data Rates 2025 & 2033
- Figure 15: Europe Co-packaged Optics Market Revenue (Million), by Country 2025 & 2033
- Figure 16: Europe Co-packaged Optics Market Volume (K Unit), by Country 2025 & 2033
- Figure 17: Europe Co-packaged Optics Market Revenue Share (%), by Country 2025 & 2033
- Figure 18: Europe Co-packaged Optics Market Volume Share (%), by Country 2025 & 2033
- Figure 19: Asia Co-packaged Optics Market Revenue (Million), by Data Rates 2025 & 2033
- Figure 20: Asia Co-packaged Optics Market Volume (K Unit), by Data Rates 2025 & 2033
- Figure 21: Asia Co-packaged Optics Market Revenue Share (%), by Data Rates 2025 & 2033
- Figure 22: Asia Co-packaged Optics Market Volume Share (%), by Data Rates 2025 & 2033
- Figure 23: Asia Co-packaged Optics Market Revenue (Million), by Country 2025 & 2033
- Figure 24: Asia Co-packaged Optics Market Volume (K Unit), by Country 2025 & 2033
- Figure 25: Asia Co-packaged Optics Market Revenue Share (%), by Country 2025 & 2033
- Figure 26: Asia Co-packaged Optics Market Volume Share (%), by Country 2025 & 2033
- Figure 27: Australia and New Zealand Co-packaged Optics Market Revenue (Million), by Data Rates 2025 & 2033
- Figure 28: Australia and New Zealand Co-packaged Optics Market Volume (K Unit), by Data Rates 2025 & 2033
- Figure 29: Australia and New Zealand Co-packaged Optics Market Revenue Share (%), by Data Rates 2025 & 2033
- Figure 30: Australia and New Zealand Co-packaged Optics Market Volume Share (%), by Data Rates 2025 & 2033
- Figure 31: Australia and New Zealand Co-packaged Optics Market Revenue (Million), by Country 2025 & 2033
- Figure 32: Australia and New Zealand Co-packaged Optics Market Volume (K Unit), by Country 2025 & 2033
- Figure 33: Australia and New Zealand Co-packaged Optics Market Revenue Share (%), by Country 2025 & 2033
- Figure 34: Australia and New Zealand Co-packaged Optics Market Volume Share (%), by Country 2025 & 2033
- Figure 35: Latin America Co-packaged Optics Market Revenue (Million), by Data Rates 2025 & 2033
- Figure 36: Latin America Co-packaged Optics Market Volume (K Unit), by Data Rates 2025 & 2033
- Figure 37: Latin America Co-packaged Optics Market Revenue Share (%), by Data Rates 2025 & 2033
- Figure 38: Latin America Co-packaged Optics Market Volume Share (%), by Data Rates 2025 & 2033
- Figure 39: Latin America Co-packaged Optics Market Revenue (Million), by Country 2025 & 2033
- Figure 40: Latin America Co-packaged Optics Market Volume (K Unit), by Country 2025 & 2033
- Figure 41: Latin America Co-packaged Optics Market Revenue Share (%), by Country 2025 & 2033
- Figure 42: Latin America Co-packaged Optics Market Volume Share (%), by Country 2025 & 2033
- Figure 43: Middle East and Africa Co-packaged Optics Market Revenue (Million), by Data Rates 2025 & 2033
- Figure 44: Middle East and Africa Co-packaged Optics Market Volume (K Unit), by Data Rates 2025 & 2033
- Figure 45: Middle East and Africa Co-packaged Optics Market Revenue Share (%), by Data Rates 2025 & 2033
- Figure 46: Middle East and Africa Co-packaged Optics Market Volume Share (%), by Data Rates 2025 & 2033
- Figure 47: Middle East and Africa Co-packaged Optics Market Revenue (Million), by Country 2025 & 2033
- Figure 48: Middle East and Africa Co-packaged Optics Market Volume (K Unit), by Country 2025 & 2033
- Figure 49: Middle East and Africa Co-packaged Optics Market Revenue Share (%), by Country 2025 & 2033
- Figure 50: Middle East and Africa Co-packaged Optics Market Volume Share (%), by Country 2025 & 2033
List of Tables
- Table 1: Global Co-packaged Optics Market Revenue Million Forecast, by Data Rates 2020 & 2033
- Table 2: Global Co-packaged Optics Market Volume K Unit Forecast, by Data Rates 2020 & 2033
- Table 3: Global Co-packaged Optics Market Revenue Million Forecast, by Region 2020 & 2033
- Table 4: Global Co-packaged Optics Market Volume K Unit Forecast, by Region 2020 & 2033
- Table 5: Global Co-packaged Optics Market Revenue Million Forecast, by Data Rates 2020 & 2033
- Table 6: Global Co-packaged Optics Market Volume K Unit Forecast, by Data Rates 2020 & 2033
- Table 7: Global Co-packaged Optics Market Revenue Million Forecast, by Country 2020 & 2033
- Table 8: Global Co-packaged Optics Market Volume K Unit Forecast, by Country 2020 & 2033
- Table 9: Global Co-packaged Optics Market Revenue Million Forecast, by Data Rates 2020 & 2033
- Table 10: Global Co-packaged Optics Market Volume K Unit Forecast, by Data Rates 2020 & 2033
- Table 11: Global Co-packaged Optics Market Revenue Million Forecast, by Country 2020 & 2033
- Table 12: Global Co-packaged Optics Market Volume K Unit Forecast, by Country 2020 & 2033
- Table 13: Global Co-packaged Optics Market Revenue Million Forecast, by Data Rates 2020 & 2033
- Table 14: Global Co-packaged Optics Market Volume K Unit Forecast, by Data Rates 2020 & 2033
- Table 15: Global Co-packaged Optics Market Revenue Million Forecast, by Country 2020 & 2033
- Table 16: Global Co-packaged Optics Market Volume K Unit Forecast, by Country 2020 & 2033
- Table 17: Global Co-packaged Optics Market Revenue Million Forecast, by Data Rates 2020 & 2033
- Table 18: Global Co-packaged Optics Market Volume K Unit Forecast, by Data Rates 2020 & 2033
- Table 19: Global Co-packaged Optics Market Revenue Million Forecast, by Country 2020 & 2033
- Table 20: Global Co-packaged Optics Market Volume K Unit Forecast, by Country 2020 & 2033
- Table 21: Global Co-packaged Optics Market Revenue Million Forecast, by Data Rates 2020 & 2033
- Table 22: Global Co-packaged Optics Market Volume K Unit Forecast, by Data Rates 2020 & 2033
- Table 23: Global Co-packaged Optics Market Revenue Million Forecast, by Country 2020 & 2033
- Table 24: Global Co-packaged Optics Market Volume K Unit Forecast, by Country 2020 & 2033
- Table 25: Global Co-packaged Optics Market Revenue Million Forecast, by Data Rates 2020 & 2033
- Table 26: Global Co-packaged Optics Market Volume K Unit Forecast, by Data Rates 2020 & 2033
- Table 27: Global Co-packaged Optics Market Revenue Million Forecast, by Country 2020 & 2033
- Table 28: Global Co-packaged Optics Market Volume K Unit Forecast, by Country 2020 & 2033
Frequently Asked Questions
1. What is the projected Compound Annual Growth Rate (CAGR) of the Co-packaged Optics Market?
The projected CAGR is approximately 47.12%.
2. Which companies are prominent players in the Co-packaged Optics Market?
Key companies in the market include Furukawa Electric Co Ltd, IBM Corporation, Kyocera Corporation, TE Connectivity, Cisco Systems Inc, Broadcom Inc, Microsoft Corporation, Ayar Labs Inc, Huawei Technologies Co Ltd, SENKO Advanced Components Inc, Hisense Broadband Multimedia Technology Co Ltd, Sumitomo Electric Industries Lt, Intel Corporation, POET Technologies.
3. What are the main segments of the Co-packaged Optics Market?
The market segments include Data Rates.
4. Can you provide details about the market size?
The market size is estimated to be USD 70.20 Million as of 2022.
5. What are some drivers contributing to market growth?
Increase in Adoption of Smart Devices and Rise in Data Traffic; Growth in the Importance of Mega Data Centers; Growth in High-performance Computing.
6. What are the notable trends driving market growth?
Growth in High-performance Computing.
7. Are there any restraints impacting market growth?
Increase in Network Complexity; Device Compatibility and Sustainability Issues.
8. Can you provide examples of recent developments in the market?
March 2024: Intel developed a 4 Tbps bidirectional fully integrated OCI chiplet based on Intel’s in-house silicon photonics technology. This chiplet, or tile, contains a single silicon photonics integrated circuit (PIC) with integrated lasers, an electrical IC (EIC), and a path to incorporate a detachable/re-usable optical connector. The purpose of this development is to address the AI infrastructure’s significant need for bandwidth and to enable future scalability.
9. What pricing options are available for accessing the report?
Pricing options include single-user, multi-user, and enterprise licenses priced at USD 4750, USD 5250, and USD 8750 respectively.
10. Is the market size provided in terms of value or volume?
The market size is provided in terms of value, measured in Million and volume, measured in K Unit.
11. Are there any specific market keywords associated with the report?
Yes, the market keyword associated with the report is "Co-packaged Optics Market," which aids in identifying and referencing the specific market segment covered.
12. How do I determine which pricing option suits my needs best?
The pricing options vary based on user requirements and access needs. Individual users may opt for single-user licenses, while businesses requiring broader access may choose multi-user or enterprise licenses for cost-effective access to the report.
13. Are there any additional resources or data provided in the Co-packaged Optics Market report?
While the report offers comprehensive insights, it's advisable to review the specific contents or supplementary materials provided to ascertain if additional resources or data are available.
14. How can I stay updated on further developments or reports in the Co-packaged Optics Market?
To stay informed about further developments, trends, and reports in the Co-packaged Optics Market, consider subscribing to industry newsletters, following relevant companies and organizations, or regularly checking reputable industry news sources and publications.
Methodology
Step 1 - Identification of Relevant Samples Size from Population Database


Step 2 - Approaches for Defining Global Market Size (Value, Volume* & Price*)

Note*: In applicable scenarios
Step 3 - Data Sources
Primary Research
- Web Analytics
- Survey Reports
- Research Institute
- Latest Research Reports
- Opinion Leaders
Secondary Research
- Annual Reports
- White Paper
- Latest Press Release
- Industry Association
- Paid Database
- Investor Presentations

Step 4 - Data Triangulation
Involves using different sources of information in order to increase the validity of a study
These sources are likely to be stakeholders in a program - participants, other researchers, program staff, other community members, and so on.
Then we put all data in single framework & apply various statistical tools to find out the dynamic on the market.
During the analysis stage, feedback from the stakeholder groups would be compared to determine areas of agreement as well as areas of divergence