


Key Insights
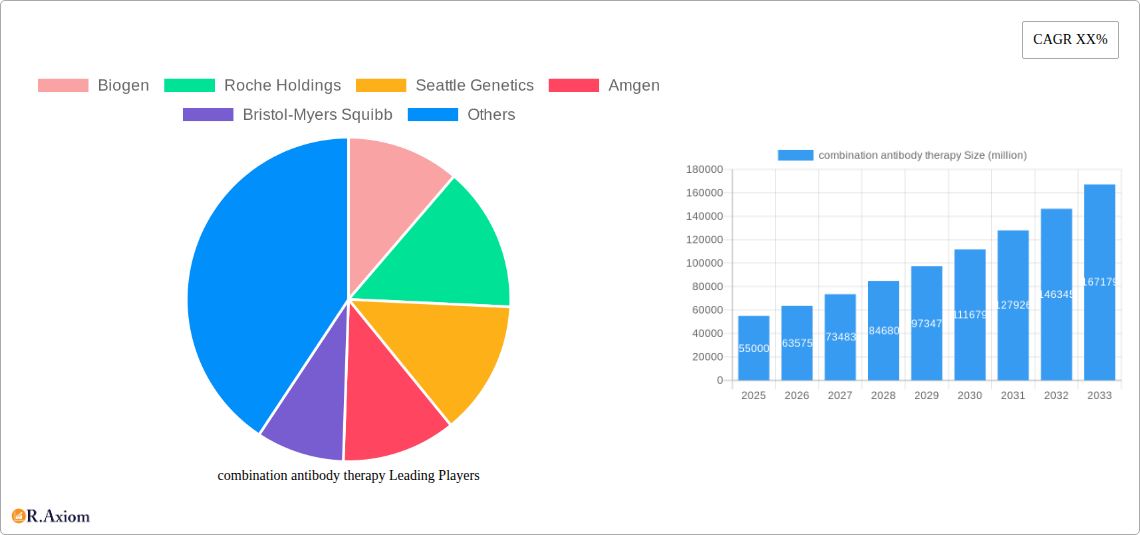
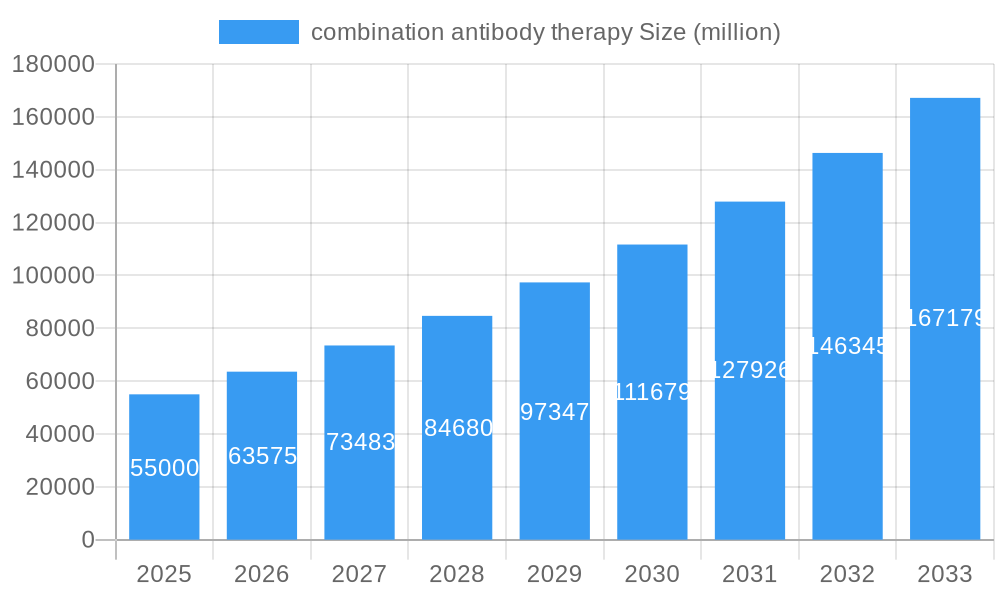
The global combination antibody therapy market is poised for significant expansion, driven by its increasing efficacy in treating complex diseases, particularly cancer. With an estimated market size of USD 55,000 million in 2025, the sector is projected to grow at a robust Compound Annual Growth Rate (CAGR) of 15.5% over the forecast period of 2025-2033. This upward trajectory is fueled by advancements in antibody engineering, a deeper understanding of disease biology, and the growing prevalence of chronic and oncological conditions requiring sophisticated therapeutic interventions. The development of novel antibody-drug conjugates (ADCs) and bispecific antibodies, which offer targeted delivery and enhanced therapeutic outcomes with potentially reduced side effects compared to traditional monotherapies, are key growth drivers. Furthermore, an expanding pipeline of investigational combination therapies and increased investment in research and development by leading pharmaceutical and biotechnology companies are contributing to market dynamism. The application of these therapies is broadly distributed across hospitals, cancer research institutes, clinics, and ambulatory surgical centers (ASCs), reflecting their widespread adoption in clinical practice.
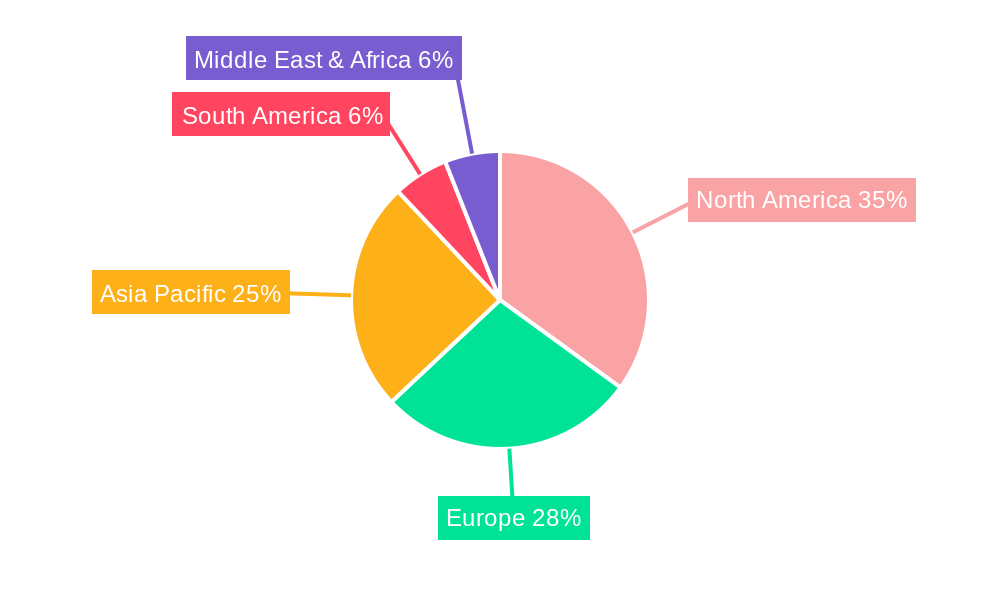
combination antibody therapy Market Size (In Billion)

The market is segmented by therapeutic type, with chemotherapy antibodies, antibodies, conjugated antibodies, and bispecific antibodies each playing a crucial role in addressing diverse medical needs. Conjugated antibodies, in particular, are witnessing substantial growth due to their ability to deliver potent cytotoxic agents directly to cancer cells. Restraints, such as the high cost of development and treatment, stringent regulatory approval processes, and the potential for off-target effects, remain challenges. However, ongoing innovation in precision medicine and the increasing focus on personalized treatment strategies are expected to mitigate these restraints. Geographically, North America currently dominates the market, driven by advanced healthcare infrastructure, early adoption of novel therapies, and substantial R&D investments. Asia Pacific is anticipated to exhibit the fastest growth due to rising healthcare expenditure, increasing cancer incidence, and a growing pool of patients. Key players such as Roche Holdings, Bristol-Myers Squibb, and Novartis are heavily investing in research and strategic collaborations to expand their product portfolios and capitalize on emerging opportunities within this dynamic market.
combination antibody therapy Company Market Share
combination antibody therapy Market Concentration & Innovation
The combination antibody therapy market exhibits a moderate to high level of concentration, driven by significant R&D investments and a pipeline dominated by a few key players. Innovation is a paramount driver, with advancements in bispecific antibodies and conjugated antibodies at the forefront of therapeutic development. Regulatory frameworks, while stringent, are also evolving to accommodate novel combination therapies, particularly in oncology. Product substitutes, primarily single-agent antibody therapies and conventional chemotherapy, still hold significant market share but are increasingly being challenged by the superior efficacy and targeted approaches of combination antibody treatments. End-user trends show a growing preference for less toxic, more effective treatments, pushing demand for advanced antibody-based strategies. Mergers and acquisitions (M&A) are a significant feature of market dynamics, with deal values often reaching hundreds of millions. For instance, recent M&A activities within the oncology antibody space have seen valuations exceeding 1,000 million for promising drug candidates. The market is characterized by strategic partnerships and collaborations between large pharmaceutical companies and smaller biotech firms to leverage complementary expertise and accelerate drug development.
- Market Share Dynamics: Leading companies like Roche Holdings and Bristol-Myers Squibb maintain substantial market share through their robust portfolios of approved combination antibody therapies.
- M&A Deal Values: Recent acquisitions of innovative antibody platforms have ranged from 500 million to over 2,000 million, reflecting the high value placed on next-generation therapeutic agents.
- Innovation Drivers: Focus on developing bispecific antibodies for enhanced targeting and reduced off-target effects, alongside advancements in antibody-drug conjugates (ADCs) for potent localized delivery of cytotoxic agents.
combination antibody therapy Industry Trends & Insights
The combination antibody therapy market is experiencing robust growth, projected to expand at a compound annual growth rate (CAGR) of approximately 18% during the forecast period of 2025–2033. This impressive expansion is fueled by a confluence of factors, including a burgeoning oncology pipeline, an increasing prevalence of chronic diseases, and a growing understanding of the synergistic effects of combining different antibody mechanisms of action. Technological disruptions are continuously reshaping the landscape, with advancements in protein engineering, bioinformatics, and drug delivery systems enabling the development of more sophisticated and targeted antibody therapies. The adoption of bispecific antibodies, designed to engage multiple targets simultaneously, is a significant trend, offering improved efficacy and overcoming resistance mechanisms often seen with monotherapies. Furthermore, the development of conjugated antibodies, particularly antibody-drug conjugates (ADCs), continues to be a major focus, allowing for the precise delivery of highly potent cytotoxic payloads directly to cancer cells, thereby minimizing systemic toxicity. Consumer preferences are shifting towards personalized medicine and treatments with improved safety profiles and reduced side effects, aligning perfectly with the targeted nature of antibody therapies. The competitive dynamics are intense, with major pharmaceutical giants actively engaged in both internal R&D and strategic acquisitions to bolster their portfolios. Biogen, Roche Holdings, Seattle Genetics, Amgen, Bristol-Myers Squibb, Eli Lilly, Novartis, Sanofi, Celgene, and Genmab are key players investing heavily in this space, vying for market dominance. The market penetration of combination antibody therapies is steadily increasing across various therapeutic areas, especially in oncology, immunology, and infectious diseases, as clinical trials demonstrate their superior outcomes compared to traditional treatment modalities. The expanding reach into new indications and patient populations further solidifies the upward trajectory of this market.
Dominant Markets & Segments in combination antibody therapy
The combination antibody therapy market demonstrates significant regional dominance, with North America and Europe currently leading in market size and adoption. This dominance is attributable to several factors, including advanced healthcare infrastructure, substantial R&D investments by pharmaceutical giants like Amgen and Bristol-Myers Squibb, supportive regulatory environments for novel drug approvals, and a high prevalence of target diseases, particularly cancers. Within these regions, the Hospitals segment represents the largest application due to the complex nature of treatments and the need for specialized administration and monitoring. Cancer Research Institutes also play a crucial role, driving innovation and clinical trials that underpin the market's growth.
Dominant Region: North America
- Key Drivers: High healthcare expenditure, strong presence of leading pharmaceutical companies, robust clinical trial infrastructure, and a significant patient pool with unmet medical needs.
- Economic Policies: Favorable reimbursement policies and government funding for biomedical research accelerate market penetration.
- Infrastructure: Well-established hospital networks and specialized cancer centers facilitate the adoption of advanced therapies.
Dominant Application: Hospitals
- Key Drivers: Complex treatment protocols requiring specialized administration, infusion services, and post-treatment monitoring. The need for integrated care pathways for patients undergoing combination antibody therapy.
- Market Size: Hospitals account for the largest share due to the necessity of inpatient or complex outpatient infusion settings.
Dominant Type: Bispecific Antibodies
- Key Drivers: Ability to target multiple cancer pathways simultaneously, leading to enhanced efficacy and overcoming resistance. Growing pipeline of novel bispecific antibody constructs.
- Technological Advancements: Precision engineering allows for tailored therapeutic engagement, offering a significant competitive advantage.
- Market Penetration: Rapidly increasing adoption in hematological malignancies and solid tumors.
Emerging Segments: While Clinics and ASCs (Ambulatory Surgery Centers) are growing, their dominance is currently secondary to hospitals, as the complexity of some combination antibody regimens still necessitates hospital-based care. However, as therapies become more manageable, these segments are poised for significant expansion. The Conjugated Antibodies segment, particularly Antibody-Drug Conjugates (ADCs), is experiencing a surge in development and clinical application, driven by their targeted delivery of potent cytotoxic payloads.
combination antibody therapy Product Developments
Product development in the combination antibody therapy market is characterized by an aggressive focus on oncology and autoimmune diseases. Innovations are centered around enhancing specificity, reducing toxicity, and overcoming drug resistance. The development of next-generation bispecific antibodies that can simultaneously engage multiple immune checkpoints or target tumor-associated antigens and immune effector cells is a key trend. Furthermore, advancements in antibody-drug conjugates (ADCs) are leading to the creation of more potent and tumor-selective therapies, with novel linker technologies and highly active payloads. Companies are investing heavily in creating combination regimens that exploit synergistic mechanisms, such as combining checkpoint inhibitors with other immunotherapies or targeted agents. These developments aim to offer improved patient outcomes, increased survival rates, and a better quality of life compared to existing treatment options.
Report Scope & Segmentation Analysis
This report provides a comprehensive analysis of the combination antibody therapy market, segmented across key applications and types. The study period spans from 2019 to 2033, with a base year of 2025 and a forecast period of 2025–2033, building upon historical data from 2019–2024.
- Application Segments: The market is analyzed based on Hospitals, Cancer Research Institutes, Clinics, and ASCs (Ambulatory Surgery Centers). Hospitals are expected to maintain the largest share due to the complexity of administration and ongoing patient management. Cancer Research Institutes are critical for driving innovation and early-stage development. Clinics and ASCs are projected to experience significant growth as therapies become more accessible and manageable.
- Type Segments: Analysis includes Chemotherapy Antibody, Antibody, Conjugated Antibodies, and Bispecific Antibodies. Bispecific Antibodies and Conjugated Antibodies are the fastest-growing segments, driven by their advanced mechanisms of action and targeted therapeutic potential. Antibody (monoclonal antibody) therapies remain a foundational element, while Chemotherapy Antibody (if referring to antibody-drug conjugates, they are covered under Conjugated Antibodies) represents a more established but evolving category.
Key Drivers of combination antibody therapy Growth
The combination antibody therapy market is propelled by several potent growth drivers. A primary catalyst is the escalating global burden of cancer and autoimmune diseases, necessitating more effective and targeted treatment modalities. Advances in biotechnology, particularly in protein engineering and immunotherapy, have unlocked the potential for developing sophisticated bispecific antibodies and conjugated antibodies with improved efficacy and safety profiles. Regulatory bodies are increasingly streamlining the approval pathways for innovative combination therapies, incentivizing R&D investment. Furthermore, a growing patient preference for personalized medicine and treatments with reduced side effects strongly favors antibody-based approaches. The robust clinical trial pipelines of major pharmaceutical companies, including Roche Holdings and Bristol-Myers Squibb, are continuously introducing novel combination strategies.
Challenges in the combination antibody therapy Sector
Despite its promising growth, the combination antibody therapy sector faces several significant challenges. The high cost of R&D and manufacturing for these complex biologics translates into substantial treatment costs, impacting market accessibility and reimbursement. Stringent and lengthy regulatory approval processes, although evolving, can still pose a hurdle for novel combination therapies. Ensuring consistent supply chain integrity for these sensitive biological products, especially in a globalized market, is critical. Furthermore, the development of drug resistance, while often addressed by combination therapies, remains a persistent challenge that requires continuous innovation. Intense competition among established players and emerging biotechs also drives up R&D costs and necessitates strategic differentiation.
Emerging Opportunities in combination antibody therapy
The combination antibody therapy market is ripe with emerging opportunities. The expansion of these therapies into new therapeutic areas beyond oncology, such as infectious diseases and neurological disorders, presents a significant growth avenue. The ongoing advancements in artificial intelligence (AI) and machine learning are accelerating drug discovery and development, enabling the identification of novel targets and optimal combination strategies. The increasing adoption of companion diagnostics is facilitating personalized treatment approaches, maximizing the effectiveness of antibody therapies for specific patient populations. The growing pipeline of bispecific antibodies and antibody-drug conjugates (ADCs) with improved efficacy and safety profiles offers immense potential. Furthermore, the increasing demand for biosimilars and the potential for price reductions could expand market access in developing economies.
Leading Players in the combination antibody therapy Market
- Biogen
- Roche Holdings
- Seattle Genetics
- Amgen
- Bristol-Myers Squibb
- Eli Lilly
- Novartis
- Sanofi
- Celgene
- Genmab
Key Developments in combination antibody therapy Industry
- 2024 March: Genmab and AbbVie announce positive top-line results from a Phase 3 trial of epcoritamab in patients with diffuse large B-cell lymphoma.
- 2023 December: Bristol-Myers Squibb's Opdualag (nivolumab and relatlimab-rmbw) receives expanded FDA approval for certain unresectable or metastatic melanomas.
- 2023 September: Seattle Genetics announces positive Phase 2 data for tisotumab vedotin-tftv in previously treated patients with recurrent or metastatic cervical cancer.
- 2023 July: Roche Holdings' Tecentriq (atezolizumab) in combination with chemotherapy receives expanded approval for certain types of advanced non-small cell lung cancer.
- 2023 April: Amgen and Regeneron Pharmaceuticals collaborate to investigate combinations of their respective cancer therapies.
Strategic Outlook for combination antibody therapy Market
The strategic outlook for the combination antibody therapy market is exceptionally strong, driven by sustained innovation and a growing demand for more effective and targeted treatments. Key growth catalysts include the continuous advancement of bispecific antibodies and antibody-drug conjugates (ADCs), promising significant improvements in therapeutic outcomes. Strategic partnerships and collaborations between established pharmaceutical companies and agile biotech firms will continue to accelerate the development and commercialization of novel therapies. The increasing focus on precision medicine, supported by advancements in diagnostics, will further tailor antibody-based treatments to specific patient profiles. The expanding application of these therapies across a wider range of diseases, coupled with supportive regulatory environments, will ensure robust market expansion. The market is poised for substantial growth, driven by a pipeline of promising candidates and a clear trend towards more sophisticated, combination-based therapeutic strategies.
combination antibody therapy Segmentation
-
1. Application
- 1.1. Hospitals
- 1.2. Cancer Research Institutes
- 1.3. Clinics
- 1.4. ASCs
-
2. Types
- 2.1. Chemotherapy Antibody
- 2.2. Antibody
- 2.3. Conjugated Antibodies
- 2.4. Bispecific Antibodies
combination antibody therapy Segmentation By Geography
-
1. North America
- 1.1. United States
- 1.2. Canada
- 1.3. Mexico
-
2. South America
- 2.1. Brazil
- 2.2. Argentina
- 2.3. Rest of South America
-
3. Europe
- 3.1. United Kingdom
- 3.2. Germany
- 3.3. France
- 3.4. Italy
- 3.5. Spain
- 3.6. Russia
- 3.7. Benelux
- 3.8. Nordics
- 3.9. Rest of Europe
-
4. Middle East & Africa
- 4.1. Turkey
- 4.2. Israel
- 4.3. GCC
- 4.4. North Africa
- 4.5. South Africa
- 4.6. Rest of Middle East & Africa
-
5. Asia Pacific
- 5.1. China
- 5.2. India
- 5.3. Japan
- 5.4. South Korea
- 5.5. ASEAN
- 5.6. Oceania
- 5.7. Rest of Asia Pacific
combination antibody therapy Regional Market Share
Geographic Coverage of combination antibody therapy
combination antibody therapy REPORT HIGHLIGHTS
| Aspects | Details |
|---|---|
| Study Period | 2020-2034 |
| Base Year | 2025 |
| Estimated Year | 2026 |
| Forecast Period | 2026-2034 |
| Historical Period | 2020-2025 |
| Growth Rate | CAGR of XX% from 2020-2034 |
| Segmentation |
|
Table of Contents
- 1. Introduction
- 1.1. Research Scope
- 1.2. Market Segmentation
- 1.3. Research Methodology
- 1.4. Definitions and Assumptions
- 2. Executive Summary
- 2.1. Introduction
- 3. Market Dynamics
- 3.1. Introduction
- 3.2. Market Drivers
- 3.3. Market Restrains
- 3.4. Market Trends
- 4. Market Factor Analysis
- 4.1. Porters Five Forces
- 4.2. Supply/Value Chain
- 4.3. PESTEL analysis
- 4.4. Market Entropy
- 4.5. Patent/Trademark Analysis
- 5. Global combination antibody therapy Analysis, Insights and Forecast, 2020-2032
- 5.1. Market Analysis, Insights and Forecast - by Application
- 5.1.1. Hospitals
- 5.1.2. Cancer Research Institutes
- 5.1.3. Clinics
- 5.1.4. ASCs
- 5.2. Market Analysis, Insights and Forecast - by Types
- 5.2.1. Chemotherapy Antibody
- 5.2.2. Antibody
- 5.2.3. Conjugated Antibodies
- 5.2.4. Bispecific Antibodies
- 5.3. Market Analysis, Insights and Forecast - by Region
- 5.3.1. North America
- 5.3.2. South America
- 5.3.3. Europe
- 5.3.4. Middle East & Africa
- 5.3.5. Asia Pacific
- 5.1. Market Analysis, Insights and Forecast - by Application
- 6. North America combination antibody therapy Analysis, Insights and Forecast, 2020-2032
- 6.1. Market Analysis, Insights and Forecast - by Application
- 6.1.1. Hospitals
- 6.1.2. Cancer Research Institutes
- 6.1.3. Clinics
- 6.1.4. ASCs
- 6.2. Market Analysis, Insights and Forecast - by Types
- 6.2.1. Chemotherapy Antibody
- 6.2.2. Antibody
- 6.2.3. Conjugated Antibodies
- 6.2.4. Bispecific Antibodies
- 6.1. Market Analysis, Insights and Forecast - by Application
- 7. South America combination antibody therapy Analysis, Insights and Forecast, 2020-2032
- 7.1. Market Analysis, Insights and Forecast - by Application
- 7.1.1. Hospitals
- 7.1.2. Cancer Research Institutes
- 7.1.3. Clinics
- 7.1.4. ASCs
- 7.2. Market Analysis, Insights and Forecast - by Types
- 7.2.1. Chemotherapy Antibody
- 7.2.2. Antibody
- 7.2.3. Conjugated Antibodies
- 7.2.4. Bispecific Antibodies
- 7.1. Market Analysis, Insights and Forecast - by Application
- 8. Europe combination antibody therapy Analysis, Insights and Forecast, 2020-2032
- 8.1. Market Analysis, Insights and Forecast - by Application
- 8.1.1. Hospitals
- 8.1.2. Cancer Research Institutes
- 8.1.3. Clinics
- 8.1.4. ASCs
- 8.2. Market Analysis, Insights and Forecast - by Types
- 8.2.1. Chemotherapy Antibody
- 8.2.2. Antibody
- 8.2.3. Conjugated Antibodies
- 8.2.4. Bispecific Antibodies
- 8.1. Market Analysis, Insights and Forecast - by Application
- 9. Middle East & Africa combination antibody therapy Analysis, Insights and Forecast, 2020-2032
- 9.1. Market Analysis, Insights and Forecast - by Application
- 9.1.1. Hospitals
- 9.1.2. Cancer Research Institutes
- 9.1.3. Clinics
- 9.1.4. ASCs
- 9.2. Market Analysis, Insights and Forecast - by Types
- 9.2.1. Chemotherapy Antibody
- 9.2.2. Antibody
- 9.2.3. Conjugated Antibodies
- 9.2.4. Bispecific Antibodies
- 9.1. Market Analysis, Insights and Forecast - by Application
- 10. Asia Pacific combination antibody therapy Analysis, Insights and Forecast, 2020-2032
- 10.1. Market Analysis, Insights and Forecast - by Application
- 10.1.1. Hospitals
- 10.1.2. Cancer Research Institutes
- 10.1.3. Clinics
- 10.1.4. ASCs
- 10.2. Market Analysis, Insights and Forecast - by Types
- 10.2.1. Chemotherapy Antibody
- 10.2.2. Antibody
- 10.2.3. Conjugated Antibodies
- 10.2.4. Bispecific Antibodies
- 10.1. Market Analysis, Insights and Forecast - by Application
- 11. Competitive Analysis
- 11.1. Global Market Share Analysis 2025
- 11.2. Company Profiles
- 11.2.1 Biogen
- 11.2.1.1. Overview
- 11.2.1.2. Products
- 11.2.1.3. SWOT Analysis
- 11.2.1.4. Recent Developments
- 11.2.1.5. Financials (Based on Availability)
- 11.2.2 Roche Holdings
- 11.2.2.1. Overview
- 11.2.2.2. Products
- 11.2.2.3. SWOT Analysis
- 11.2.2.4. Recent Developments
- 11.2.2.5. Financials (Based on Availability)
- 11.2.3 Seattle Genetics
- 11.2.3.1. Overview
- 11.2.3.2. Products
- 11.2.3.3. SWOT Analysis
- 11.2.3.4. Recent Developments
- 11.2.3.5. Financials (Based on Availability)
- 11.2.4 Amgen
- 11.2.4.1. Overview
- 11.2.4.2. Products
- 11.2.4.3. SWOT Analysis
- 11.2.4.4. Recent Developments
- 11.2.4.5. Financials (Based on Availability)
- 11.2.5 Bristol-Myers Squibb
- 11.2.5.1. Overview
- 11.2.5.2. Products
- 11.2.5.3. SWOT Analysis
- 11.2.5.4. Recent Developments
- 11.2.5.5. Financials (Based on Availability)
- 11.2.6 Eli Lilly
- 11.2.6.1. Overview
- 11.2.6.2. Products
- 11.2.6.3. SWOT Analysis
- 11.2.6.4. Recent Developments
- 11.2.6.5. Financials (Based on Availability)
- 11.2.7 Novartis
- 11.2.7.1. Overview
- 11.2.7.2. Products
- 11.2.7.3. SWOT Analysis
- 11.2.7.4. Recent Developments
- 11.2.7.5. Financials (Based on Availability)
- 11.2.8 Sanofi
- 11.2.8.1. Overview
- 11.2.8.2. Products
- 11.2.8.3. SWOT Analysis
- 11.2.8.4. Recent Developments
- 11.2.8.5. Financials (Based on Availability)
- 11.2.9 Celgene
- 11.2.9.1. Overview
- 11.2.9.2. Products
- 11.2.9.3. SWOT Analysis
- 11.2.9.4. Recent Developments
- 11.2.9.5. Financials (Based on Availability)
- 11.2.10 Genmab
- 11.2.10.1. Overview
- 11.2.10.2. Products
- 11.2.10.3. SWOT Analysis
- 11.2.10.4. Recent Developments
- 11.2.10.5. Financials (Based on Availability)
- 11.2.1 Biogen
List of Figures
- Figure 1: Global combination antibody therapy Revenue Breakdown (million, %) by Region 2025 & 2033
- Figure 2: North America combination antibody therapy Revenue (million), by Application 2025 & 2033
- Figure 3: North America combination antibody therapy Revenue Share (%), by Application 2025 & 2033
- Figure 4: North America combination antibody therapy Revenue (million), by Types 2025 & 2033
- Figure 5: North America combination antibody therapy Revenue Share (%), by Types 2025 & 2033
- Figure 6: North America combination antibody therapy Revenue (million), by Country 2025 & 2033
- Figure 7: North America combination antibody therapy Revenue Share (%), by Country 2025 & 2033
- Figure 8: South America combination antibody therapy Revenue (million), by Application 2025 & 2033
- Figure 9: South America combination antibody therapy Revenue Share (%), by Application 2025 & 2033
- Figure 10: South America combination antibody therapy Revenue (million), by Types 2025 & 2033
- Figure 11: South America combination antibody therapy Revenue Share (%), by Types 2025 & 2033
- Figure 12: South America combination antibody therapy Revenue (million), by Country 2025 & 2033
- Figure 13: South America combination antibody therapy Revenue Share (%), by Country 2025 & 2033
- Figure 14: Europe combination antibody therapy Revenue (million), by Application 2025 & 2033
- Figure 15: Europe combination antibody therapy Revenue Share (%), by Application 2025 & 2033
- Figure 16: Europe combination antibody therapy Revenue (million), by Types 2025 & 2033
- Figure 17: Europe combination antibody therapy Revenue Share (%), by Types 2025 & 2033
- Figure 18: Europe combination antibody therapy Revenue (million), by Country 2025 & 2033
- Figure 19: Europe combination antibody therapy Revenue Share (%), by Country 2025 & 2033
- Figure 20: Middle East & Africa combination antibody therapy Revenue (million), by Application 2025 & 2033
- Figure 21: Middle East & Africa combination antibody therapy Revenue Share (%), by Application 2025 & 2033
- Figure 22: Middle East & Africa combination antibody therapy Revenue (million), by Types 2025 & 2033
- Figure 23: Middle East & Africa combination antibody therapy Revenue Share (%), by Types 2025 & 2033
- Figure 24: Middle East & Africa combination antibody therapy Revenue (million), by Country 2025 & 2033
- Figure 25: Middle East & Africa combination antibody therapy Revenue Share (%), by Country 2025 & 2033
- Figure 26: Asia Pacific combination antibody therapy Revenue (million), by Application 2025 & 2033
- Figure 27: Asia Pacific combination antibody therapy Revenue Share (%), by Application 2025 & 2033
- Figure 28: Asia Pacific combination antibody therapy Revenue (million), by Types 2025 & 2033
- Figure 29: Asia Pacific combination antibody therapy Revenue Share (%), by Types 2025 & 2033
- Figure 30: Asia Pacific combination antibody therapy Revenue (million), by Country 2025 & 2033
- Figure 31: Asia Pacific combination antibody therapy Revenue Share (%), by Country 2025 & 2033
List of Tables
- Table 1: Global combination antibody therapy Revenue million Forecast, by Application 2020 & 2033
- Table 2: Global combination antibody therapy Revenue million Forecast, by Types 2020 & 2033
- Table 3: Global combination antibody therapy Revenue million Forecast, by Region 2020 & 2033
- Table 4: Global combination antibody therapy Revenue million Forecast, by Application 2020 & 2033
- Table 5: Global combination antibody therapy Revenue million Forecast, by Types 2020 & 2033
- Table 6: Global combination antibody therapy Revenue million Forecast, by Country 2020 & 2033
- Table 7: United States combination antibody therapy Revenue (million) Forecast, by Application 2020 & 2033
- Table 8: Canada combination antibody therapy Revenue (million) Forecast, by Application 2020 & 2033
- Table 9: Mexico combination antibody therapy Revenue (million) Forecast, by Application 2020 & 2033
- Table 10: Global combination antibody therapy Revenue million Forecast, by Application 2020 & 2033
- Table 11: Global combination antibody therapy Revenue million Forecast, by Types 2020 & 2033
- Table 12: Global combination antibody therapy Revenue million Forecast, by Country 2020 & 2033
- Table 13: Brazil combination antibody therapy Revenue (million) Forecast, by Application 2020 & 2033
- Table 14: Argentina combination antibody therapy Revenue (million) Forecast, by Application 2020 & 2033
- Table 15: Rest of South America combination antibody therapy Revenue (million) Forecast, by Application 2020 & 2033
- Table 16: Global combination antibody therapy Revenue million Forecast, by Application 2020 & 2033
- Table 17: Global combination antibody therapy Revenue million Forecast, by Types 2020 & 2033
- Table 18: Global combination antibody therapy Revenue million Forecast, by Country 2020 & 2033
- Table 19: United Kingdom combination antibody therapy Revenue (million) Forecast, by Application 2020 & 2033
- Table 20: Germany combination antibody therapy Revenue (million) Forecast, by Application 2020 & 2033
- Table 21: France combination antibody therapy Revenue (million) Forecast, by Application 2020 & 2033
- Table 22: Italy combination antibody therapy Revenue (million) Forecast, by Application 2020 & 2033
- Table 23: Spain combination antibody therapy Revenue (million) Forecast, by Application 2020 & 2033
- Table 24: Russia combination antibody therapy Revenue (million) Forecast, by Application 2020 & 2033
- Table 25: Benelux combination antibody therapy Revenue (million) Forecast, by Application 2020 & 2033
- Table 26: Nordics combination antibody therapy Revenue (million) Forecast, by Application 2020 & 2033
- Table 27: Rest of Europe combination antibody therapy Revenue (million) Forecast, by Application 2020 & 2033
- Table 28: Global combination antibody therapy Revenue million Forecast, by Application 2020 & 2033
- Table 29: Global combination antibody therapy Revenue million Forecast, by Types 2020 & 2033
- Table 30: Global combination antibody therapy Revenue million Forecast, by Country 2020 & 2033
- Table 31: Turkey combination antibody therapy Revenue (million) Forecast, by Application 2020 & 2033
- Table 32: Israel combination antibody therapy Revenue (million) Forecast, by Application 2020 & 2033
- Table 33: GCC combination antibody therapy Revenue (million) Forecast, by Application 2020 & 2033
- Table 34: North Africa combination antibody therapy Revenue (million) Forecast, by Application 2020 & 2033
- Table 35: South Africa combination antibody therapy Revenue (million) Forecast, by Application 2020 & 2033
- Table 36: Rest of Middle East & Africa combination antibody therapy Revenue (million) Forecast, by Application 2020 & 2033
- Table 37: Global combination antibody therapy Revenue million Forecast, by Application 2020 & 2033
- Table 38: Global combination antibody therapy Revenue million Forecast, by Types 2020 & 2033
- Table 39: Global combination antibody therapy Revenue million Forecast, by Country 2020 & 2033
- Table 40: China combination antibody therapy Revenue (million) Forecast, by Application 2020 & 2033
- Table 41: India combination antibody therapy Revenue (million) Forecast, by Application 2020 & 2033
- Table 42: Japan combination antibody therapy Revenue (million) Forecast, by Application 2020 & 2033
- Table 43: South Korea combination antibody therapy Revenue (million) Forecast, by Application 2020 & 2033
- Table 44: ASEAN combination antibody therapy Revenue (million) Forecast, by Application 2020 & 2033
- Table 45: Oceania combination antibody therapy Revenue (million) Forecast, by Application 2020 & 2033
- Table 46: Rest of Asia Pacific combination antibody therapy Revenue (million) Forecast, by Application 2020 & 2033
Frequently Asked Questions
1. What is the projected Compound Annual Growth Rate (CAGR) of the combination antibody therapy?
The projected CAGR is approximately XX%.
2. Which companies are prominent players in the combination antibody therapy?
Key companies in the market include Biogen, Roche Holdings, Seattle Genetics, Amgen, Bristol-Myers Squibb, Eli Lilly, Novartis, Sanofi, Celgene, Genmab.
3. What are the main segments of the combination antibody therapy?
The market segments include Application, Types.
4. Can you provide details about the market size?
The market size is estimated to be USD XXX million as of 2022.
5. What are some drivers contributing to market growth?
N/A
6. What are the notable trends driving market growth?
N/A
7. Are there any restraints impacting market growth?
N/A
8. Can you provide examples of recent developments in the market?
N/A
9. What pricing options are available for accessing the report?
Pricing options include single-user, multi-user, and enterprise licenses priced at USD 4350.00, USD 6525.00, and USD 8700.00 respectively.
10. Is the market size provided in terms of value or volume?
The market size is provided in terms of value, measured in million.
11. Are there any specific market keywords associated with the report?
Yes, the market keyword associated with the report is "combination antibody therapy," which aids in identifying and referencing the specific market segment covered.
12. How do I determine which pricing option suits my needs best?
The pricing options vary based on user requirements and access needs. Individual users may opt for single-user licenses, while businesses requiring broader access may choose multi-user or enterprise licenses for cost-effective access to the report.
13. Are there any additional resources or data provided in the combination antibody therapy report?
While the report offers comprehensive insights, it's advisable to review the specific contents or supplementary materials provided to ascertain if additional resources or data are available.
14. How can I stay updated on further developments or reports in the combination antibody therapy?
To stay informed about further developments, trends, and reports in the combination antibody therapy, consider subscribing to industry newsletters, following relevant companies and organizations, or regularly checking reputable industry news sources and publications.
Methodology
Step 1 - Identification of Relevant Samples Size from Population Database


Step 2 - Approaches for Defining Global Market Size (Value, Volume* & Price*)

Note*: In applicable scenarios
Step 3 - Data Sources
Primary Research
- Web Analytics
- Survey Reports
- Research Institute
- Latest Research Reports
- Opinion Leaders
Secondary Research
- Annual Reports
- White Paper
- Latest Press Release
- Industry Association
- Paid Database
- Investor Presentations

Step 4 - Data Triangulation
Involves using different sources of information in order to increase the validity of a study
These sources are likely to be stakeholders in a program - participants, other researchers, program staff, other community members, and so on.
Then we put all data in single framework & apply various statistical tools to find out the dynamic on the market.
During the analysis stage, feedback from the stakeholder groups would be compared to determine areas of agreement as well as areas of divergence