Key Insights
The global PET scanner market is poised for significant growth, with an estimated market size of $1.09 billion and a projected CAGR of 3.71% during the forecast period of 2025-2033. This expansion is fueled by several key drivers, including the increasing prevalence of chronic diseases like cancer and neurological disorders, which necessitate advanced diagnostic imaging solutions. Advancements in PET scanner technology, such as the development of more sensitive and faster scanners and the integration of AI for enhanced image analysis, are also playing a crucial role in market expansion. Furthermore, growing healthcare expenditure in emerging economies and the rising demand for early disease detection and personalized medicine are contributing to the positive market trajectory. The market is segmented by product type into Full Ring PET Scanners and Partial Ring PET Scanners, with Full Ring PET Scanners likely dominating due to their superior imaging capabilities. In terms of application, Oncology is expected to remain the largest segment, followed by Cardiology and Neurology, owing to the high incidence of these diseases. Hospitals are anticipated to be the primary end-users, driven by the increasing adoption of advanced medical equipment in healthcare facilities.

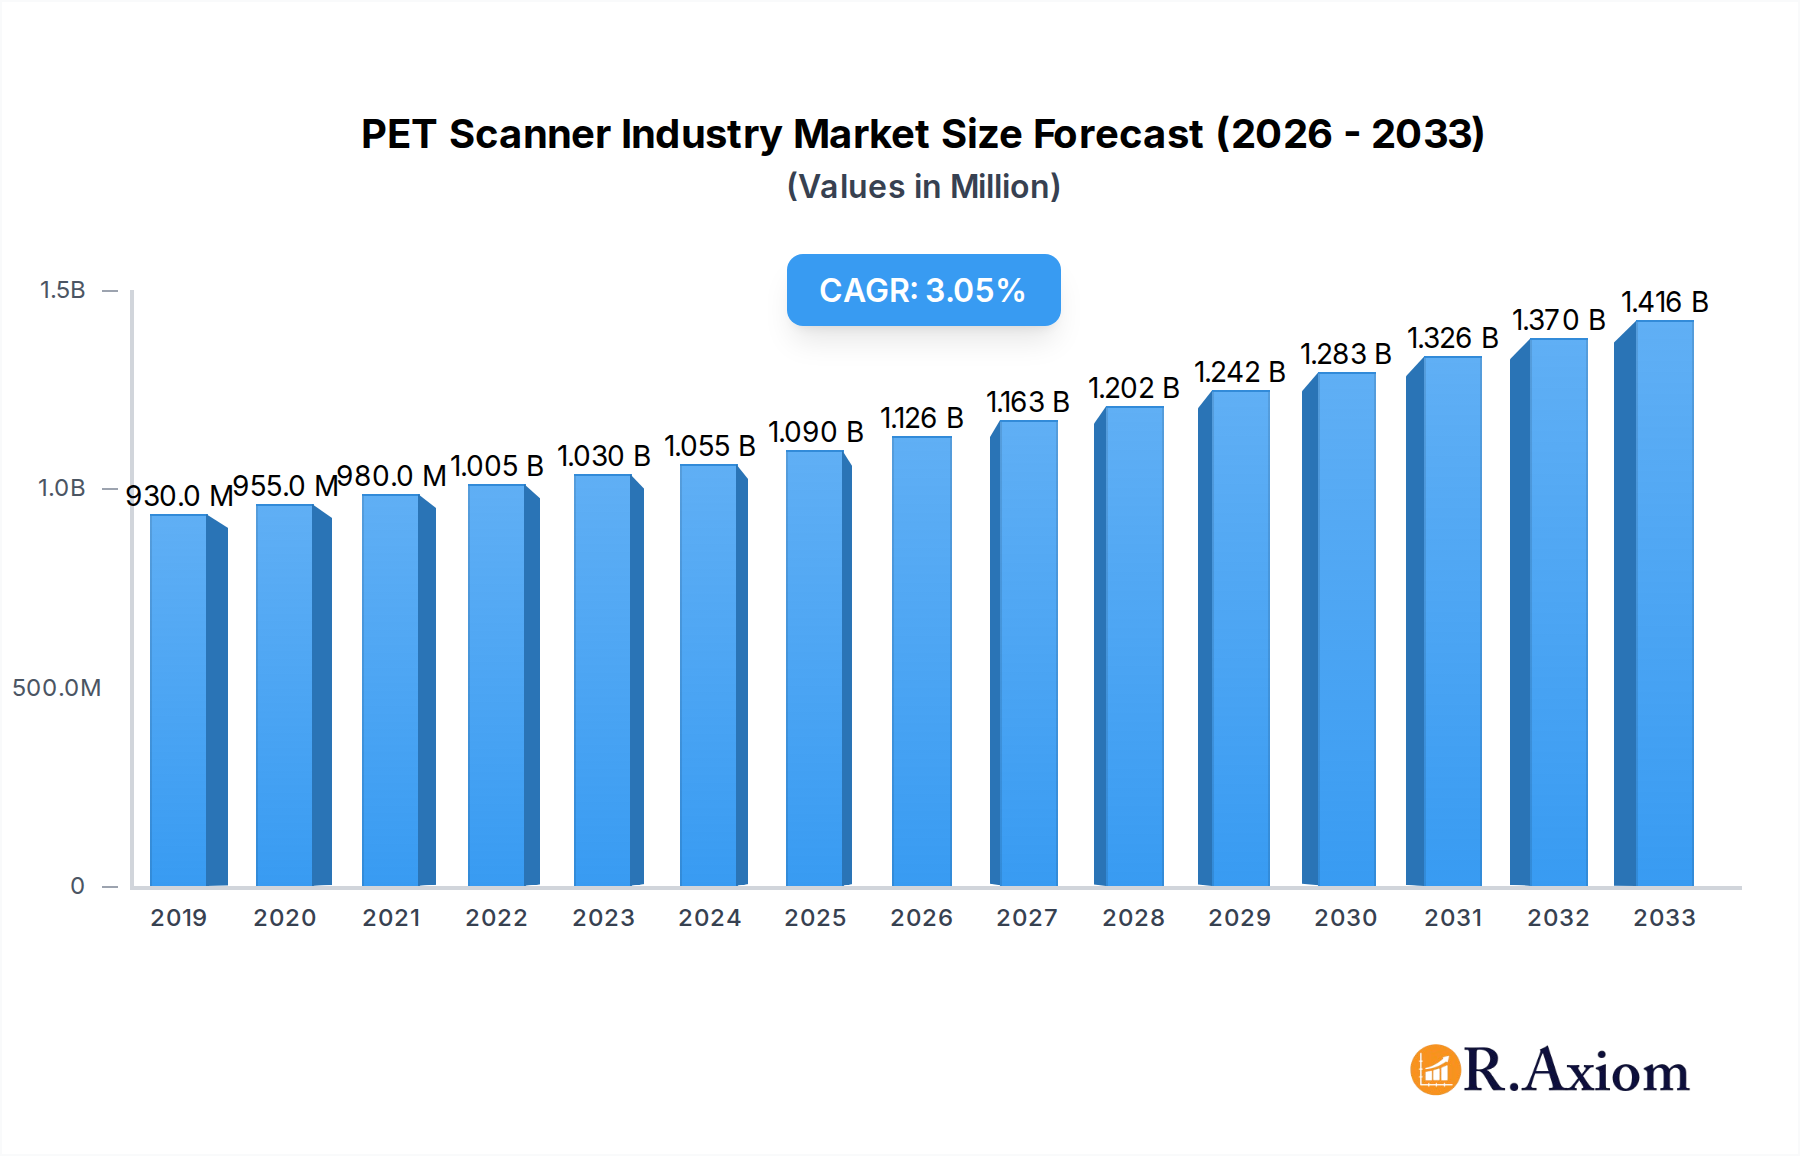
PET Scanner Industry Market Size (In Million)
The PET scanner market is characterized by a competitive landscape featuring prominent global players such as Siemens Healthineers AG, General Electric Company (GE Healthcare), and Koninklijke Philips NV. These companies are actively investing in research and development to introduce innovative products and expand their market reach. While the market shows strong growth potential, certain restraints may impact its trajectory. These include the high cost of PET scanners and associated radiopharmaceuticals, which can be a barrier to adoption, particularly in resource-constrained regions. Stringent regulatory approvals for new devices and the availability of alternative diagnostic imaging modalities like MRI and CT scans also present challenges. However, the ongoing development of hybrid PET/CT and PET/MRI systems, offering combined functional and anatomical imaging, is set to further enhance diagnostic accuracy and patient care, driving market adoption. The increasing focus on therapeutic drug monitoring and theranostics is also expected to create new avenues for growth within the PET scanner industry.
PET Scanner Industry Company Market Share
PET Scanner Industry Market Concentration & Innovation
The global PET scanner industry exhibits a moderately concentrated market structure, driven by the significant capital investment required for research, development, and manufacturing. Key players like Siemens Healthineers AG, General Electric Company (GE Healthcare), and Koninklijke Philips NV dominate, collectively holding an estimated 65% of the market share. Innovation is a critical differentiator, with companies heavily investing in advancements such as higher resolution imaging, faster scan times, and improved radiotracer detection. The development of full-ring PET scanners with enhanced sensitivity and specificity for oncology, neurology, and cardiology applications fuels this innovation. Regulatory frameworks, primarily managed by agencies like the FDA in the US and EMA in Europe, play a crucial role in product approval and market access, emphasizing safety and efficacy. Product substitutes, such as MRI and CT scanners, continue to pose a competitive challenge, but PET scanners' unique ability to provide functional and metabolic information at the molecular level ensures their distinct market position. End-user trends indicate a growing demand for integrated PET-CT and PET-MRI systems to improve diagnostic accuracy and streamline workflows. Mergers and acquisitions (M&A) are infrequent but impactful, with deal values often reaching hundreds of millions. For instance, a hypothetical acquisition of a smaller PET technology firm by a major player could be valued in the range of $300 million to $500 million, signaling consolidation and strategic expansion.
PET Scanner Industry Industry Trends & Insights
The PET scanner industry is experiencing robust growth, propelled by a confluence of escalating healthcare expenditure worldwide, a rising prevalence of chronic diseases, and rapid technological advancements in diagnostic imaging. The estimated Compound Annual Growth Rate (CAGR) for the PET scanner market is projected to be approximately 8.5% during the forecast period of 2025–2033. This growth is significantly influenced by the increasing demand for early disease detection and personalized medicine, particularly in the fields of oncology and neurology, where PET imaging plays a pivotal role in diagnosis, staging, and treatment monitoring. Technological disruptions are constantly reshaping the landscape, with a notable trend towards the development of more compact, cost-effective, and portable PET systems, thereby expanding market penetration into underserved regions and smaller healthcare facilities. Consumer preferences are increasingly geared towards non-invasive imaging techniques that offer superior diagnostic accuracy and patient comfort, a demand that PET technology is well-positioned to meet. Competitive dynamics are characterized by intense R&D efforts to enhance image quality, reduce radiation exposure, and improve the overall efficiency of PET scans. The integration of artificial intelligence (AI) and machine learning (ML) algorithms into PET scanner software is another transformative trend, promising to automate image analysis, improve diagnostic precision, and optimize scanner utilization. The market penetration of advanced PET scanners, especially in emerging economies, is steadily increasing as healthcare infrastructure improves and awareness regarding the benefits of molecular imaging grows. The global market size for PET scanners is expected to reach approximately $8,500 million by 2025, demonstrating substantial market potential.
Dominant Markets & Segments in PET Scanner Industry
The PET scanner industry's dominance is currently centered in North America, driven by its advanced healthcare infrastructure, high per capita healthcare spending, and a proactive approach to adopting cutting-edge medical technologies. The United States, in particular, stands as the leading country, accounting for an estimated 35% of the global PET scanner market. The primary driver behind this dominance is the strong emphasis on research and development, coupled with a high prevalence of cancer and neurological disorders necessitating advanced diagnostic tools.
- Product Type: Full Ring PET Scanners dominate the market due to their superior sensitivity, wider field of view, and ability to capture detailed anatomical and functional information. Their widespread adoption in major research institutions and leading hospitals underscores their significance. Partial Ring PET Scanners, while more cost-effective and compact, are gradually gaining traction in specialized applications and emerging markets. The market for Full Ring PET Scanners is projected to reach approximately $6,000 million by 2025.
- Application: Oncology represents the largest and fastest-growing application segment, driven by the escalating incidence of cancer globally and the critical role of PET imaging in early detection, staging, and treatment response assessment. The oncology segment is estimated to constitute about 50% of the total PET scanner market by application. Neurology follows closely, with increasing use in diagnosing neurodegenerative diseases like Alzheimer's and Parkinson's. Cardiology also shows consistent growth, leveraging PET for assessing myocardial viability and detecting coronary artery disease. The "Other Applications" segment, encompassing research and less common clinical uses, contributes steadily to market diversification. The Oncology segment's market size is estimated to be around $4,250 million by 2025.
- End-User: Hospitals are the predominant end-users, reflecting the high capital expenditure required for PET scanner acquisition and installation, as well as the comprehensive range of medical services offered. Diagnostic Centers are a growing segment, driven by the outsourcing of imaging services and the need for specialized diagnostic capabilities. The "Other End-Users" category includes academic and research institutions, which are crucial for driving innovation and exploring new applications of PET technology. The Hospitals segment is expected to hold a market share of approximately 70% by 2025, with a market value of about $5,950 million.
PET Scanner Industry Product Developments
Product developments in the PET scanner industry are focused on enhancing diagnostic capabilities and improving patient outcomes. Innovations include the introduction of novel, more sensitive detectors that enable earlier disease detection with lower radiotracer doses. The development of hybrid imaging systems, such as PET-CT and PET-MRI, continues to be a key trend, offering comprehensive anatomical and functional insights in a single scan, thereby improving diagnostic accuracy and workflow efficiency. Advancements in software, including AI-powered image reconstruction and analysis tools, are also enhancing the competitive advantage of new systems by speeding up scan times and refining diagnostic precision.
Report Scope & Segmentation Analysis
This report meticulously analyzes the global PET scanner industry, encompassing a comprehensive segmentation strategy.
- Product Type: The market is segmented into Full Ring PET Scanners and Partial Ring PET Scanners. Full Ring PET Scanners are anticipated to dominate, driven by their superior performance characteristics. Partial Ring PET Scanners will see growth due to their accessibility and suitability for specific applications.
- Application: Key applications analyzed include Cardiology, Neurology, and Oncology, with Oncology projected to be the largest segment due to the rising global cancer burden. Other Applications, encompassing research and emerging clinical uses, will also be detailed.
- End-User: The primary end-users examined are Hospitals, Diagnostic Centers, and Other End-Users (including academic and research institutions). Hospitals are expected to maintain their leading position, with Diagnostic Centers experiencing significant growth as imaging services become more specialized.
Key Drivers of PET Scanner Industry Growth
The PET scanner industry's growth is fueled by several critical factors. Technologically, advancements in detector technology, signal processing, and the integration of AI are leading to higher resolution images and faster scan times. Economically, increasing healthcare expenditures globally, particularly in emerging economies, are creating a larger accessible market for advanced medical equipment. Regulatory bodies are also playing a role by streamlining approval processes for innovative PET technologies, while the growing incidence of chronic diseases such as cancer and neurological disorders necessitates more sophisticated diagnostic tools, thereby driving demand.
Challenges in the PET Scanner Industry Sector
The PET scanner industry faces several significant challenges. The high cost of PET scanners and associated infrastructure, including radiopharmaceutical production and handling, presents a major barrier to widespread adoption, especially in resource-constrained settings. Stringent regulatory approval processes, while necessary for patient safety, can delay market entry for new products. Furthermore, the availability of skilled personnel to operate and interpret PET scans remains a constraint in certain regions. Intense competition from established players and the continuous need for substantial R&D investment to keep pace with technological advancements also pose ongoing challenges.
Emerging Opportunities in PET Scanner Industry
Emerging opportunities in the PET scanner industry lie in the expanding applications of PET imaging beyond traditional uses, such as in infectious disease diagnostics and therapeutic drug development. The growing demand for personalized medicine and theranostics, where PET plays a crucial role in targeted treatment selection and monitoring, presents a significant growth avenue. The development of more portable and cost-effective PET systems also opens up opportunities to penetrate underserved markets and smaller healthcare facilities. Furthermore, the increasing adoption of hybrid imaging modalities like PET-MRI is creating new market niches and driving demand for integrated solutions.
Leading Players in the PET Scanner Industry Market
- CMR Naviscan
- Oncovision
- Mediso Ltd
- Segami Corporation
- Agfa Healthcare
- Siemens Healthineers AG
- Cardinal Health
- General Electric Company (GE Healthcare)
- Koninklijke Philips NV
- Neusoft Corporation
- Biosensors International (Spectrum Dynamics Ltd)
- Positron Corporation
Key Developments in PET Scanner Industry Industry
- August 2022: Positron Corporation, a nuclear medicine PET imaging device system and clinical services company, purchased its first PET-CT system and was on its way from its partner Neusoft Medical Systems. Positron's "Affinity PET-CT" system is on its way from China to its validation partner in the United States.
- July 2022: Radialis Inc. received clearance to market the Radialis PET Imager, an organ-targeted positron emission tomography (PET) system, in the United States. The advanced sensitivity of the Radialis PET Imager to radiotracer enables the system to produce functional images with high spatial resolution, expanding the insight available from molecular imaging.
Strategic Outlook for PET Scanner Industry Market
The strategic outlook for the PET scanner industry remains highly positive, driven by continuous innovation and expanding clinical applications. The increasing focus on early disease detection, personalized medicine, and theranostics will continue to propel demand for advanced PET imaging solutions. Investments in artificial intelligence and hybrid imaging technologies are expected to unlock new frontiers in diagnostic accuracy and efficiency. Furthermore, the growing healthcare infrastructure in emerging economies presents a substantial opportunity for market expansion. Companies focusing on developing more accessible and cost-effective PET systems will likely gain a competitive edge in these evolving markets.
PET Scanner Industry Segmentation
-
1. Product Type
- 1.1. Full Ring PET Scanners
- 1.2. Partial Ring PET Scanners
-
2. Application
- 2.1. Cardiology
- 2.2. Neurology
- 2.3. Oncology
- 2.4. Other Applications
-
3. End-User
- 3.1. Hospitals
- 3.2. Diagnostic Centers
- 3.3. Other End-Users
PET Scanner Industry Segmentation By Geography
-
1. North America
- 1.1. United States
- 1.2. Canada
- 1.3. Mexico
-
2. Europe
- 2.1. Germany
- 2.2. United Kingdom
- 2.3. France
- 2.4. Italy
- 2.5. Spain
- 2.6. Rest of Europe
-
3. Asia Pacific
- 3.1. China
- 3.2. Japan
- 3.3. India
- 3.4. Australia
- 3.5. South Korea
- 3.6. Rest of Asia Pacific
-
4. Middle East and Africa
- 4.1. GCC
- 4.2. South Africa
- 4.3. Rest of Middle East and Africa
-
5. South America
- 5.1. Brazil
- 5.2. Argentina
- 5.3. Rest of South America

PET Scanner Industry Regional Market Share
Geographic Coverage of PET Scanner Industry
PET Scanner Industry REPORT HIGHLIGHTS
| Aspects | Details |
|---|---|
| Study Period | 2020-2034 |
| Base Year | 2025 |
| Estimated Year | 2026 |
| Forecast Period | 2026-2034 |
| Historical Period | 2020-2025 |
| Growth Rate | CAGR of 3.71% from 2020-2034 |
| Segmentation |
|
Table of Contents
- 1. Introduction
- 1.1. Research Scope
- 1.2. Market Segmentation
- 1.3. Research Objective
- 1.4. Definitions and Assumptions
- 2. Executive Summary
- 2.1. Market Snapshot
- 3. Market Dynamics
- 3.1. Market Drivers
- 3.2. Market Restrains
- 3.3. Market Trends
- 3.4. Market Opportunities
- 4. Market Factor Analysis
- 4.1. Porters Five Forces
- 4.1.1. Bargaining Power of Suppliers
- 4.1.2. Bargaining Power of Buyers
- 4.1.3. Threat of New Entrants
- 4.1.4. Threat of Substitutes
- 4.1.5. Competitive Rivalry
- 4.2. PESTEL analysis
- 4.3. BCG Analysis
- 4.3.1. Stars (High Growth, High Market Share)
- 4.3.2. Cash Cows (Low Growth, High Market Share)
- 4.3.3. Question Mark (High Growth, Low Market Share)
- 4.3.4. Dogs (Low Growth, Low Market Share)
- 4.4. Ansoff Matrix Analysis
- 4.5. Supply Chain Analysis
- 4.6. Regulatory Landscape
- 4.7. Current Market Potential and Opportunity Assessment (TAM–SAM–SOM Framework)
- 4.8. RAX Analyst Note
- 4.1. Porters Five Forces
- 5. Market Analysis, Insights and Forecast 2021-2033
- 5.1. Market Analysis, Insights and Forecast - by Product Type
- 5.1.1. Full Ring PET Scanners
- 5.1.2. Partial Ring PET Scanners
- 5.2. Market Analysis, Insights and Forecast - by Application
- 5.2.1. Cardiology
- 5.2.2. Neurology
- 5.2.3. Oncology
- 5.2.4. Other Applications
- 5.3. Market Analysis, Insights and Forecast - by End-User
- 5.3.1. Hospitals
- 5.3.2. Diagnostic Centers
- 5.3.3. Other End-Users
- 5.4. Market Analysis, Insights and Forecast - by Region
- 5.4.1. North America
- 5.4.2. Europe
- 5.4.3. Asia Pacific
- 5.4.4. Middle East and Africa
- 5.4.5. South America
- 5.1. Market Analysis, Insights and Forecast - by Product Type
- 6. Global PET Scanner Industry Analysis, Insights and Forecast, 2021-2033
- 6.1. Market Analysis, Insights and Forecast - by Product Type
- 6.1.1. Full Ring PET Scanners
- 6.1.2. Partial Ring PET Scanners
- 6.2. Market Analysis, Insights and Forecast - by Application
- 6.2.1. Cardiology
- 6.2.2. Neurology
- 6.2.3. Oncology
- 6.2.4. Other Applications
- 6.3. Market Analysis, Insights and Forecast - by End-User
- 6.3.1. Hospitals
- 6.3.2. Diagnostic Centers
- 6.3.3. Other End-Users
- 6.1. Market Analysis, Insights and Forecast - by Product Type
- 7. North America PET Scanner Industry Analysis, Insights and Forecast, 2020-2032
- 7.1. Market Analysis, Insights and Forecast - by Product Type
- 7.1.1. Full Ring PET Scanners
- 7.1.2. Partial Ring PET Scanners
- 7.2. Market Analysis, Insights and Forecast - by Application
- 7.2.1. Cardiology
- 7.2.2. Neurology
- 7.2.3. Oncology
- 7.2.4. Other Applications
- 7.3. Market Analysis, Insights and Forecast - by End-User
- 7.3.1. Hospitals
- 7.3.2. Diagnostic Centers
- 7.3.3. Other End-Users
- 7.1. Market Analysis, Insights and Forecast - by Product Type
- 8. Europe PET Scanner Industry Analysis, Insights and Forecast, 2020-2032
- 8.1. Market Analysis, Insights and Forecast - by Product Type
- 8.1.1. Full Ring PET Scanners
- 8.1.2. Partial Ring PET Scanners
- 8.2. Market Analysis, Insights and Forecast - by Application
- 8.2.1. Cardiology
- 8.2.2. Neurology
- 8.2.3. Oncology
- 8.2.4. Other Applications
- 8.3. Market Analysis, Insights and Forecast - by End-User
- 8.3.1. Hospitals
- 8.3.2. Diagnostic Centers
- 8.3.3. Other End-Users
- 8.1. Market Analysis, Insights and Forecast - by Product Type
- 9. Asia Pacific PET Scanner Industry Analysis, Insights and Forecast, 2020-2032
- 9.1. Market Analysis, Insights and Forecast - by Product Type
- 9.1.1. Full Ring PET Scanners
- 9.1.2. Partial Ring PET Scanners
- 9.2. Market Analysis, Insights and Forecast - by Application
- 9.2.1. Cardiology
- 9.2.2. Neurology
- 9.2.3. Oncology
- 9.2.4. Other Applications
- 9.3. Market Analysis, Insights and Forecast - by End-User
- 9.3.1. Hospitals
- 9.3.2. Diagnostic Centers
- 9.3.3. Other End-Users
- 9.1. Market Analysis, Insights and Forecast - by Product Type
- 10. Middle East and Africa PET Scanner Industry Analysis, Insights and Forecast, 2020-2032
- 10.1. Market Analysis, Insights and Forecast - by Product Type
- 10.1.1. Full Ring PET Scanners
- 10.1.2. Partial Ring PET Scanners
- 10.2. Market Analysis, Insights and Forecast - by Application
- 10.2.1. Cardiology
- 10.2.2. Neurology
- 10.2.3. Oncology
- 10.2.4. Other Applications
- 10.3. Market Analysis, Insights and Forecast - by End-User
- 10.3.1. Hospitals
- 10.3.2. Diagnostic Centers
- 10.3.3. Other End-Users
- 10.1. Market Analysis, Insights and Forecast - by Product Type
- 11. South America PET Scanner Industry Analysis, Insights and Forecast, 2020-2032
- 11.1. Market Analysis, Insights and Forecast - by Product Type
- 11.1.1. Full Ring PET Scanners
- 11.1.2. Partial Ring PET Scanners
- 11.2. Market Analysis, Insights and Forecast - by Application
- 11.2.1. Cardiology
- 11.2.2. Neurology
- 11.2.3. Oncology
- 11.2.4. Other Applications
- 11.3. Market Analysis, Insights and Forecast - by End-User
- 11.3.1. Hospitals
- 11.3.2. Diagnostic Centers
- 11.3.3. Other End-Users
- 11.1. Market Analysis, Insights and Forecast - by Product Type
- 12. Competitive Analysis
- 12.1. Company Profiles
- 12.1.1 CMR Naviscan
- 12.1.1.1. Company Overview
- 12.1.1.2. Products
- 12.1.1.3. Company Financials
- 12.1.1.4. SWOT Analysis
- 12.1.2 Oncovision
- 12.1.2.1. Company Overview
- 12.1.2.2. Products
- 12.1.2.3. Company Financials
- 12.1.2.4. SWOT Analysis
- 12.1.3 Mediso Ltd
- 12.1.3.1. Company Overview
- 12.1.3.2. Products
- 12.1.3.3. Company Financials
- 12.1.3.4. SWOT Analysis
- 12.1.4 Segami Corporation
- 12.1.4.1. Company Overview
- 12.1.4.2. Products
- 12.1.4.3. Company Financials
- 12.1.4.4. SWOT Analysis
- 12.1.5 Agfa Healthcare
- 12.1.5.1. Company Overview
- 12.1.5.2. Products
- 12.1.5.3. Company Financials
- 12.1.5.4. SWOT Analysis
- 12.1.6 Siemens Healthineers AG
- 12.1.6.1. Company Overview
- 12.1.6.2. Products
- 12.1.6.3. Company Financials
- 12.1.6.4. SWOT Analysis
- 12.1.7 Cardinal Health
- 12.1.7.1. Company Overview
- 12.1.7.2. Products
- 12.1.7.3. Company Financials
- 12.1.7.4. SWOT Analysis
- 12.1.8 General Electric Company (GE Healthcare)
- 12.1.8.1. Company Overview
- 12.1.8.2. Products
- 12.1.8.3. Company Financials
- 12.1.8.4. SWOT Analysis
- 12.1.9 Koninklijke Philips NV
- 12.1.9.1. Company Overview
- 12.1.9.2. Products
- 12.1.9.3. Company Financials
- 12.1.9.4. SWOT Analysis
- 12.1.10 Neusoft Corporation
- 12.1.10.1. Company Overview
- 12.1.10.2. Products
- 12.1.10.3. Company Financials
- 12.1.10.4. SWOT Analysis
- 12.1.11 Biosensors International (Spectrum Dynamics Ltd)
- 12.1.11.1. Company Overview
- 12.1.11.2. Products
- 12.1.11.3. Company Financials
- 12.1.11.4. SWOT Analysis
- 12.1.12 Positron Corporation
- 12.1.12.1. Company Overview
- 12.1.12.2. Products
- 12.1.12.3. Company Financials
- 12.1.12.4. SWOT Analysis
- 12.1.1 CMR Naviscan
- 12.2. Market Entropy
- 12.2.1 Company's Key Areas Served
- 12.2.2 Recent Developments
- 12.3. Company Market Share Analysis 2025
- 12.3.1 Top 5 Companies Market Share Analysis
- 12.3.2 Top 3 Companies Market Share Analysis
- 12.4. List of Potential Customers
- 13. Research Methodology
List of Figures
- Figure 1: Global PET Scanner Industry Revenue Breakdown (Million, %) by Region 2025 & 2033
- Figure 2: Global PET Scanner Industry Volume Breakdown (K Unit, %) by Region 2025 & 2033
- Figure 3: North America PET Scanner Industry Revenue (Million), by Product Type 2025 & 2033
- Figure 4: North America PET Scanner Industry Volume (K Unit), by Product Type 2025 & 2033
- Figure 5: North America PET Scanner Industry Revenue Share (%), by Product Type 2025 & 2033
- Figure 6: North America PET Scanner Industry Volume Share (%), by Product Type 2025 & 2033
- Figure 7: North America PET Scanner Industry Revenue (Million), by Application 2025 & 2033
- Figure 8: North America PET Scanner Industry Volume (K Unit), by Application 2025 & 2033
- Figure 9: North America PET Scanner Industry Revenue Share (%), by Application 2025 & 2033
- Figure 10: North America PET Scanner Industry Volume Share (%), by Application 2025 & 2033
- Figure 11: North America PET Scanner Industry Revenue (Million), by End-User 2025 & 2033
- Figure 12: North America PET Scanner Industry Volume (K Unit), by End-User 2025 & 2033
- Figure 13: North America PET Scanner Industry Revenue Share (%), by End-User 2025 & 2033
- Figure 14: North America PET Scanner Industry Volume Share (%), by End-User 2025 & 2033
- Figure 15: North America PET Scanner Industry Revenue (Million), by Country 2025 & 2033
- Figure 16: North America PET Scanner Industry Volume (K Unit), by Country 2025 & 2033
- Figure 17: North America PET Scanner Industry Revenue Share (%), by Country 2025 & 2033
- Figure 18: North America PET Scanner Industry Volume Share (%), by Country 2025 & 2033
- Figure 19: Europe PET Scanner Industry Revenue (Million), by Product Type 2025 & 2033
- Figure 20: Europe PET Scanner Industry Volume (K Unit), by Product Type 2025 & 2033
- Figure 21: Europe PET Scanner Industry Revenue Share (%), by Product Type 2025 & 2033
- Figure 22: Europe PET Scanner Industry Volume Share (%), by Product Type 2025 & 2033
- Figure 23: Europe PET Scanner Industry Revenue (Million), by Application 2025 & 2033
- Figure 24: Europe PET Scanner Industry Volume (K Unit), by Application 2025 & 2033
- Figure 25: Europe PET Scanner Industry Revenue Share (%), by Application 2025 & 2033
- Figure 26: Europe PET Scanner Industry Volume Share (%), by Application 2025 & 2033
- Figure 27: Europe PET Scanner Industry Revenue (Million), by End-User 2025 & 2033
- Figure 28: Europe PET Scanner Industry Volume (K Unit), by End-User 2025 & 2033
- Figure 29: Europe PET Scanner Industry Revenue Share (%), by End-User 2025 & 2033
- Figure 30: Europe PET Scanner Industry Volume Share (%), by End-User 2025 & 2033
- Figure 31: Europe PET Scanner Industry Revenue (Million), by Country 2025 & 2033
- Figure 32: Europe PET Scanner Industry Volume (K Unit), by Country 2025 & 2033
- Figure 33: Europe PET Scanner Industry Revenue Share (%), by Country 2025 & 2033
- Figure 34: Europe PET Scanner Industry Volume Share (%), by Country 2025 & 2033
- Figure 35: Asia Pacific PET Scanner Industry Revenue (Million), by Product Type 2025 & 2033
- Figure 36: Asia Pacific PET Scanner Industry Volume (K Unit), by Product Type 2025 & 2033
- Figure 37: Asia Pacific PET Scanner Industry Revenue Share (%), by Product Type 2025 & 2033
- Figure 38: Asia Pacific PET Scanner Industry Volume Share (%), by Product Type 2025 & 2033
- Figure 39: Asia Pacific PET Scanner Industry Revenue (Million), by Application 2025 & 2033
- Figure 40: Asia Pacific PET Scanner Industry Volume (K Unit), by Application 2025 & 2033
- Figure 41: Asia Pacific PET Scanner Industry Revenue Share (%), by Application 2025 & 2033
- Figure 42: Asia Pacific PET Scanner Industry Volume Share (%), by Application 2025 & 2033
- Figure 43: Asia Pacific PET Scanner Industry Revenue (Million), by End-User 2025 & 2033
- Figure 44: Asia Pacific PET Scanner Industry Volume (K Unit), by End-User 2025 & 2033
- Figure 45: Asia Pacific PET Scanner Industry Revenue Share (%), by End-User 2025 & 2033
- Figure 46: Asia Pacific PET Scanner Industry Volume Share (%), by End-User 2025 & 2033
- Figure 47: Asia Pacific PET Scanner Industry Revenue (Million), by Country 2025 & 2033
- Figure 48: Asia Pacific PET Scanner Industry Volume (K Unit), by Country 2025 & 2033
- Figure 49: Asia Pacific PET Scanner Industry Revenue Share (%), by Country 2025 & 2033
- Figure 50: Asia Pacific PET Scanner Industry Volume Share (%), by Country 2025 & 2033
- Figure 51: Middle East and Africa PET Scanner Industry Revenue (Million), by Product Type 2025 & 2033
- Figure 52: Middle East and Africa PET Scanner Industry Volume (K Unit), by Product Type 2025 & 2033
- Figure 53: Middle East and Africa PET Scanner Industry Revenue Share (%), by Product Type 2025 & 2033
- Figure 54: Middle East and Africa PET Scanner Industry Volume Share (%), by Product Type 2025 & 2033
- Figure 55: Middle East and Africa PET Scanner Industry Revenue (Million), by Application 2025 & 2033
- Figure 56: Middle East and Africa PET Scanner Industry Volume (K Unit), by Application 2025 & 2033
- Figure 57: Middle East and Africa PET Scanner Industry Revenue Share (%), by Application 2025 & 2033
- Figure 58: Middle East and Africa PET Scanner Industry Volume Share (%), by Application 2025 & 2033
- Figure 59: Middle East and Africa PET Scanner Industry Revenue (Million), by End-User 2025 & 2033
- Figure 60: Middle East and Africa PET Scanner Industry Volume (K Unit), by End-User 2025 & 2033
- Figure 61: Middle East and Africa PET Scanner Industry Revenue Share (%), by End-User 2025 & 2033
- Figure 62: Middle East and Africa PET Scanner Industry Volume Share (%), by End-User 2025 & 2033
- Figure 63: Middle East and Africa PET Scanner Industry Revenue (Million), by Country 2025 & 2033
- Figure 64: Middle East and Africa PET Scanner Industry Volume (K Unit), by Country 2025 & 2033
- Figure 65: Middle East and Africa PET Scanner Industry Revenue Share (%), by Country 2025 & 2033
- Figure 66: Middle East and Africa PET Scanner Industry Volume Share (%), by Country 2025 & 2033
- Figure 67: South America PET Scanner Industry Revenue (Million), by Product Type 2025 & 2033
- Figure 68: South America PET Scanner Industry Volume (K Unit), by Product Type 2025 & 2033
- Figure 69: South America PET Scanner Industry Revenue Share (%), by Product Type 2025 & 2033
- Figure 70: South America PET Scanner Industry Volume Share (%), by Product Type 2025 & 2033
- Figure 71: South America PET Scanner Industry Revenue (Million), by Application 2025 & 2033
- Figure 72: South America PET Scanner Industry Volume (K Unit), by Application 2025 & 2033
- Figure 73: South America PET Scanner Industry Revenue Share (%), by Application 2025 & 2033
- Figure 74: South America PET Scanner Industry Volume Share (%), by Application 2025 & 2033
- Figure 75: South America PET Scanner Industry Revenue (Million), by End-User 2025 & 2033
- Figure 76: South America PET Scanner Industry Volume (K Unit), by End-User 2025 & 2033
- Figure 77: South America PET Scanner Industry Revenue Share (%), by End-User 2025 & 2033
- Figure 78: South America PET Scanner Industry Volume Share (%), by End-User 2025 & 2033
- Figure 79: South America PET Scanner Industry Revenue (Million), by Country 2025 & 2033
- Figure 80: South America PET Scanner Industry Volume (K Unit), by Country 2025 & 2033
- Figure 81: South America PET Scanner Industry Revenue Share (%), by Country 2025 & 2033
- Figure 82: South America PET Scanner Industry Volume Share (%), by Country 2025 & 2033
List of Tables
- Table 1: Global PET Scanner Industry Revenue Million Forecast, by Product Type 2020 & 2033
- Table 2: Global PET Scanner Industry Volume K Unit Forecast, by Product Type 2020 & 2033
- Table 3: Global PET Scanner Industry Revenue Million Forecast, by Application 2020 & 2033
- Table 4: Global PET Scanner Industry Volume K Unit Forecast, by Application 2020 & 2033
- Table 5: Global PET Scanner Industry Revenue Million Forecast, by End-User 2020 & 2033
- Table 6: Global PET Scanner Industry Volume K Unit Forecast, by End-User 2020 & 2033
- Table 7: Global PET Scanner Industry Revenue Million Forecast, by Region 2020 & 2033
- Table 8: Global PET Scanner Industry Volume K Unit Forecast, by Region 2020 & 2033
- Table 9: Global PET Scanner Industry Revenue Million Forecast, by Product Type 2020 & 2033
- Table 10: Global PET Scanner Industry Volume K Unit Forecast, by Product Type 2020 & 2033
- Table 11: Global PET Scanner Industry Revenue Million Forecast, by Application 2020 & 2033
- Table 12: Global PET Scanner Industry Volume K Unit Forecast, by Application 2020 & 2033
- Table 13: Global PET Scanner Industry Revenue Million Forecast, by End-User 2020 & 2033
- Table 14: Global PET Scanner Industry Volume K Unit Forecast, by End-User 2020 & 2033
- Table 15: Global PET Scanner Industry Revenue Million Forecast, by Country 2020 & 2033
- Table 16: Global PET Scanner Industry Volume K Unit Forecast, by Country 2020 & 2033
- Table 17: United States PET Scanner Industry Revenue (Million) Forecast, by Application 2020 & 2033
- Table 18: United States PET Scanner Industry Volume (K Unit) Forecast, by Application 2020 & 2033
- Table 19: Canada PET Scanner Industry Revenue (Million) Forecast, by Application 2020 & 2033
- Table 20: Canada PET Scanner Industry Volume (K Unit) Forecast, by Application 2020 & 2033
- Table 21: Mexico PET Scanner Industry Revenue (Million) Forecast, by Application 2020 & 2033
- Table 22: Mexico PET Scanner Industry Volume (K Unit) Forecast, by Application 2020 & 2033
- Table 23: Global PET Scanner Industry Revenue Million Forecast, by Product Type 2020 & 2033
- Table 24: Global PET Scanner Industry Volume K Unit Forecast, by Product Type 2020 & 2033
- Table 25: Global PET Scanner Industry Revenue Million Forecast, by Application 2020 & 2033
- Table 26: Global PET Scanner Industry Volume K Unit Forecast, by Application 2020 & 2033
- Table 27: Global PET Scanner Industry Revenue Million Forecast, by End-User 2020 & 2033
- Table 28: Global PET Scanner Industry Volume K Unit Forecast, by End-User 2020 & 2033
- Table 29: Global PET Scanner Industry Revenue Million Forecast, by Country 2020 & 2033
- Table 30: Global PET Scanner Industry Volume K Unit Forecast, by Country 2020 & 2033
- Table 31: Germany PET Scanner Industry Revenue (Million) Forecast, by Application 2020 & 2033
- Table 32: Germany PET Scanner Industry Volume (K Unit) Forecast, by Application 2020 & 2033
- Table 33: United Kingdom PET Scanner Industry Revenue (Million) Forecast, by Application 2020 & 2033
- Table 34: United Kingdom PET Scanner Industry Volume (K Unit) Forecast, by Application 2020 & 2033
- Table 35: France PET Scanner Industry Revenue (Million) Forecast, by Application 2020 & 2033
- Table 36: France PET Scanner Industry Volume (K Unit) Forecast, by Application 2020 & 2033
- Table 37: Italy PET Scanner Industry Revenue (Million) Forecast, by Application 2020 & 2033
- Table 38: Italy PET Scanner Industry Volume (K Unit) Forecast, by Application 2020 & 2033
- Table 39: Spain PET Scanner Industry Revenue (Million) Forecast, by Application 2020 & 2033
- Table 40: Spain PET Scanner Industry Volume (K Unit) Forecast, by Application 2020 & 2033
- Table 41: Rest of Europe PET Scanner Industry Revenue (Million) Forecast, by Application 2020 & 2033
- Table 42: Rest of Europe PET Scanner Industry Volume (K Unit) Forecast, by Application 2020 & 2033
- Table 43: Global PET Scanner Industry Revenue Million Forecast, by Product Type 2020 & 2033
- Table 44: Global PET Scanner Industry Volume K Unit Forecast, by Product Type 2020 & 2033
- Table 45: Global PET Scanner Industry Revenue Million Forecast, by Application 2020 & 2033
- Table 46: Global PET Scanner Industry Volume K Unit Forecast, by Application 2020 & 2033
- Table 47: Global PET Scanner Industry Revenue Million Forecast, by End-User 2020 & 2033
- Table 48: Global PET Scanner Industry Volume K Unit Forecast, by End-User 2020 & 2033
- Table 49: Global PET Scanner Industry Revenue Million Forecast, by Country 2020 & 2033
- Table 50: Global PET Scanner Industry Volume K Unit Forecast, by Country 2020 & 2033
- Table 51: China PET Scanner Industry Revenue (Million) Forecast, by Application 2020 & 2033
- Table 52: China PET Scanner Industry Volume (K Unit) Forecast, by Application 2020 & 2033
- Table 53: Japan PET Scanner Industry Revenue (Million) Forecast, by Application 2020 & 2033
- Table 54: Japan PET Scanner Industry Volume (K Unit) Forecast, by Application 2020 & 2033
- Table 55: India PET Scanner Industry Revenue (Million) Forecast, by Application 2020 & 2033
- Table 56: India PET Scanner Industry Volume (K Unit) Forecast, by Application 2020 & 2033
- Table 57: Australia PET Scanner Industry Revenue (Million) Forecast, by Application 2020 & 2033
- Table 58: Australia PET Scanner Industry Volume (K Unit) Forecast, by Application 2020 & 2033
- Table 59: South Korea PET Scanner Industry Revenue (Million) Forecast, by Application 2020 & 2033
- Table 60: South Korea PET Scanner Industry Volume (K Unit) Forecast, by Application 2020 & 2033
- Table 61: Rest of Asia Pacific PET Scanner Industry Revenue (Million) Forecast, by Application 2020 & 2033
- Table 62: Rest of Asia Pacific PET Scanner Industry Volume (K Unit) Forecast, by Application 2020 & 2033
- Table 63: Global PET Scanner Industry Revenue Million Forecast, by Product Type 2020 & 2033
- Table 64: Global PET Scanner Industry Volume K Unit Forecast, by Product Type 2020 & 2033
- Table 65: Global PET Scanner Industry Revenue Million Forecast, by Application 2020 & 2033
- Table 66: Global PET Scanner Industry Volume K Unit Forecast, by Application 2020 & 2033
- Table 67: Global PET Scanner Industry Revenue Million Forecast, by End-User 2020 & 2033
- Table 68: Global PET Scanner Industry Volume K Unit Forecast, by End-User 2020 & 2033
- Table 69: Global PET Scanner Industry Revenue Million Forecast, by Country 2020 & 2033
- Table 70: Global PET Scanner Industry Volume K Unit Forecast, by Country 2020 & 2033
- Table 71: GCC PET Scanner Industry Revenue (Million) Forecast, by Application 2020 & 2033
- Table 72: GCC PET Scanner Industry Volume (K Unit) Forecast, by Application 2020 & 2033
- Table 73: South Africa PET Scanner Industry Revenue (Million) Forecast, by Application 2020 & 2033
- Table 74: South Africa PET Scanner Industry Volume (K Unit) Forecast, by Application 2020 & 2033
- Table 75: Rest of Middle East and Africa PET Scanner Industry Revenue (Million) Forecast, by Application 2020 & 2033
- Table 76: Rest of Middle East and Africa PET Scanner Industry Volume (K Unit) Forecast, by Application 2020 & 2033
- Table 77: Global PET Scanner Industry Revenue Million Forecast, by Product Type 2020 & 2033
- Table 78: Global PET Scanner Industry Volume K Unit Forecast, by Product Type 2020 & 2033
- Table 79: Global PET Scanner Industry Revenue Million Forecast, by Application 2020 & 2033
- Table 80: Global PET Scanner Industry Volume K Unit Forecast, by Application 2020 & 2033
- Table 81: Global PET Scanner Industry Revenue Million Forecast, by End-User 2020 & 2033
- Table 82: Global PET Scanner Industry Volume K Unit Forecast, by End-User 2020 & 2033
- Table 83: Global PET Scanner Industry Revenue Million Forecast, by Country 2020 & 2033
- Table 84: Global PET Scanner Industry Volume K Unit Forecast, by Country 2020 & 2033
- Table 85: Brazil PET Scanner Industry Revenue (Million) Forecast, by Application 2020 & 2033
- Table 86: Brazil PET Scanner Industry Volume (K Unit) Forecast, by Application 2020 & 2033
- Table 87: Argentina PET Scanner Industry Revenue (Million) Forecast, by Application 2020 & 2033
- Table 88: Argentina PET Scanner Industry Volume (K Unit) Forecast, by Application 2020 & 2033
- Table 89: Rest of South America PET Scanner Industry Revenue (Million) Forecast, by Application 2020 & 2033
- Table 90: Rest of South America PET Scanner Industry Volume (K Unit) Forecast, by Application 2020 & 2033
Frequently Asked Questions
1. What is the projected Compound Annual Growth Rate (CAGR) of the PET Scanner Industry?
The projected CAGR is approximately 3.71%.
2. Which companies are prominent players in the PET Scanner Industry?
Key companies in the market include CMR Naviscan, Oncovision, Mediso Ltd, Segami Corporation, Agfa Healthcare, Siemens Healthineers AG, Cardinal Health, General Electric Company (GE Healthcare), Koninklijke Philips NV, Neusoft Corporation, Biosensors International (Spectrum Dynamics Ltd), Positron Corporation.
3. What are the main segments of the PET Scanner Industry?
The market segments include Product Type, Application, End-User.
4. Can you provide details about the market size?
The market size is estimated to be USD 1.09 Million as of 2022.
5. What are some drivers contributing to market growth?
Increasing Demand for PET Analysis in Radio Pharmaceuticals; Technological Advancements in PET Imaging for Oncology and Advanced Diagnostics Applications; Integration of X-ray Tomography (CT) into PET.
6. What are the notable trends driving market growth?
The Oncology Segment is Expected to Hold a Significant Market Share Over the Forecast Period.
7. Are there any restraints impacting market growth?
Shorter Half-life of Radioisotopes; Stringent Regulatory Guidelines.
8. Can you provide examples of recent developments in the market?
August 2022- Positron Corporation, a nuclear medicine PET imaging device system and clinical services company, purchased its first PET-CT system and was on its way from its partner Neusoft Medical Systems. Positron's "Affinity PET-CT" system is on its way from China to its validation partner in the United States.
9. What pricing options are available for accessing the report?
Pricing options include single-user, multi-user, and enterprise licenses priced at USD 4750, USD 5250, and USD 8750 respectively.
10. Is the market size provided in terms of value or volume?
The market size is provided in terms of value, measured in Million and volume, measured in K Unit.
11. Are there any specific market keywords associated with the report?
Yes, the market keyword associated with the report is "PET Scanner Industry," which aids in identifying and referencing the specific market segment covered.
12. How do I determine which pricing option suits my needs best?
The pricing options vary based on user requirements and access needs. Individual users may opt for single-user licenses, while businesses requiring broader access may choose multi-user or enterprise licenses for cost-effective access to the report.
13. Are there any additional resources or data provided in the PET Scanner Industry report?
While the report offers comprehensive insights, it's advisable to review the specific contents or supplementary materials provided to ascertain if additional resources or data are available.
14. How can I stay updated on further developments or reports in the PET Scanner Industry?
To stay informed about further developments, trends, and reports in the PET Scanner Industry, consider subscribing to industry newsletters, following relevant companies and organizations, or regularly checking reputable industry news sources and publications.
Methodology
Step 1 - Identification of Relevant Samples Size from Population Database


Step 2 - Approaches for Defining Global Market Size (Value, Volume* & Price*)

Note*: In applicable scenarios
Step 3 - Data Sources
Primary Research
- Web Analytics
- Survey Reports
- Research Institute
- Latest Research Reports
- Opinion Leaders
Secondary Research
- Annual Reports
- White Paper
- Latest Press Release
- Industry Association
- Paid Database
- Investor Presentations

Step 4 - Data Triangulation
Involves using different sources of information in order to increase the validity of a study
These sources are likely to be stakeholders in a program - participants, other researchers, program staff, other community members, and so on.
Then we put all data in single framework & apply various statistical tools to find out the dynamic on the market.
During the analysis stage, feedback from the stakeholder groups would be compared to determine areas of agreement as well as areas of divergence

