
Key Insights
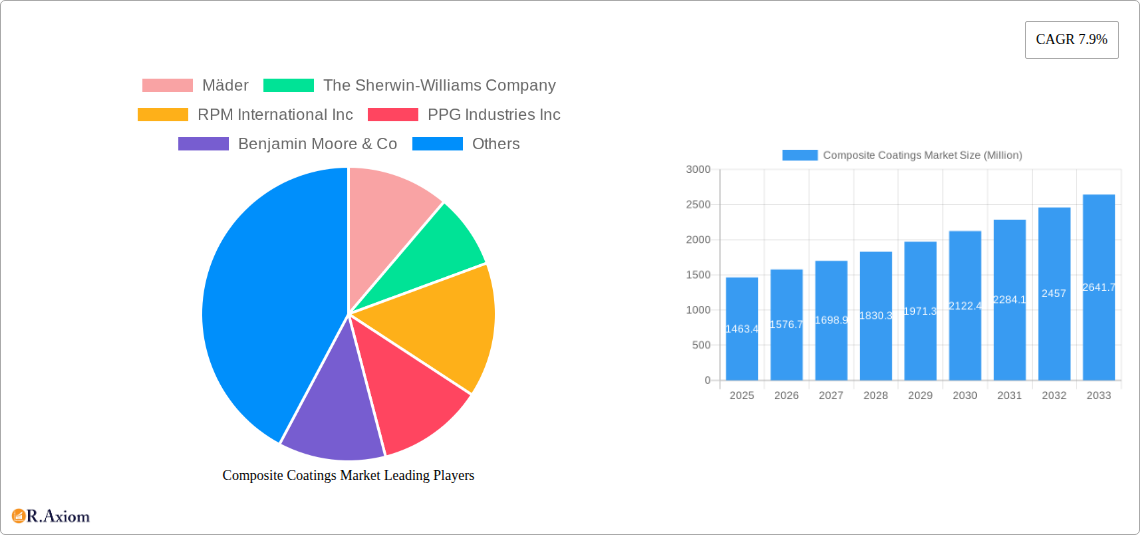
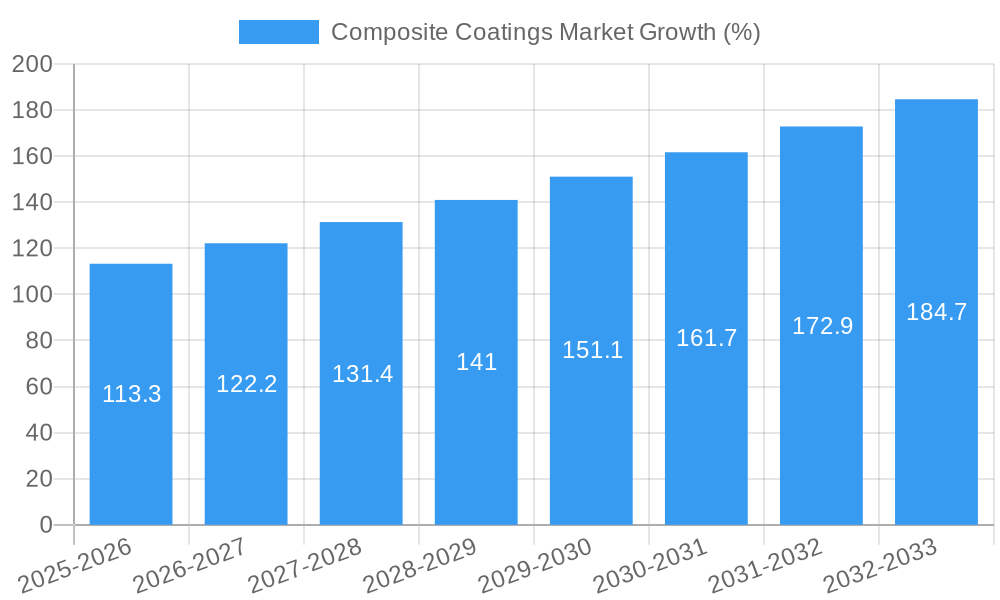
The global composite coatings market, valued at $1463.4 million in 2025, is projected to experience robust growth, driven by a compound annual growth rate (CAGR) of 7.9% from 2025 to 2033. This expansion is fueled by several key factors. The increasing demand for lightweight yet durable materials in the automotive and transportation sectors is a significant driver, as composite coatings enhance the performance and longevity of these vehicles. Furthermore, the burgeoning infrastructure development globally, particularly in emerging economies, necessitates protective and aesthetically pleasing coatings for various structures, further boosting market growth. Advancements in coating technologies, such as the adoption of more sustainable and environmentally friendly options like water-based coatings and the development of innovative application techniques, are also contributing to market expansion. The marine industry's reliance on corrosion-resistant coatings for vessels and offshore structures presents another substantial growth opportunity. While challenges remain, such as fluctuations in raw material prices and the need for specialized application expertise, the overall market outlook remains positive, with projections indicating substantial growth throughout the forecast period.
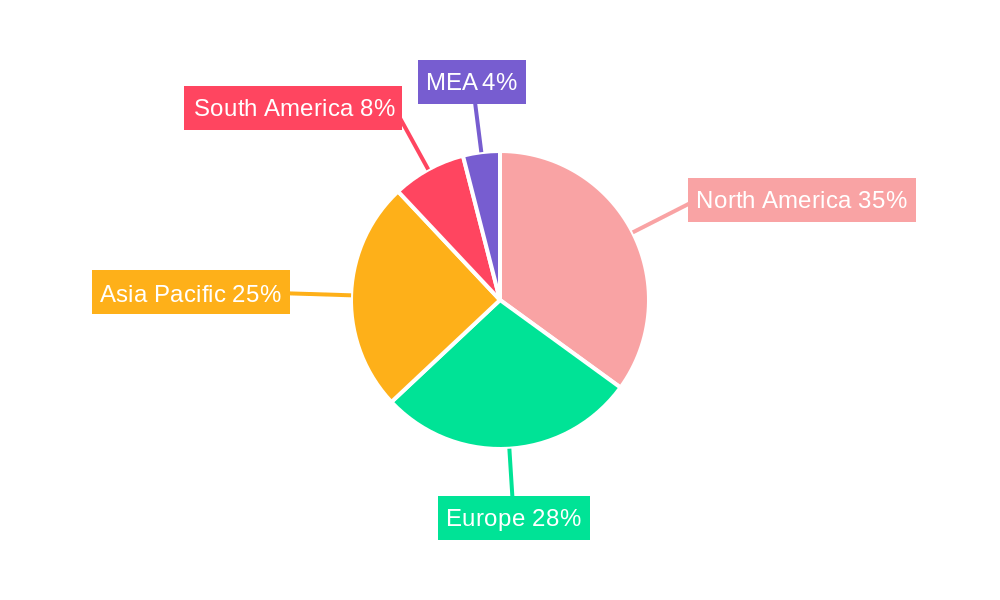
Segmentation analysis reveals a diverse market landscape. Polyester resins currently hold a significant market share due to their cost-effectiveness and versatility. However, the demand for high-performance applications is driving the growth of polyamide and epoxy resins. Laser-melt injection is a prominent application technique, favored for its precision and efficiency, though electroless plating and brazing also maintain significant market presence depending on the specific application and substrate. The end-user industries, such as automotive, marine, and infrastructure, contribute significantly to market volume, with the automotive sector projected to experience the fastest growth due to stringent vehicle emission regulations and increasing adoption of electric vehicles. Regional variations exist, with North America and Europe holding substantial market shares, driven by strong industrial bases and advanced technological capabilities. However, the Asia-Pacific region is expected to showcase the most rapid growth in the coming years due to expanding industrialization and infrastructure development.
Composite Coatings Market: A Comprehensive Analysis (2019-2033)
This in-depth report provides a comprehensive analysis of the global Composite Coatings market, offering invaluable insights for stakeholders across the value chain. The study covers the period 2019-2033, with 2025 serving as the base and estimated year. The report leverages rigorous data analysis and expert insights to deliver actionable strategies for growth and success in this dynamic market. The global market is projected to reach xx Million by 2033, exhibiting a CAGR of xx% during the forecast period (2025-2033).
Composite Coatings Market Concentration & Innovation
The Composite Coatings market exhibits a moderately concentrated landscape, with key players like The Sherwin-Williams Company, RPM International Inc, PPG Industries Inc, and AkzoNobel NV holding significant market share. However, the presence of numerous smaller players, particularly in niche segments, indicates potential for disruption. Market share data for 2024 reveals that The Sherwin-Williams Company holds approximately xx%, while RPM International Inc. commands around xx%. M&A activity has been moderate, with a total deal value of approximately xx Million in the past five years, primarily driven by strategic acquisitions aimed at expanding product portfolios and geographic reach.
- Innovation Drivers: Advancements in resin technology, particularly in high-performance polymers like polyamide and epoxy, are key drivers of innovation. Furthermore, the development of novel application techniques like laser-melt injection is enhancing the quality and efficiency of composite coating processes.
- Regulatory Frameworks: Stringent environmental regulations related to VOC emissions are influencing the adoption of eco-friendly composite coatings.
- Product Substitutes: Alternative surface treatment methods, such as powder coating and electroplating, present competitive pressure.
- End-User Trends: The growing demand for lightweight and high-strength materials across various end-use industries, including automotive and aerospace, is fueling market growth.
- M&A Activities: Recent mergers and acquisitions have focused on expanding product lines and geographical reach. For example, the acquisition of X company by Y company in 2023 expanded the market reach of Y company by xx%.
Composite Coatings Market Industry Trends & Insights
The Composite Coatings market is experiencing robust growth, primarily driven by increasing demand from the automotive, marine, and infrastructure sectors. The rising adoption of lightweight materials in vehicles and the expanding global infrastructure development projects are key growth catalysts. Technological advancements, particularly in resin formulations and application techniques, are enhancing the performance and durability of composite coatings, further boosting market demand. Consumer preferences are shifting towards environmentally friendly and sustainable options, pushing manufacturers to develop eco-conscious composite coating solutions. The market is witnessing increased competition, with both established players and new entrants vying for market share. The global market size is estimated at xx Million in 2025, with a projected CAGR of xx% from 2025 to 2033. Market penetration in the automotive sector is currently at approximately xx%, and this is expected to increase to xx% by 2033.
Dominant Markets & Segments in Composite Coatings Market
The Asia-Pacific region dominates the global Composite Coatings market, driven by rapid industrialization, particularly in China and India. These countries' robust infrastructure development initiatives, along with a booming automotive sector, are key contributors to regional growth. Within the segments, Polyester resin holds the largest market share, accounting for approximately xx% in 2025, followed by Epoxy and Polyamide resins. Electroless plating is the most widely used application technique, reflecting its cost-effectiveness and versatility. The automotive and other transportation segment is the largest end-user industry, consuming approximately xx% of the total composite coatings volume in 2025.
Key Drivers in Asia-Pacific:
- Rapid industrialization and urbanization
- Significant infrastructure development projects
- Growing automotive production
- Favorable government policies supporting industrial growth.
Dominance Analysis: The Asia-Pacific region's dominance stems from a combination of high manufacturing activity, robust government support for infrastructural projects, and a burgeoning automotive industry. This dominance is anticipated to continue throughout the forecast period.
Composite Coatings Market Product Developments
Recent product innovations focus on enhancing the performance characteristics of composite coatings, including improved corrosion resistance, scratch resistance, and UV stability. New formulations incorporating nanomaterials are being developed to enhance the mechanical properties and durability of the coatings. The market is witnessing a growing trend towards water-based and solvent-free coatings to address environmental concerns. These developments are driving the adoption of composite coatings across various applications, offering significant competitive advantages to manufacturers.
Report Scope & Segmentation Analysis
This report segments the Composite Coatings market based on resin type (Polyester, Polyamide, Epoxy, Others), application technique (Laser-melt Injection, Electroless Plating, Brazing, Others), and end-user industry (Marine, Automotive and Other Transportation, Infrastructure, Oil and Gas, Others (Including Medical)). Each segment's growth projections, market sizes, and competitive dynamics are analyzed in detail. The Polyester resin segment is projected to witness robust growth due to its cost-effectiveness and versatility. Electroless plating is expected to maintain its dominance in application techniques, while the automotive and transportation segment will continue to be the largest end-user industry. Market sizes for individual segments are detailed within the full report.
Key Drivers of Composite Coatings Market Growth
The Composite Coatings market is experiencing significant growth driven by several factors:
- Technological advancements: Innovations in resin formulations and application techniques are enhancing coating performance and durability.
- Economic growth: Rising disposable incomes and increasing investments in infrastructure projects are boosting demand.
- Stringent regulations: Stricter environmental regulations are driving the adoption of eco-friendly coatings.
Challenges in the Composite Coatings Market Sector
The Composite Coatings market faces several challenges:
- Fluctuating raw material prices: The cost of resins and other raw materials can impact profitability.
- Intense competition: The presence of numerous players creates intense competition.
- Environmental regulations: Compliance with stringent environmental regulations adds to costs.
Emerging Opportunities in Composite Coatings Market
The Composite Coatings market presents several exciting opportunities:
- Expansion into new applications: Growing demand in emerging markets offers significant potential.
- Development of high-performance coatings: Research and development in advanced materials is leading to innovation.
- Focus on sustainability: Growing preference for eco-friendly coatings creates a niche for sustainable options.
Leading Players in the Composite Coatings Market Market
- Mäder
- The Sherwin-Williams Company
- RPM International Inc
- PPG Industries Inc
- Benjamin Moore & Co
- AkzoNobel NV
- FUSION MINERAL PAINT
- KEIM Mineral Coatings of America Inc
- K C Jones Plating Company
- BEECK Mineral Paints
Key Developments in Composite Coatings Market Industry
- January 2023: PPG Industries Inc. launched a new line of high-performance composite coatings for the automotive industry.
- March 2024: AkzoNobel NV acquired a smaller composite coating manufacturer, expanding its product portfolio.
- (Further key developments will be detailed within the full report)
Strategic Outlook for Composite Coatings Market Market
The Composite Coatings market is poised for continued growth, driven by technological advancements, economic expansion, and the increasing demand for high-performance coatings across various industries. The focus on sustainability and eco-friendly solutions will further shape the market landscape. Companies that invest in R&D, expand their product portfolios, and adopt sustainable manufacturing practices are well-positioned to capitalize on the growth opportunities.
Composite Coatings Market Segmentation
-
1. Resin
- 1.1. Polyester
- 1.2. Polyamide
- 1.3. Epoxy
- 1.4. Others
-
2. Technique
- 2.1. Laser-melt Injection
- 2.2. Electroless Plating
- 2.3. Brazing
- 2.4. Others
-
3. End-User Industry
- 3.1. Marine
- 3.2. Automotive and Other Transportation
- 3.3. Infrastructure
- 3.4. Oil and Gas
- 3.5. Others (Including Medical)
Composite Coatings Market Segmentation By Geography
-
1. Asia Pacific
- 1.1. China
- 1.2. India
- 1.3. Japan
- 1.4. South Korea
- 1.5. Rest of Asia Pacific
-
2. North America
- 2.1. United States
- 2.2. Canada
- 2.3. Mexico
-
3. Europe
- 3.1. Germany
- 3.2. United Kingdom
- 3.3. Italy
- 3.4. France
- 3.5. Rest of Europe
-
4. South America
- 4.1. Brazil
- 4.2. Argentina
- 4.3. Rest of South America
- 5. Middle East
-
6. Saudi Arabia
- 6.1. South Africa
- 6.2. Rest of Middle East
Composite Coatings Market REPORT HIGHLIGHTS
| Aspects | Details |
|---|---|
| Study Period | 2019-2033 |
| Base Year | 2024 |
| Estimated Year | 2025 |
| Forecast Period | 2025-2033 |
| Historical Period | 2019-2024 |
| Growth Rate | CAGR of 7.9% from 2019-2033 |
| Segmentation |
|
Table of Contents
- 1. Introduction
- 1.1. Research Scope
- 1.2. Market Segmentation
- 1.3. Research Methodology
- 1.4. Definitions and Assumptions
- 2. Executive Summary
- 2.1. Introduction
- 3. Market Dynamics
- 3.1. Introduction
- 3.2. Market Drivers
- 3.2.1. ; Growth in Oil & Gas Exploration Activities; Others
- 3.3. Market Restrains
- 3.3.1. ; High Processing Cost
- 3.4. Market Trends
- 3.4.1. Increasing Demand for Oil and Gas
- 4. Market Factor Analysis
- 4.1. Porters Five Forces
- 4.2. Supply/Value Chain
- 4.3. PESTEL analysis
- 4.4. Market Entropy
- 4.5. Patent/Trademark Analysis
- 5. Global Composite Coatings Market Analysis, Insights and Forecast, 2019-2031
- 5.1. Market Analysis, Insights and Forecast - by Resin
- 5.1.1. Polyester
- 5.1.2. Polyamide
- 5.1.3. Epoxy
- 5.1.4. Others
- 5.2. Market Analysis, Insights and Forecast - by Technique
- 5.2.1. Laser-melt Injection
- 5.2.2. Electroless Plating
- 5.2.3. Brazing
- 5.2.4. Others
- 5.3. Market Analysis, Insights and Forecast - by End-User Industry
- 5.3.1. Marine
- 5.3.2. Automotive and Other Transportation
- 5.3.3. Infrastructure
- 5.3.4. Oil and Gas
- 5.3.5. Others (Including Medical)
- 5.4. Market Analysis, Insights and Forecast - by Region
- 5.4.1. Asia Pacific
- 5.4.2. North America
- 5.4.3. Europe
- 5.4.4. South America
- 5.4.5. Middle East
- 5.4.6. Saudi Arabia
- 5.1. Market Analysis, Insights and Forecast - by Resin
- 6. Asia Pacific Composite Coatings Market Analysis, Insights and Forecast, 2019-2031
- 6.1. Market Analysis, Insights and Forecast - by Resin
- 6.1.1. Polyester
- 6.1.2. Polyamide
- 6.1.3. Epoxy
- 6.1.4. Others
- 6.2. Market Analysis, Insights and Forecast - by Technique
- 6.2.1. Laser-melt Injection
- 6.2.2. Electroless Plating
- 6.2.3. Brazing
- 6.2.4. Others
- 6.3. Market Analysis, Insights and Forecast - by End-User Industry
- 6.3.1. Marine
- 6.3.2. Automotive and Other Transportation
- 6.3.3. Infrastructure
- 6.3.4. Oil and Gas
- 6.3.5. Others (Including Medical)
- 6.1. Market Analysis, Insights and Forecast - by Resin
- 7. North America Composite Coatings Market Analysis, Insights and Forecast, 2019-2031
- 7.1. Market Analysis, Insights and Forecast - by Resin
- 7.1.1. Polyester
- 7.1.2. Polyamide
- 7.1.3. Epoxy
- 7.1.4. Others
- 7.2. Market Analysis, Insights and Forecast - by Technique
- 7.2.1. Laser-melt Injection
- 7.2.2. Electroless Plating
- 7.2.3. Brazing
- 7.2.4. Others
- 7.3. Market Analysis, Insights and Forecast - by End-User Industry
- 7.3.1. Marine
- 7.3.2. Automotive and Other Transportation
- 7.3.3. Infrastructure
- 7.3.4. Oil and Gas
- 7.3.5. Others (Including Medical)
- 7.1. Market Analysis, Insights and Forecast - by Resin
- 8. Europe Composite Coatings Market Analysis, Insights and Forecast, 2019-2031
- 8.1. Market Analysis, Insights and Forecast - by Resin
- 8.1.1. Polyester
- 8.1.2. Polyamide
- 8.1.3. Epoxy
- 8.1.4. Others
- 8.2. Market Analysis, Insights and Forecast - by Technique
- 8.2.1. Laser-melt Injection
- 8.2.2. Electroless Plating
- 8.2.3. Brazing
- 8.2.4. Others
- 8.3. Market Analysis, Insights and Forecast - by End-User Industry
- 8.3.1. Marine
- 8.3.2. Automotive and Other Transportation
- 8.3.3. Infrastructure
- 8.3.4. Oil and Gas
- 8.3.5. Others (Including Medical)
- 8.1. Market Analysis, Insights and Forecast - by Resin
- 9. South America Composite Coatings Market Analysis, Insights and Forecast, 2019-2031
- 9.1. Market Analysis, Insights and Forecast - by Resin
- 9.1.1. Polyester
- 9.1.2. Polyamide
- 9.1.3. Epoxy
- 9.1.4. Others
- 9.2. Market Analysis, Insights and Forecast - by Technique
- 9.2.1. Laser-melt Injection
- 9.2.2. Electroless Plating
- 9.2.3. Brazing
- 9.2.4. Others
- 9.3. Market Analysis, Insights and Forecast - by End-User Industry
- 9.3.1. Marine
- 9.3.2. Automotive and Other Transportation
- 9.3.3. Infrastructure
- 9.3.4. Oil and Gas
- 9.3.5. Others (Including Medical)
- 9.1. Market Analysis, Insights and Forecast - by Resin
- 10. Middle East Composite Coatings Market Analysis, Insights and Forecast, 2019-2031
- 10.1. Market Analysis, Insights and Forecast - by Resin
- 10.1.1. Polyester
- 10.1.2. Polyamide
- 10.1.3. Epoxy
- 10.1.4. Others
- 10.2. Market Analysis, Insights and Forecast - by Technique
- 10.2.1. Laser-melt Injection
- 10.2.2. Electroless Plating
- 10.2.3. Brazing
- 10.2.4. Others
- 10.3. Market Analysis, Insights and Forecast - by End-User Industry
- 10.3.1. Marine
- 10.3.2. Automotive and Other Transportation
- 10.3.3. Infrastructure
- 10.3.4. Oil and Gas
- 10.3.5. Others (Including Medical)
- 10.1. Market Analysis, Insights and Forecast - by Resin
- 11. Saudi Arabia Composite Coatings Market Analysis, Insights and Forecast, 2019-2031
- 11.1. Market Analysis, Insights and Forecast - by Resin
- 11.1.1. Polyester
- 11.1.2. Polyamide
- 11.1.3. Epoxy
- 11.1.4. Others
- 11.2. Market Analysis, Insights and Forecast - by Technique
- 11.2.1. Laser-melt Injection
- 11.2.2. Electroless Plating
- 11.2.3. Brazing
- 11.2.4. Others
- 11.3. Market Analysis, Insights and Forecast - by End-User Industry
- 11.3.1. Marine
- 11.3.2. Automotive and Other Transportation
- 11.3.3. Infrastructure
- 11.3.4. Oil and Gas
- 11.3.5. Others (Including Medical)
- 11.1. Market Analysis, Insights and Forecast - by Resin
- 12. North America Composite Coatings Market Analysis, Insights and Forecast, 2019-2031
- 12.1. Market Analysis, Insights and Forecast - By Country/Sub-region
- 12.1.1 United States
- 12.1.2 Canada
- 12.1.3 Mexico
- 13. Europe Composite Coatings Market Analysis, Insights and Forecast, 2019-2031
- 13.1. Market Analysis, Insights and Forecast - By Country/Sub-region
- 13.1.1 Germany
- 13.1.2 France
- 13.1.3 Italy
- 13.1.4 United Kingdom
- 13.1.5 Netherlands
- 13.1.6 Rest of Europe
- 14. Asia Pacific Composite Coatings Market Analysis, Insights and Forecast, 2019-2031
- 14.1. Market Analysis, Insights and Forecast - By Country/Sub-region
- 14.1.1 China
- 14.1.2 Japan
- 14.1.3 India
- 14.1.4 South Korea
- 14.1.5 Taiwan
- 14.1.6 Australia
- 14.1.7 Rest of Asia-Pacific
- 15. South America Composite Coatings Market Analysis, Insights and Forecast, 2019-2031
- 15.1. Market Analysis, Insights and Forecast - By Country/Sub-region
- 15.1.1 Brazil
- 15.1.2 Argentina
- 15.1.3 Rest of South America
- 16. MEA Composite Coatings Market Analysis, Insights and Forecast, 2019-2031
- 16.1. Market Analysis, Insights and Forecast - By Country/Sub-region
- 16.1.1 Middle East
- 16.1.2 Africa
- 17. Competitive Analysis
- 17.1. Global Market Share Analysis 2024
- 17.2. Company Profiles
- 17.2.1 Mäder
- 17.2.1.1. Overview
- 17.2.1.2. Products
- 17.2.1.3. SWOT Analysis
- 17.2.1.4. Recent Developments
- 17.2.1.5. Financials (Based on Availability)
- 17.2.2 The Sherwin-Williams Company
- 17.2.2.1. Overview
- 17.2.2.2. Products
- 17.2.2.3. SWOT Analysis
- 17.2.2.4. Recent Developments
- 17.2.2.5. Financials (Based on Availability)
- 17.2.3 RPM International Inc
- 17.2.3.1. Overview
- 17.2.3.2. Products
- 17.2.3.3. SWOT Analysis
- 17.2.3.4. Recent Developments
- 17.2.3.5. Financials (Based on Availability)
- 17.2.4 PPG Industries Inc
- 17.2.4.1. Overview
- 17.2.4.2. Products
- 17.2.4.3. SWOT Analysis
- 17.2.4.4. Recent Developments
- 17.2.4.5. Financials (Based on Availability)
- 17.2.5 Benjamin Moore & Co
- 17.2.5.1. Overview
- 17.2.5.2. Products
- 17.2.5.3. SWOT Analysis
- 17.2.5.4. Recent Developments
- 17.2.5.5. Financials (Based on Availability)
- 17.2.6 AkzoNobel NV
- 17.2.6.1. Overview
- 17.2.6.2. Products
- 17.2.6.3. SWOT Analysis
- 17.2.6.4. Recent Developments
- 17.2.6.5. Financials (Based on Availability)
- 17.2.7 FUSION MINERAL PAINT
- 17.2.7.1. Overview
- 17.2.7.2. Products
- 17.2.7.3. SWOT Analysis
- 17.2.7.4. Recent Developments
- 17.2.7.5. Financials (Based on Availability)
- 17.2.8 KEIM Mineral Coatings of America Inc
- 17.2.8.1. Overview
- 17.2.8.2. Products
- 17.2.8.3. SWOT Analysis
- 17.2.8.4. Recent Developments
- 17.2.8.5. Financials (Based on Availability)
- 17.2.9 K C Jones Plating Company
- 17.2.9.1. Overview
- 17.2.9.2. Products
- 17.2.9.3. SWOT Analysis
- 17.2.9.4. Recent Developments
- 17.2.9.5. Financials (Based on Availability)
- 17.2.10 BEECK Mineral Paints
- 17.2.10.1. Overview
- 17.2.10.2. Products
- 17.2.10.3. SWOT Analysis
- 17.2.10.4. Recent Developments
- 17.2.10.5. Financials (Based on Availability)
- 17.2.1 Mäder
List of Figures
- Figure 1: Global Composite Coatings Market Revenue Breakdown (Million, %) by Region 2024 & 2032
- Figure 2: Global Composite Coatings Market Volume Breakdown (K Tons, %) by Region 2024 & 2032
- Figure 3: North America Composite Coatings Market Revenue (Million), by Country 2024 & 2032
- Figure 4: North America Composite Coatings Market Volume (K Tons), by Country 2024 & 2032
- Figure 5: North America Composite Coatings Market Revenue Share (%), by Country 2024 & 2032
- Figure 6: North America Composite Coatings Market Volume Share (%), by Country 2024 & 2032
- Figure 7: Europe Composite Coatings Market Revenue (Million), by Country 2024 & 2032
- Figure 8: Europe Composite Coatings Market Volume (K Tons), by Country 2024 & 2032
- Figure 9: Europe Composite Coatings Market Revenue Share (%), by Country 2024 & 2032
- Figure 10: Europe Composite Coatings Market Volume Share (%), by Country 2024 & 2032
- Figure 11: Asia Pacific Composite Coatings Market Revenue (Million), by Country 2024 & 2032
- Figure 12: Asia Pacific Composite Coatings Market Volume (K Tons), by Country 2024 & 2032
- Figure 13: Asia Pacific Composite Coatings Market Revenue Share (%), by Country 2024 & 2032
- Figure 14: Asia Pacific Composite Coatings Market Volume Share (%), by Country 2024 & 2032
- Figure 15: South America Composite Coatings Market Revenue (Million), by Country 2024 & 2032
- Figure 16: South America Composite Coatings Market Volume (K Tons), by Country 2024 & 2032
- Figure 17: South America Composite Coatings Market Revenue Share (%), by Country 2024 & 2032
- Figure 18: South America Composite Coatings Market Volume Share (%), by Country 2024 & 2032
- Figure 19: MEA Composite Coatings Market Revenue (Million), by Country 2024 & 2032
- Figure 20: MEA Composite Coatings Market Volume (K Tons), by Country 2024 & 2032
- Figure 21: MEA Composite Coatings Market Revenue Share (%), by Country 2024 & 2032
- Figure 22: MEA Composite Coatings Market Volume Share (%), by Country 2024 & 2032
- Figure 23: Asia Pacific Composite Coatings Market Revenue (Million), by Resin 2024 & 2032
- Figure 24: Asia Pacific Composite Coatings Market Volume (K Tons), by Resin 2024 & 2032
- Figure 25: Asia Pacific Composite Coatings Market Revenue Share (%), by Resin 2024 & 2032
- Figure 26: Asia Pacific Composite Coatings Market Volume Share (%), by Resin 2024 & 2032
- Figure 27: Asia Pacific Composite Coatings Market Revenue (Million), by Technique 2024 & 2032
- Figure 28: Asia Pacific Composite Coatings Market Volume (K Tons), by Technique 2024 & 2032
- Figure 29: Asia Pacific Composite Coatings Market Revenue Share (%), by Technique 2024 & 2032
- Figure 30: Asia Pacific Composite Coatings Market Volume Share (%), by Technique 2024 & 2032
- Figure 31: Asia Pacific Composite Coatings Market Revenue (Million), by End-User Industry 2024 & 2032
- Figure 32: Asia Pacific Composite Coatings Market Volume (K Tons), by End-User Industry 2024 & 2032
- Figure 33: Asia Pacific Composite Coatings Market Revenue Share (%), by End-User Industry 2024 & 2032
- Figure 34: Asia Pacific Composite Coatings Market Volume Share (%), by End-User Industry 2024 & 2032
- Figure 35: Asia Pacific Composite Coatings Market Revenue (Million), by Country 2024 & 2032
- Figure 36: Asia Pacific Composite Coatings Market Volume (K Tons), by Country 2024 & 2032
- Figure 37: Asia Pacific Composite Coatings Market Revenue Share (%), by Country 2024 & 2032
- Figure 38: Asia Pacific Composite Coatings Market Volume Share (%), by Country 2024 & 2032
- Figure 39: North America Composite Coatings Market Revenue (Million), by Resin 2024 & 2032
- Figure 40: North America Composite Coatings Market Volume (K Tons), by Resin 2024 & 2032
- Figure 41: North America Composite Coatings Market Revenue Share (%), by Resin 2024 & 2032
- Figure 42: North America Composite Coatings Market Volume Share (%), by Resin 2024 & 2032
- Figure 43: North America Composite Coatings Market Revenue (Million), by Technique 2024 & 2032
- Figure 44: North America Composite Coatings Market Volume (K Tons), by Technique 2024 & 2032
- Figure 45: North America Composite Coatings Market Revenue Share (%), by Technique 2024 & 2032
- Figure 46: North America Composite Coatings Market Volume Share (%), by Technique 2024 & 2032
- Figure 47: North America Composite Coatings Market Revenue (Million), by End-User Industry 2024 & 2032
- Figure 48: North America Composite Coatings Market Volume (K Tons), by End-User Industry 2024 & 2032
- Figure 49: North America Composite Coatings Market Revenue Share (%), by End-User Industry 2024 & 2032
- Figure 50: North America Composite Coatings Market Volume Share (%), by End-User Industry 2024 & 2032
- Figure 51: North America Composite Coatings Market Revenue (Million), by Country 2024 & 2032
- Figure 52: North America Composite Coatings Market Volume (K Tons), by Country 2024 & 2032
- Figure 53: North America Composite Coatings Market Revenue Share (%), by Country 2024 & 2032
- Figure 54: North America Composite Coatings Market Volume Share (%), by Country 2024 & 2032
- Figure 55: Europe Composite Coatings Market Revenue (Million), by Resin 2024 & 2032
- Figure 56: Europe Composite Coatings Market Volume (K Tons), by Resin 2024 & 2032
- Figure 57: Europe Composite Coatings Market Revenue Share (%), by Resin 2024 & 2032
- Figure 58: Europe Composite Coatings Market Volume Share (%), by Resin 2024 & 2032
- Figure 59: Europe Composite Coatings Market Revenue (Million), by Technique 2024 & 2032
- Figure 60: Europe Composite Coatings Market Volume (K Tons), by Technique 2024 & 2032
- Figure 61: Europe Composite Coatings Market Revenue Share (%), by Technique 2024 & 2032
- Figure 62: Europe Composite Coatings Market Volume Share (%), by Technique 2024 & 2032
- Figure 63: Europe Composite Coatings Market Revenue (Million), by End-User Industry 2024 & 2032
- Figure 64: Europe Composite Coatings Market Volume (K Tons), by End-User Industry 2024 & 2032
- Figure 65: Europe Composite Coatings Market Revenue Share (%), by End-User Industry 2024 & 2032
- Figure 66: Europe Composite Coatings Market Volume Share (%), by End-User Industry 2024 & 2032
- Figure 67: Europe Composite Coatings Market Revenue (Million), by Country 2024 & 2032
- Figure 68: Europe Composite Coatings Market Volume (K Tons), by Country 2024 & 2032
- Figure 69: Europe Composite Coatings Market Revenue Share (%), by Country 2024 & 2032
- Figure 70: Europe Composite Coatings Market Volume Share (%), by Country 2024 & 2032
- Figure 71: South America Composite Coatings Market Revenue (Million), by Resin 2024 & 2032
- Figure 72: South America Composite Coatings Market Volume (K Tons), by Resin 2024 & 2032
- Figure 73: South America Composite Coatings Market Revenue Share (%), by Resin 2024 & 2032
- Figure 74: South America Composite Coatings Market Volume Share (%), by Resin 2024 & 2032
- Figure 75: South America Composite Coatings Market Revenue (Million), by Technique 2024 & 2032
- Figure 76: South America Composite Coatings Market Volume (K Tons), by Technique 2024 & 2032
- Figure 77: South America Composite Coatings Market Revenue Share (%), by Technique 2024 & 2032
- Figure 78: South America Composite Coatings Market Volume Share (%), by Technique 2024 & 2032
- Figure 79: South America Composite Coatings Market Revenue (Million), by End-User Industry 2024 & 2032
- Figure 80: South America Composite Coatings Market Volume (K Tons), by End-User Industry 2024 & 2032
- Figure 81: South America Composite Coatings Market Revenue Share (%), by End-User Industry 2024 & 2032
- Figure 82: South America Composite Coatings Market Volume Share (%), by End-User Industry 2024 & 2032
- Figure 83: South America Composite Coatings Market Revenue (Million), by Country 2024 & 2032
- Figure 84: South America Composite Coatings Market Volume (K Tons), by Country 2024 & 2032
- Figure 85: South America Composite Coatings Market Revenue Share (%), by Country 2024 & 2032
- Figure 86: South America Composite Coatings Market Volume Share (%), by Country 2024 & 2032
- Figure 87: Middle East Composite Coatings Market Revenue (Million), by Resin 2024 & 2032
- Figure 88: Middle East Composite Coatings Market Volume (K Tons), by Resin 2024 & 2032
- Figure 89: Middle East Composite Coatings Market Revenue Share (%), by Resin 2024 & 2032
- Figure 90: Middle East Composite Coatings Market Volume Share (%), by Resin 2024 & 2032
- Figure 91: Middle East Composite Coatings Market Revenue (Million), by Technique 2024 & 2032
- Figure 92: Middle East Composite Coatings Market Volume (K Tons), by Technique 2024 & 2032
- Figure 93: Middle East Composite Coatings Market Revenue Share (%), by Technique 2024 & 2032
- Figure 94: Middle East Composite Coatings Market Volume Share (%), by Technique 2024 & 2032
- Figure 95: Middle East Composite Coatings Market Revenue (Million), by End-User Industry 2024 & 2032
- Figure 96: Middle East Composite Coatings Market Volume (K Tons), by End-User Industry 2024 & 2032
- Figure 97: Middle East Composite Coatings Market Revenue Share (%), by End-User Industry 2024 & 2032
- Figure 98: Middle East Composite Coatings Market Volume Share (%), by End-User Industry 2024 & 2032
- Figure 99: Middle East Composite Coatings Market Revenue (Million), by Country 2024 & 2032
- Figure 100: Middle East Composite Coatings Market Volume (K Tons), by Country 2024 & 2032
- Figure 101: Middle East Composite Coatings Market Revenue Share (%), by Country 2024 & 2032
- Figure 102: Middle East Composite Coatings Market Volume Share (%), by Country 2024 & 2032
- Figure 103: Saudi Arabia Composite Coatings Market Revenue (Million), by Resin 2024 & 2032
- Figure 104: Saudi Arabia Composite Coatings Market Volume (K Tons), by Resin 2024 & 2032
- Figure 105: Saudi Arabia Composite Coatings Market Revenue Share (%), by Resin 2024 & 2032
- Figure 106: Saudi Arabia Composite Coatings Market Volume Share (%), by Resin 2024 & 2032
- Figure 107: Saudi Arabia Composite Coatings Market Revenue (Million), by Technique 2024 & 2032
- Figure 108: Saudi Arabia Composite Coatings Market Volume (K Tons), by Technique 2024 & 2032
- Figure 109: Saudi Arabia Composite Coatings Market Revenue Share (%), by Technique 2024 & 2032
- Figure 110: Saudi Arabia Composite Coatings Market Volume Share (%), by Technique 2024 & 2032
- Figure 111: Saudi Arabia Composite Coatings Market Revenue (Million), by End-User Industry 2024 & 2032
- Figure 112: Saudi Arabia Composite Coatings Market Volume (K Tons), by End-User Industry 2024 & 2032
- Figure 113: Saudi Arabia Composite Coatings Market Revenue Share (%), by End-User Industry 2024 & 2032
- Figure 114: Saudi Arabia Composite Coatings Market Volume Share (%), by End-User Industry 2024 & 2032
- Figure 115: Saudi Arabia Composite Coatings Market Revenue (Million), by Country 2024 & 2032
- Figure 116: Saudi Arabia Composite Coatings Market Volume (K Tons), by Country 2024 & 2032
- Figure 117: Saudi Arabia Composite Coatings Market Revenue Share (%), by Country 2024 & 2032
- Figure 118: Saudi Arabia Composite Coatings Market Volume Share (%), by Country 2024 & 2032
List of Tables
- Table 1: Global Composite Coatings Market Revenue Million Forecast, by Region 2019 & 2032
- Table 2: Global Composite Coatings Market Volume K Tons Forecast, by Region 2019 & 2032
- Table 3: Global Composite Coatings Market Revenue Million Forecast, by Resin 2019 & 2032
- Table 4: Global Composite Coatings Market Volume K Tons Forecast, by Resin 2019 & 2032
- Table 5: Global Composite Coatings Market Revenue Million Forecast, by Technique 2019 & 2032
- Table 6: Global Composite Coatings Market Volume K Tons Forecast, by Technique 2019 & 2032
- Table 7: Global Composite Coatings Market Revenue Million Forecast, by End-User Industry 2019 & 2032
- Table 8: Global Composite Coatings Market Volume K Tons Forecast, by End-User Industry 2019 & 2032
- Table 9: Global Composite Coatings Market Revenue Million Forecast, by Region 2019 & 2032
- Table 10: Global Composite Coatings Market Volume K Tons Forecast, by Region 2019 & 2032
- Table 11: Global Composite Coatings Market Revenue Million Forecast, by Country 2019 & 2032
- Table 12: Global Composite Coatings Market Volume K Tons Forecast, by Country 2019 & 2032
- Table 13: United States Composite Coatings Market Revenue (Million) Forecast, by Application 2019 & 2032
- Table 14: United States Composite Coatings Market Volume (K Tons) Forecast, by Application 2019 & 2032
- Table 15: Canada Composite Coatings Market Revenue (Million) Forecast, by Application 2019 & 2032
- Table 16: Canada Composite Coatings Market Volume (K Tons) Forecast, by Application 2019 & 2032
- Table 17: Mexico Composite Coatings Market Revenue (Million) Forecast, by Application 2019 & 2032
- Table 18: Mexico Composite Coatings Market Volume (K Tons) Forecast, by Application 2019 & 2032
- Table 19: Global Composite Coatings Market Revenue Million Forecast, by Country 2019 & 2032
- Table 20: Global Composite Coatings Market Volume K Tons Forecast, by Country 2019 & 2032
- Table 21: Germany Composite Coatings Market Revenue (Million) Forecast, by Application 2019 & 2032
- Table 22: Germany Composite Coatings Market Volume (K Tons) Forecast, by Application 2019 & 2032
- Table 23: France Composite Coatings Market Revenue (Million) Forecast, by Application 2019 & 2032
- Table 24: France Composite Coatings Market Volume (K Tons) Forecast, by Application 2019 & 2032
- Table 25: Italy Composite Coatings Market Revenue (Million) Forecast, by Application 2019 & 2032
- Table 26: Italy Composite Coatings Market Volume (K Tons) Forecast, by Application 2019 & 2032
- Table 27: United Kingdom Composite Coatings Market Revenue (Million) Forecast, by Application 2019 & 2032
- Table 28: United Kingdom Composite Coatings Market Volume (K Tons) Forecast, by Application 2019 & 2032
- Table 29: Netherlands Composite Coatings Market Revenue (Million) Forecast, by Application 2019 & 2032
- Table 30: Netherlands Composite Coatings Market Volume (K Tons) Forecast, by Application 2019 & 2032
- Table 31: Rest of Europe Composite Coatings Market Revenue (Million) Forecast, by Application 2019 & 2032
- Table 32: Rest of Europe Composite Coatings Market Volume (K Tons) Forecast, by Application 2019 & 2032
- Table 33: Global Composite Coatings Market Revenue Million Forecast, by Country 2019 & 2032
- Table 34: Global Composite Coatings Market Volume K Tons Forecast, by Country 2019 & 2032
- Table 35: China Composite Coatings Market Revenue (Million) Forecast, by Application 2019 & 2032
- Table 36: China Composite Coatings Market Volume (K Tons) Forecast, by Application 2019 & 2032
- Table 37: Japan Composite Coatings Market Revenue (Million) Forecast, by Application 2019 & 2032
- Table 38: Japan Composite Coatings Market Volume (K Tons) Forecast, by Application 2019 & 2032
- Table 39: India Composite Coatings Market Revenue (Million) Forecast, by Application 2019 & 2032
- Table 40: India Composite Coatings Market Volume (K Tons) Forecast, by Application 2019 & 2032
- Table 41: South Korea Composite Coatings Market Revenue (Million) Forecast, by Application 2019 & 2032
- Table 42: South Korea Composite Coatings Market Volume (K Tons) Forecast, by Application 2019 & 2032
- Table 43: Taiwan Composite Coatings Market Revenue (Million) Forecast, by Application 2019 & 2032
- Table 44: Taiwan Composite Coatings Market Volume (K Tons) Forecast, by Application 2019 & 2032
- Table 45: Australia Composite Coatings Market Revenue (Million) Forecast, by Application 2019 & 2032
- Table 46: Australia Composite Coatings Market Volume (K Tons) Forecast, by Application 2019 & 2032
- Table 47: Rest of Asia-Pacific Composite Coatings Market Revenue (Million) Forecast, by Application 2019 & 2032
- Table 48: Rest of Asia-Pacific Composite Coatings Market Volume (K Tons) Forecast, by Application 2019 & 2032
- Table 49: Global Composite Coatings Market Revenue Million Forecast, by Country 2019 & 2032
- Table 50: Global Composite Coatings Market Volume K Tons Forecast, by Country 2019 & 2032
- Table 51: Brazil Composite Coatings Market Revenue (Million) Forecast, by Application 2019 & 2032
- Table 52: Brazil Composite Coatings Market Volume (K Tons) Forecast, by Application 2019 & 2032
- Table 53: Argentina Composite Coatings Market Revenue (Million) Forecast, by Application 2019 & 2032
- Table 54: Argentina Composite Coatings Market Volume (K Tons) Forecast, by Application 2019 & 2032
- Table 55: Rest of South America Composite Coatings Market Revenue (Million) Forecast, by Application 2019 & 2032
- Table 56: Rest of South America Composite Coatings Market Volume (K Tons) Forecast, by Application 2019 & 2032
- Table 57: Global Composite Coatings Market Revenue Million Forecast, by Country 2019 & 2032
- Table 58: Global Composite Coatings Market Volume K Tons Forecast, by Country 2019 & 2032
- Table 59: Middle East Composite Coatings Market Revenue (Million) Forecast, by Application 2019 & 2032
- Table 60: Middle East Composite Coatings Market Volume (K Tons) Forecast, by Application 2019 & 2032
- Table 61: Africa Composite Coatings Market Revenue (Million) Forecast, by Application 2019 & 2032
- Table 62: Africa Composite Coatings Market Volume (K Tons) Forecast, by Application 2019 & 2032
- Table 63: Global Composite Coatings Market Revenue Million Forecast, by Resin 2019 & 2032
- Table 64: Global Composite Coatings Market Volume K Tons Forecast, by Resin 2019 & 2032
- Table 65: Global Composite Coatings Market Revenue Million Forecast, by Technique 2019 & 2032
- Table 66: Global Composite Coatings Market Volume K Tons Forecast, by Technique 2019 & 2032
- Table 67: Global Composite Coatings Market Revenue Million Forecast, by End-User Industry 2019 & 2032
- Table 68: Global Composite Coatings Market Volume K Tons Forecast, by End-User Industry 2019 & 2032
- Table 69: Global Composite Coatings Market Revenue Million Forecast, by Country 2019 & 2032
- Table 70: Global Composite Coatings Market Volume K Tons Forecast, by Country 2019 & 2032
- Table 71: China Composite Coatings Market Revenue (Million) Forecast, by Application 2019 & 2032
- Table 72: China Composite Coatings Market Volume (K Tons) Forecast, by Application 2019 & 2032
- Table 73: India Composite Coatings Market Revenue (Million) Forecast, by Application 2019 & 2032
- Table 74: India Composite Coatings Market Volume (K Tons) Forecast, by Application 2019 & 2032
- Table 75: Japan Composite Coatings Market Revenue (Million) Forecast, by Application 2019 & 2032
- Table 76: Japan Composite Coatings Market Volume (K Tons) Forecast, by Application 2019 & 2032
- Table 77: South Korea Composite Coatings Market Revenue (Million) Forecast, by Application 2019 & 2032
- Table 78: South Korea Composite Coatings Market Volume (K Tons) Forecast, by Application 2019 & 2032
- Table 79: Rest of Asia Pacific Composite Coatings Market Revenue (Million) Forecast, by Application 2019 & 2032
- Table 80: Rest of Asia Pacific Composite Coatings Market Volume (K Tons) Forecast, by Application 2019 & 2032
- Table 81: Global Composite Coatings Market Revenue Million Forecast, by Resin 2019 & 2032
- Table 82: Global Composite Coatings Market Volume K Tons Forecast, by Resin 2019 & 2032
- Table 83: Global Composite Coatings Market Revenue Million Forecast, by Technique 2019 & 2032
- Table 84: Global Composite Coatings Market Volume K Tons Forecast, by Technique 2019 & 2032
- Table 85: Global Composite Coatings Market Revenue Million Forecast, by End-User Industry 2019 & 2032
- Table 86: Global Composite Coatings Market Volume K Tons Forecast, by End-User Industry 2019 & 2032
- Table 87: Global Composite Coatings Market Revenue Million Forecast, by Country 2019 & 2032
- Table 88: Global Composite Coatings Market Volume K Tons Forecast, by Country 2019 & 2032
- Table 89: United States Composite Coatings Market Revenue (Million) Forecast, by Application 2019 & 2032
- Table 90: United States Composite Coatings Market Volume (K Tons) Forecast, by Application 2019 & 2032
- Table 91: Canada Composite Coatings Market Revenue (Million) Forecast, by Application 2019 & 2032
- Table 92: Canada Composite Coatings Market Volume (K Tons) Forecast, by Application 2019 & 2032
- Table 93: Mexico Composite Coatings Market Revenue (Million) Forecast, by Application 2019 & 2032
- Table 94: Mexico Composite Coatings Market Volume (K Tons) Forecast, by Application 2019 & 2032
- Table 95: Global Composite Coatings Market Revenue Million Forecast, by Resin 2019 & 2032
- Table 96: Global Composite Coatings Market Volume K Tons Forecast, by Resin 2019 & 2032
- Table 97: Global Composite Coatings Market Revenue Million Forecast, by Technique 2019 & 2032
- Table 98: Global Composite Coatings Market Volume K Tons Forecast, by Technique 2019 & 2032
- Table 99: Global Composite Coatings Market Revenue Million Forecast, by End-User Industry 2019 & 2032
- Table 100: Global Composite Coatings Market Volume K Tons Forecast, by End-User Industry 2019 & 2032
- Table 101: Global Composite Coatings Market Revenue Million Forecast, by Country 2019 & 2032
- Table 102: Global Composite Coatings Market Volume K Tons Forecast, by Country 2019 & 2032
- Table 103: Germany Composite Coatings Market Revenue (Million) Forecast, by Application 2019 & 2032
- Table 104: Germany Composite Coatings Market Volume (K Tons) Forecast, by Application 2019 & 2032
- Table 105: United Kingdom Composite Coatings Market Revenue (Million) Forecast, by Application 2019 & 2032
- Table 106: United Kingdom Composite Coatings Market Volume (K Tons) Forecast, by Application 2019 & 2032
- Table 107: Italy Composite Coatings Market Revenue (Million) Forecast, by Application 2019 & 2032
- Table 108: Italy Composite Coatings Market Volume (K Tons) Forecast, by Application 2019 & 2032
- Table 109: France Composite Coatings Market Revenue (Million) Forecast, by Application 2019 & 2032
- Table 110: France Composite Coatings Market Volume (K Tons) Forecast, by Application 2019 & 2032
- Table 111: Rest of Europe Composite Coatings Market Revenue (Million) Forecast, by Application 2019 & 2032
- Table 112: Rest of Europe Composite Coatings Market Volume (K Tons) Forecast, by Application 2019 & 2032
- Table 113: Global Composite Coatings Market Revenue Million Forecast, by Resin 2019 & 2032
- Table 114: Global Composite Coatings Market Volume K Tons Forecast, by Resin 2019 & 2032
- Table 115: Global Composite Coatings Market Revenue Million Forecast, by Technique 2019 & 2032
- Table 116: Global Composite Coatings Market Volume K Tons Forecast, by Technique 2019 & 2032
- Table 117: Global Composite Coatings Market Revenue Million Forecast, by End-User Industry 2019 & 2032
- Table 118: Global Composite Coatings Market Volume K Tons Forecast, by End-User Industry 2019 & 2032
- Table 119: Global Composite Coatings Market Revenue Million Forecast, by Country 2019 & 2032
- Table 120: Global Composite Coatings Market Volume K Tons Forecast, by Country 2019 & 2032
- Table 121: Brazil Composite Coatings Market Revenue (Million) Forecast, by Application 2019 & 2032
- Table 122: Brazil Composite Coatings Market Volume (K Tons) Forecast, by Application 2019 & 2032
- Table 123: Argentina Composite Coatings Market Revenue (Million) Forecast, by Application 2019 & 2032
- Table 124: Argentina Composite Coatings Market Volume (K Tons) Forecast, by Application 2019 & 2032
- Table 125: Rest of South America Composite Coatings Market Revenue (Million) Forecast, by Application 2019 & 2032
- Table 126: Rest of South America Composite Coatings Market Volume (K Tons) Forecast, by Application 2019 & 2032
- Table 127: Global Composite Coatings Market Revenue Million Forecast, by Resin 2019 & 2032
- Table 128: Global Composite Coatings Market Volume K Tons Forecast, by Resin 2019 & 2032
- Table 129: Global Composite Coatings Market Revenue Million Forecast, by Technique 2019 & 2032
- Table 130: Global Composite Coatings Market Volume K Tons Forecast, by Technique 2019 & 2032
- Table 131: Global Composite Coatings Market Revenue Million Forecast, by End-User Industry 2019 & 2032
- Table 132: Global Composite Coatings Market Volume K Tons Forecast, by End-User Industry 2019 & 2032
- Table 133: Global Composite Coatings Market Revenue Million Forecast, by Country 2019 & 2032
- Table 134: Global Composite Coatings Market Volume K Tons Forecast, by Country 2019 & 2032
- Table 135: Global Composite Coatings Market Revenue Million Forecast, by Resin 2019 & 2032
- Table 136: Global Composite Coatings Market Volume K Tons Forecast, by Resin 2019 & 2032
- Table 137: Global Composite Coatings Market Revenue Million Forecast, by Technique 2019 & 2032
- Table 138: Global Composite Coatings Market Volume K Tons Forecast, by Technique 2019 & 2032
- Table 139: Global Composite Coatings Market Revenue Million Forecast, by End-User Industry 2019 & 2032
- Table 140: Global Composite Coatings Market Volume K Tons Forecast, by End-User Industry 2019 & 2032
- Table 141: Global Composite Coatings Market Revenue Million Forecast, by Country 2019 & 2032
- Table 142: Global Composite Coatings Market Volume K Tons Forecast, by Country 2019 & 2032
- Table 143: South Africa Composite Coatings Market Revenue (Million) Forecast, by Application 2019 & 2032
- Table 144: South Africa Composite Coatings Market Volume (K Tons) Forecast, by Application 2019 & 2032
- Table 145: Rest of Middle East Composite Coatings Market Revenue (Million) Forecast, by Application 2019 & 2032
- Table 146: Rest of Middle East Composite Coatings Market Volume (K Tons) Forecast, by Application 2019 & 2032
Frequently Asked Questions
1. What is the projected Compound Annual Growth Rate (CAGR) of the Composite Coatings Market?
The projected CAGR is approximately 7.9%.
2. Which companies are prominent players in the Composite Coatings Market?
Key companies in the market include Mäder, The Sherwin-Williams Company, RPM International Inc, PPG Industries Inc, Benjamin Moore & Co, AkzoNobel NV, FUSION MINERAL PAINT, KEIM Mineral Coatings of America Inc, K C Jones Plating Company, BEECK Mineral Paints.
3. What are the main segments of the Composite Coatings Market?
The market segments include Resin, Technique, End-User Industry.
4. Can you provide details about the market size?
The market size is estimated to be USD 1463.4 Million as of 2022.
5. What are some drivers contributing to market growth?
; Growth in Oil & Gas Exploration Activities; Others.
6. What are the notable trends driving market growth?
Increasing Demand for Oil and Gas.
7. Are there any restraints impacting market growth?
; High Processing Cost.
8. Can you provide examples of recent developments in the market?
N/A
9. What pricing options are available for accessing the report?
Pricing options include single-user, multi-user, and enterprise licenses priced at USD 3,950, USD 4,950, and USD 6,950 respectively.
10. Is the market size provided in terms of value or volume?
The market size is provided in terms of value, measured in Million and volume, measured in K Tons.
11. Are there any specific market keywords associated with the report?
Yes, the market keyword associated with the report is "Composite Coatings Market," which aids in identifying and referencing the specific market segment covered.
12. How do I determine which pricing option suits my needs best?
The pricing options vary based on user requirements and access needs. Individual users may opt for single-user licenses, while businesses requiring broader access may choose multi-user or enterprise licenses for cost-effective access to the report.
13. Are there any additional resources or data provided in the Composite Coatings Market report?
While the report offers comprehensive insights, it's advisable to review the specific contents or supplementary materials provided to ascertain if additional resources or data are available.
14. How can I stay updated on further developments or reports in the Composite Coatings Market?
To stay informed about further developments, trends, and reports in the Composite Coatings Market, consider subscribing to industry newsletters, following relevant companies and organizations, or regularly checking reputable industry news sources and publications.
Methodology
Step 1 - Identification of Relevant Samples Size from Population Database


Step 2 - Approaches for Defining Global Market Size (Value, Volume* & Price*)

Note*: In applicable scenarios
Step 3 - Data Sources
Primary Research
- Web Analytics
- Survey Reports
- Research Institute
- Latest Research Reports
- Opinion Leaders
Secondary Research
- Annual Reports
- White Paper
- Latest Press Release
- Industry Association
- Paid Database
- Investor Presentations

Step 4 - Data Triangulation
Involves using different sources of information in order to increase the validity of a study
These sources are likely to be stakeholders in a program - participants, other researchers, program staff, other community members, and so on.
Then we put all data in single framework & apply various statistical tools to find out the dynamic on the market.
During the analysis stage, feedback from the stakeholder groups would be compared to determine areas of agreement as well as areas of divergence


