Key Insights
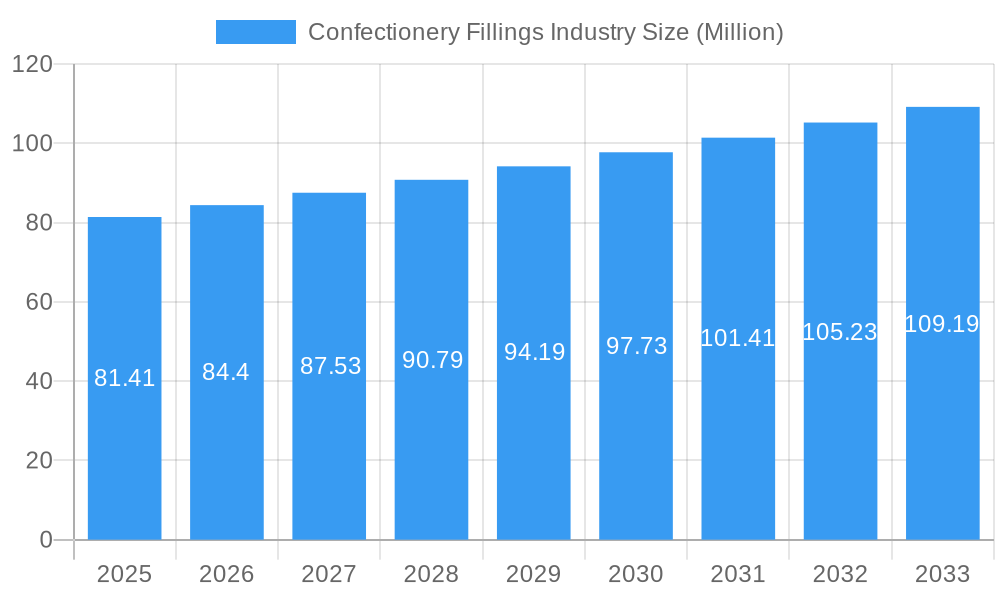
The confectionery fillings market, valued at $81.41 million in 2025, is projected to experience steady growth, driven by increasing consumer demand for diverse and premium confectionery products. A Compound Annual Growth Rate (CAGR) of 3.44% from 2025 to 2033 indicates a healthy expansion, fueled by several key factors. The rising popularity of gourmet chocolates, innovative flavor profiles, and the growing preference for healthier, natural ingredients are significant drivers. The market is segmented into key ingredient categories: dairy ingredients, sweeteners, flavors, oils & shortenings, emulsifiers, and others, each contributing to the overall market size and growth trajectory. Major players like ADM, DuPont, Cargill, Kerry, Tate & Lyle, Ingredion, and Olam International are shaping the market landscape through innovation and strategic partnerships. Geographic expansion, particularly in Asia-Pacific and South America, offers promising growth avenues due to rising disposable incomes and changing consumer preferences. However, fluctuations in raw material prices and stringent regulatory requirements pose challenges to sustained growth.
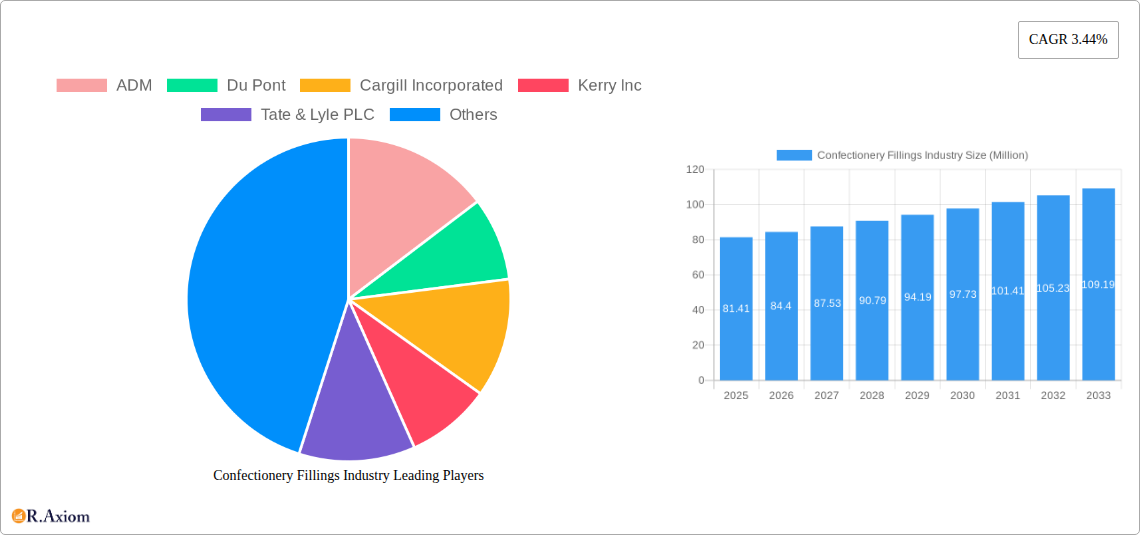
Confectionery Fillings Industry Market Size (In Million)
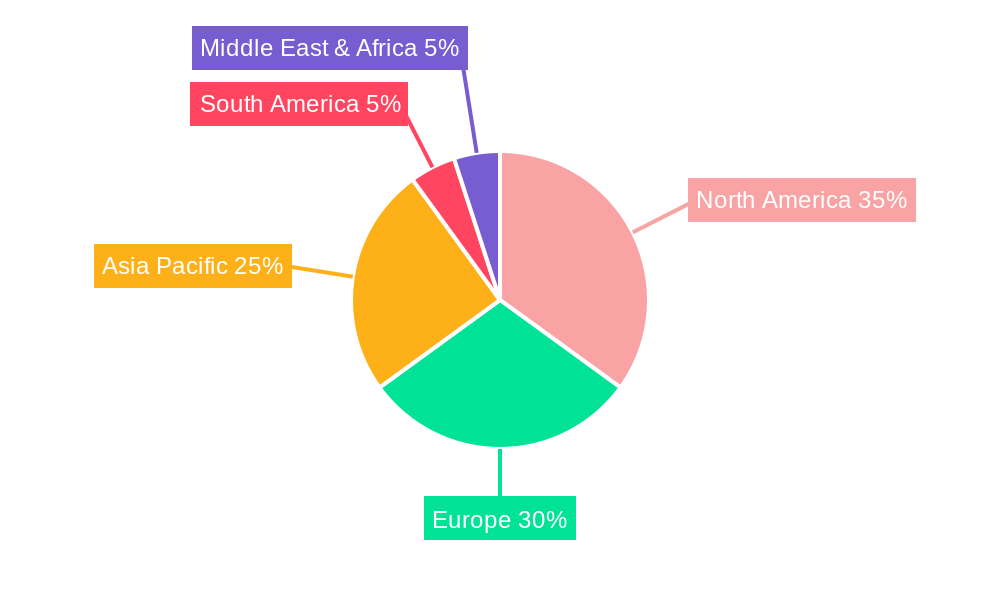
The market's regional distribution reflects varying consumption patterns. North America, with its established confectionery industry, holds a significant market share. Europe follows closely, with strong demand in Western European countries. Rapid economic development and expanding middle classes in Asia-Pacific are contributing to substantial growth in this region. South America, while currently a smaller market, presents considerable potential for future expansion. The market is expected to witness continuous innovation in product development, focusing on clean-label ingredients, unique flavor combinations, and functional benefits, shaping the future trajectory of the confectionery fillings industry. Companies are investing in R&D to meet the increasing consumer demand for healthier, sustainable, and ethically sourced ingredients.
Confectionery Fillings Industry Company Market Share
Confectionery Fillings Industry: A Comprehensive Market Report (2019-2033)
This in-depth report provides a comprehensive analysis of the global confectionery fillings industry, covering market size, segmentation, growth drivers, challenges, and key players. The study period spans from 2019 to 2033, with 2025 serving as both the base and estimated year. The report offers invaluable insights for industry stakeholders, including manufacturers, suppliers, distributors, and investors, enabling informed strategic decision-making. The market is projected to reach xx Million by 2033, exhibiting a CAGR of xx% during the forecast period (2025-2033).
Confectionery Fillings Industry Market Concentration & Innovation
This section analyzes the competitive landscape of the confectionery fillings market, examining market concentration, innovation drivers, regulatory frameworks, and industry dynamics. Key players such as ADM, DuPont, Cargill Incorporated, Kerry Inc, Tate & Lyle PLC, Ingredion Incorporated, Olam International, and others, compete intensely, leading to a moderately concentrated market. Market share data for 2024 reveals that the top five players hold approximately xx% of the market. Innovation is driven by consumer demand for healthier and more natural options, with companies investing heavily in R&D to develop novel fillings. Regulatory frameworks concerning labeling, ingredient sourcing, and food safety significantly impact the industry. The substitution of traditional ingredients with healthier alternatives is driving some changes in the landscape. M&A activities, while not extremely frequent, are focused on expanding product portfolios and gaining access to new technologies. Recent M&A deal values averaged xx Million, reflecting strategic consolidation within the sector.
Confectionery Fillings Industry Industry Trends & Insights
The confectionery fillings market is experiencing significant growth, fueled by rising consumer spending on confectionery products and the increasing demand for innovative and premium fillings. The market’s CAGR is projected to be xx% from 2025 to 2033. Technological advancements, such as improved processing techniques and the development of novel ingredients, are driving innovation and expanding the range of available fillings. Consumer preferences are shifting towards healthier and more natural options, leading to an increased demand for fillings with reduced sugar content, natural flavors, and functional ingredients. The market faces increasing competitive pressure from both established players and new entrants, which will lead to heightened innovation and potentially lower profit margins. The market penetration rate of novel fillings (e.g., plant-based options) is expected to increase from xx% in 2025 to xx% by 2033.
Dominant Markets & Segments in Confectionery Fillings Industry
The confectionery fillings market exhibits regional variations, with [Region Name] currently dominating the global market. This dominance is driven by factors such as strong economic growth, well-developed infrastructure, and a large and growing consumer base.
- Key Drivers for [Region Name]'s Dominance:
- High per capita consumption of confectionery products.
- Robust economic growth and disposable incomes.
- Well-established distribution networks.
- Supportive government policies promoting the food industry.
In terms of segment analysis by type:
- Dairy Ingredients: This segment holds the largest market share, driven by the widespread preference for creamy and indulgent fillings. Growth is projected to be moderate due to increasing health consciousness.
- Sweeteners: This segment is experiencing strong growth, fueled by the demand for both traditional and alternative sweeteners. The market is highly dynamic due to changes in consumer preferences and health regulations.
- Flavors: The flavors segment is characterized by a high level of innovation, as companies continuously introduce new and exciting flavor profiles to cater to changing consumer tastes.
- Oils & Shortenings: This segment provides essential textural properties to fillings. Growth is linked to the overall growth of the confectionery industry.
- Emulsifiers: Essential for creating stable and smooth fillings, this segment is expected to experience steady growth.
- Others: This includes various other ingredients and additives, offering a niche but steadily growing market segment.
Confectionery Fillings Industry Product Developments
Recent product innovations focus on healthier and more natural options. The use of plant-based alternatives, reduced sugar formulations, and functional ingredients (e.g., probiotics) are key trends. These innovations are primarily driven by the growing health consciousness of consumers and evolving regulatory requirements. The market fit of these new products is strong, as they address the increasing demand for healthier confectionery options.
Report Scope & Segmentation Analysis
This report provides a comprehensive segmentation of the confectionery fillings market based on type: Dairy Ingredients, Sweeteners, Flavors, Oils & Shortenings, Emulsifiers, and Others. Each segment is analyzed in terms of market size, growth projections, and competitive dynamics. For example, the Dairy Ingredients segment is projected to grow at a xx% CAGR, while the Sweeteners segment is expected to exhibit a xx% CAGR over the forecast period. Competitive intensity varies across segments, with some experiencing greater competition than others.
Key Drivers of Confectionery Fillings Industry Growth
The confectionery fillings market is driven by several factors, including:
- Rising consumer disposable incomes: Increased purchasing power fuels demand for premium and indulgent confectionery products.
- Technological advancements: Improved processing technologies and ingredient innovations expand the range of available fillings.
- Changing consumer preferences: The demand for healthier, natural, and innovative fillings is driving growth.
- Growing popularity of confectionery products: The confectionery industry's continued expansion creates a larger market for fillings.
Challenges in the Confectionery Fillings Industry Sector
Several challenges hinder the growth of the confectionery fillings industry:
- Fluctuating raw material prices: Volatility in the prices of key ingredients impacts profitability.
- Stringent regulatory requirements: Compliance with food safety and labeling regulations adds to costs.
- Intense competition: The market is highly competitive, putting pressure on margins.
- Health concerns: Growing health consciousness among consumers impacts demand for high-sugar and unhealthy fillings.
Emerging Opportunities in Confectionery Fillings Industry
The confectionery fillings market offers several emerging opportunities:
- Growth in emerging markets: Expanding into developing countries with growing consumer bases presents significant potential.
- Development of novel and functional fillings: Innovations catering to specific health needs (e.g., diabetic-friendly options) are gaining traction.
- Sustainable and ethically sourced ingredients: Consumers are increasingly demanding sustainable and environmentally friendly products.
- Customization and personalization: Offering customized fillings tailored to individual preferences opens new avenues for growth.
Leading Players in the Confectionery Fillings Industry Market
- ADM
- Du Pont
- Cargill Incorporated
- Kerry Inc
- Tate & Lyle PLC
- Ingredion Incorporated
- Olam International
Key Developments in Confectionery Fillings Industry Industry
- January 2023: ADM launched a new line of plant-based confectionery fillings.
- June 2022: Cargill Incorporated acquired a smaller confectionery fillings manufacturer, expanding its market share.
- October 2021: Tate & Lyle PLC introduced a new range of reduced-sugar confectionery fillings. (Further developments to be added based on available data)
Strategic Outlook for Confectionery Fillings Industry Market
The confectionery fillings market is poised for continued growth, driven by evolving consumer preferences, technological advancements, and expansion into new markets. Companies focusing on innovation, sustainability, and health-conscious offerings will be best positioned to succeed. The market’s future potential is significant, with ample opportunities for both established players and new entrants. The focus on natural, clean-label ingredients, and reduced-sugar options will be crucial for future success.
Confectionery Fillings Industry Segmentation
-
1. Type
- 1.1. Dairy Ingredients
- 1.2. Sweeteners
- 1.3. Flavors
- 1.4. Oils & Shortenings
- 1.5. Emulsifiers
- 1.6. Others
Confectionery Fillings Industry Segmentation By Geography
-
1. North America
- 1.1. United States
- 1.2. Canada
- 1.3. Mexico
- 1.4. Rest of North America
-
2. Europe
- 2.1. United Kingdom
- 2.2. Germany
- 2.3. France
- 2.4. Russia
- 2.5. Italy
- 2.6. Spain
- 2.7. Rest of Europe
-
3. Asia Pacific
- 3.1. India
- 3.2. China
- 3.3. Japan
- 3.4. Australia
- 3.5. Rest of Asia Pacific
-
4. South America
- 4.1. Brazil
- 4.2. Argentina
- 4.3. Rest of South America
- 5. Middle East
-
6. South Africa
- 6.1. Saudi Arabia
- 6.2. Rest of Middle East
Confectionery Fillings Industry Regional Market Share
Geographic Coverage of Confectionery Fillings Industry
Confectionery Fillings Industry REPORT HIGHLIGHTS
| Aspects | Details |
|---|---|
| Study Period | 2020-2034 |
| Base Year | 2025 |
| Estimated Year | 2026 |
| Forecast Period | 2026-2034 |
| Historical Period | 2020-2025 |
| Growth Rate | CAGR of 3.44% from 2020-2034 |
| Segmentation |
|
Table of Contents
- 1. Introduction
- 1.1. Research Scope
- 1.2. Market Segmentation
- 1.3. Research Methodology
- 1.4. Definitions and Assumptions
- 2. Executive Summary
- 2.1. Introduction
- 3. Market Dynamics
- 3.1. Introduction
- 3.2. Market Drivers
- 3.2.1. Increasing Demand for Low-Fat and Low-Calorie Food; Increasing Product Innovation
- 3.3. Market Restrains
- 3.3.1. ; Threat of New Entrants; Bargaining Power of Buyers/Consumers; Bargaining Power of Suppliers; Threat of Substitute Products; Degree Of Competition
- 3.4. Market Trends
- 3.4.1. Rising Demand For Flavored Confectioneries
- 4. Market Factor Analysis
- 4.1. Porters Five Forces
- 4.2. Supply/Value Chain
- 4.3. PESTEL analysis
- 4.4. Market Entropy
- 4.5. Patent/Trademark Analysis
- 5. Global Confectionery Fillings Industry Analysis, Insights and Forecast, 2020-2032
- 5.1. Market Analysis, Insights and Forecast - by Type
- 5.1.1. Dairy Ingredients
- 5.1.2. Sweeteners
- 5.1.3. Flavors
- 5.1.4. Oils & Shortenings
- 5.1.5. Emulsifiers
- 5.1.6. Others
- 5.2. Market Analysis, Insights and Forecast - by Region
- 5.2.1. North America
- 5.2.2. Europe
- 5.2.3. Asia Pacific
- 5.2.4. South America
- 5.2.5. Middle East
- 5.2.6. South Africa
- 5.1. Market Analysis, Insights and Forecast - by Type
- 6. North America Confectionery Fillings Industry Analysis, Insights and Forecast, 2020-2032
- 6.1. Market Analysis, Insights and Forecast - by Type
- 6.1.1. Dairy Ingredients
- 6.1.2. Sweeteners
- 6.1.3. Flavors
- 6.1.4. Oils & Shortenings
- 6.1.5. Emulsifiers
- 6.1.6. Others
- 6.1. Market Analysis, Insights and Forecast - by Type
- 7. Europe Confectionery Fillings Industry Analysis, Insights and Forecast, 2020-2032
- 7.1. Market Analysis, Insights and Forecast - by Type
- 7.1.1. Dairy Ingredients
- 7.1.2. Sweeteners
- 7.1.3. Flavors
- 7.1.4. Oils & Shortenings
- 7.1.5. Emulsifiers
- 7.1.6. Others
- 7.1. Market Analysis, Insights and Forecast - by Type
- 8. Asia Pacific Confectionery Fillings Industry Analysis, Insights and Forecast, 2020-2032
- 8.1. Market Analysis, Insights and Forecast - by Type
- 8.1.1. Dairy Ingredients
- 8.1.2. Sweeteners
- 8.1.3. Flavors
- 8.1.4. Oils & Shortenings
- 8.1.5. Emulsifiers
- 8.1.6. Others
- 8.1. Market Analysis, Insights and Forecast - by Type
- 9. South America Confectionery Fillings Industry Analysis, Insights and Forecast, 2020-2032
- 9.1. Market Analysis, Insights and Forecast - by Type
- 9.1.1. Dairy Ingredients
- 9.1.2. Sweeteners
- 9.1.3. Flavors
- 9.1.4. Oils & Shortenings
- 9.1.5. Emulsifiers
- 9.1.6. Others
- 9.1. Market Analysis, Insights and Forecast - by Type
- 10. Middle East Confectionery Fillings Industry Analysis, Insights and Forecast, 2020-2032
- 10.1. Market Analysis, Insights and Forecast - by Type
- 10.1.1. Dairy Ingredients
- 10.1.2. Sweeteners
- 10.1.3. Flavors
- 10.1.4. Oils & Shortenings
- 10.1.5. Emulsifiers
- 10.1.6. Others
- 10.1. Market Analysis, Insights and Forecast - by Type
- 11. South Africa Confectionery Fillings Industry Analysis, Insights and Forecast, 2020-2032
- 11.1. Market Analysis, Insights and Forecast - by Type
- 11.1.1. Dairy Ingredients
- 11.1.2. Sweeteners
- 11.1.3. Flavors
- 11.1.4. Oils & Shortenings
- 11.1.5. Emulsifiers
- 11.1.6. Others
- 11.1. Market Analysis, Insights and Forecast - by Type
- 12. Competitive Analysis
- 12.1. Global Market Share Analysis 2025
- 12.2. Company Profiles
- 12.2.1 ADM
- 12.2.1.1. Overview
- 12.2.1.2. Products
- 12.2.1.3. SWOT Analysis
- 12.2.1.4. Recent Developments
- 12.2.1.5. Financials (Based on Availability)
- 12.2.2 Du Pont
- 12.2.2.1. Overview
- 12.2.2.2. Products
- 12.2.2.3. SWOT Analysis
- 12.2.2.4. Recent Developments
- 12.2.2.5. Financials (Based on Availability)
- 12.2.3 Cargill Incorporated
- 12.2.3.1. Overview
- 12.2.3.2. Products
- 12.2.3.3. SWOT Analysis
- 12.2.3.4. Recent Developments
- 12.2.3.5. Financials (Based on Availability)
- 12.2.4 Kerry Inc
- 12.2.4.1. Overview
- 12.2.4.2. Products
- 12.2.4.3. SWOT Analysis
- 12.2.4.4. Recent Developments
- 12.2.4.5. Financials (Based on Availability)
- 12.2.5 Tate & Lyle PLC
- 12.2.5.1. Overview
- 12.2.5.2. Products
- 12.2.5.3. SWOT Analysis
- 12.2.5.4. Recent Developments
- 12.2.5.5. Financials (Based on Availability)
- 12.2.6 Ingredion Incorporated*List Not Exhaustive
- 12.2.6.1. Overview
- 12.2.6.2. Products
- 12.2.6.3. SWOT Analysis
- 12.2.6.4. Recent Developments
- 12.2.6.5. Financials (Based on Availability)
- 12.2.7 Olam International
- 12.2.7.1. Overview
- 12.2.7.2. Products
- 12.2.7.3. SWOT Analysis
- 12.2.7.4. Recent Developments
- 12.2.7.5. Financials (Based on Availability)
- 12.2.1 ADM
List of Figures
- Figure 1: Global Confectionery Fillings Industry Revenue Breakdown (Million, %) by Region 2025 & 2033
- Figure 2: North America Confectionery Fillings Industry Revenue (Million), by Type 2025 & 2033
- Figure 3: North America Confectionery Fillings Industry Revenue Share (%), by Type 2025 & 2033
- Figure 4: North America Confectionery Fillings Industry Revenue (Million), by Country 2025 & 2033
- Figure 5: North America Confectionery Fillings Industry Revenue Share (%), by Country 2025 & 2033
- Figure 6: Europe Confectionery Fillings Industry Revenue (Million), by Type 2025 & 2033
- Figure 7: Europe Confectionery Fillings Industry Revenue Share (%), by Type 2025 & 2033
- Figure 8: Europe Confectionery Fillings Industry Revenue (Million), by Country 2025 & 2033
- Figure 9: Europe Confectionery Fillings Industry Revenue Share (%), by Country 2025 & 2033
- Figure 10: Asia Pacific Confectionery Fillings Industry Revenue (Million), by Type 2025 & 2033
- Figure 11: Asia Pacific Confectionery Fillings Industry Revenue Share (%), by Type 2025 & 2033
- Figure 12: Asia Pacific Confectionery Fillings Industry Revenue (Million), by Country 2025 & 2033
- Figure 13: Asia Pacific Confectionery Fillings Industry Revenue Share (%), by Country 2025 & 2033
- Figure 14: South America Confectionery Fillings Industry Revenue (Million), by Type 2025 & 2033
- Figure 15: South America Confectionery Fillings Industry Revenue Share (%), by Type 2025 & 2033
- Figure 16: South America Confectionery Fillings Industry Revenue (Million), by Country 2025 & 2033
- Figure 17: South America Confectionery Fillings Industry Revenue Share (%), by Country 2025 & 2033
- Figure 18: Middle East Confectionery Fillings Industry Revenue (Million), by Type 2025 & 2033
- Figure 19: Middle East Confectionery Fillings Industry Revenue Share (%), by Type 2025 & 2033
- Figure 20: Middle East Confectionery Fillings Industry Revenue (Million), by Country 2025 & 2033
- Figure 21: Middle East Confectionery Fillings Industry Revenue Share (%), by Country 2025 & 2033
- Figure 22: South Africa Confectionery Fillings Industry Revenue (Million), by Type 2025 & 2033
- Figure 23: South Africa Confectionery Fillings Industry Revenue Share (%), by Type 2025 & 2033
- Figure 24: South Africa Confectionery Fillings Industry Revenue (Million), by Country 2025 & 2033
- Figure 25: South Africa Confectionery Fillings Industry Revenue Share (%), by Country 2025 & 2033
List of Tables
- Table 1: Global Confectionery Fillings Industry Revenue Million Forecast, by Type 2020 & 2033
- Table 2: Global Confectionery Fillings Industry Revenue Million Forecast, by Region 2020 & 2033
- Table 3: Global Confectionery Fillings Industry Revenue Million Forecast, by Type 2020 & 2033
- Table 4: Global Confectionery Fillings Industry Revenue Million Forecast, by Country 2020 & 2033
- Table 5: United States Confectionery Fillings Industry Revenue (Million) Forecast, by Application 2020 & 2033
- Table 6: Canada Confectionery Fillings Industry Revenue (Million) Forecast, by Application 2020 & 2033
- Table 7: Mexico Confectionery Fillings Industry Revenue (Million) Forecast, by Application 2020 & 2033
- Table 8: Rest of North America Confectionery Fillings Industry Revenue (Million) Forecast, by Application 2020 & 2033
- Table 9: Global Confectionery Fillings Industry Revenue Million Forecast, by Type 2020 & 2033
- Table 10: Global Confectionery Fillings Industry Revenue Million Forecast, by Country 2020 & 2033
- Table 11: United Kingdom Confectionery Fillings Industry Revenue (Million) Forecast, by Application 2020 & 2033
- Table 12: Germany Confectionery Fillings Industry Revenue (Million) Forecast, by Application 2020 & 2033
- Table 13: France Confectionery Fillings Industry Revenue (Million) Forecast, by Application 2020 & 2033
- Table 14: Russia Confectionery Fillings Industry Revenue (Million) Forecast, by Application 2020 & 2033
- Table 15: Italy Confectionery Fillings Industry Revenue (Million) Forecast, by Application 2020 & 2033
- Table 16: Spain Confectionery Fillings Industry Revenue (Million) Forecast, by Application 2020 & 2033
- Table 17: Rest of Europe Confectionery Fillings Industry Revenue (Million) Forecast, by Application 2020 & 2033
- Table 18: Global Confectionery Fillings Industry Revenue Million Forecast, by Type 2020 & 2033
- Table 19: Global Confectionery Fillings Industry Revenue Million Forecast, by Country 2020 & 2033
- Table 20: India Confectionery Fillings Industry Revenue (Million) Forecast, by Application 2020 & 2033
- Table 21: China Confectionery Fillings Industry Revenue (Million) Forecast, by Application 2020 & 2033
- Table 22: Japan Confectionery Fillings Industry Revenue (Million) Forecast, by Application 2020 & 2033
- Table 23: Australia Confectionery Fillings Industry Revenue (Million) Forecast, by Application 2020 & 2033
- Table 24: Rest of Asia Pacific Confectionery Fillings Industry Revenue (Million) Forecast, by Application 2020 & 2033
- Table 25: Global Confectionery Fillings Industry Revenue Million Forecast, by Type 2020 & 2033
- Table 26: Global Confectionery Fillings Industry Revenue Million Forecast, by Country 2020 & 2033
- Table 27: Brazil Confectionery Fillings Industry Revenue (Million) Forecast, by Application 2020 & 2033
- Table 28: Argentina Confectionery Fillings Industry Revenue (Million) Forecast, by Application 2020 & 2033
- Table 29: Rest of South America Confectionery Fillings Industry Revenue (Million) Forecast, by Application 2020 & 2033
- Table 30: Global Confectionery Fillings Industry Revenue Million Forecast, by Type 2020 & 2033
- Table 31: Global Confectionery Fillings Industry Revenue Million Forecast, by Country 2020 & 2033
- Table 32: Global Confectionery Fillings Industry Revenue Million Forecast, by Type 2020 & 2033
- Table 33: Global Confectionery Fillings Industry Revenue Million Forecast, by Country 2020 & 2033
- Table 34: Saudi Arabia Confectionery Fillings Industry Revenue (Million) Forecast, by Application 2020 & 2033
- Table 35: Rest of Middle East Confectionery Fillings Industry Revenue (Million) Forecast, by Application 2020 & 2033
Frequently Asked Questions
1. What is the projected Compound Annual Growth Rate (CAGR) of the Confectionery Fillings Industry?
The projected CAGR is approximately 3.44%.
2. Which companies are prominent players in the Confectionery Fillings Industry?
Key companies in the market include ADM, Du Pont, Cargill Incorporated, Kerry Inc, Tate & Lyle PLC, Ingredion Incorporated*List Not Exhaustive, Olam International.
3. What are the main segments of the Confectionery Fillings Industry?
The market segments include Type.
4. Can you provide details about the market size?
The market size is estimated to be USD 81.41 Million as of 2022.
5. What are some drivers contributing to market growth?
Increasing Demand for Low-Fat and Low-Calorie Food; Increasing Product Innovation.
6. What are the notable trends driving market growth?
Rising Demand For Flavored Confectioneries.
7. Are there any restraints impacting market growth?
; Threat of New Entrants; Bargaining Power of Buyers/Consumers; Bargaining Power of Suppliers; Threat of Substitute Products; Degree Of Competition.
8. Can you provide examples of recent developments in the market?
N/A
9. What pricing options are available for accessing the report?
Pricing options include single-user, multi-user, and enterprise licenses priced at USD 4750, USD 5250, and USD 8750 respectively.
10. Is the market size provided in terms of value or volume?
The market size is provided in terms of value, measured in Million.
11. Are there any specific market keywords associated with the report?
Yes, the market keyword associated with the report is "Confectionery Fillings Industry," which aids in identifying and referencing the specific market segment covered.
12. How do I determine which pricing option suits my needs best?
The pricing options vary based on user requirements and access needs. Individual users may opt for single-user licenses, while businesses requiring broader access may choose multi-user or enterprise licenses for cost-effective access to the report.
13. Are there any additional resources or data provided in the Confectionery Fillings Industry report?
While the report offers comprehensive insights, it's advisable to review the specific contents or supplementary materials provided to ascertain if additional resources or data are available.
14. How can I stay updated on further developments or reports in the Confectionery Fillings Industry?
To stay informed about further developments, trends, and reports in the Confectionery Fillings Industry, consider subscribing to industry newsletters, following relevant companies and organizations, or regularly checking reputable industry news sources and publications.
Methodology
Step 1 - Identification of Relevant Samples Size from Population Database


Step 2 - Approaches for Defining Global Market Size (Value, Volume* & Price*)

Note*: In applicable scenarios
Step 3 - Data Sources
Primary Research
- Web Analytics
- Survey Reports
- Research Institute
- Latest Research Reports
- Opinion Leaders
Secondary Research
- Annual Reports
- White Paper
- Latest Press Release
- Industry Association
- Paid Database
- Investor Presentations

Step 4 - Data Triangulation
Involves using different sources of information in order to increase the validity of a study
These sources are likely to be stakeholders in a program - participants, other researchers, program staff, other community members, and so on.
Then we put all data in single framework & apply various statistical tools to find out the dynamic on the market.
During the analysis stage, feedback from the stakeholder groups would be compared to determine areas of agreement as well as areas of divergence

