Key Insights
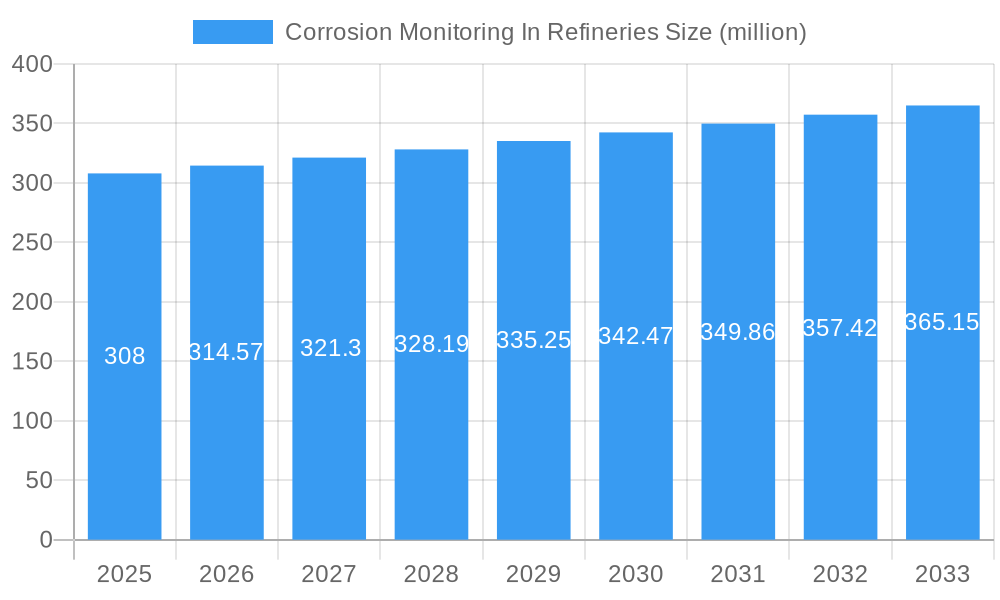
The global corrosion monitoring market in refineries is a $308 million industry (2025 estimated value) projected to grow at a CAGR of 1.9% from 2025 to 2033. This steady growth reflects the ongoing need for robust corrosion management within the refining sector to ensure operational safety, prevent costly equipment failures, and maintain regulatory compliance. Key drivers include increasingly stringent environmental regulations, the aging infrastructure of many refineries necessitating proactive monitoring, and the rising adoption of advanced technologies such as wireless sensor networks and sophisticated data analytics for improved corrosion detection and mitigation. While the market faces some restraints, such as the high initial investment costs associated with implementing comprehensive monitoring systems and the potential for integration challenges with existing refinery infrastructure, the long-term benefits of preventing catastrophic failures and extending the lifespan of critical assets significantly outweigh these challenges. The market's segmentation is likely diverse, encompassing various technologies (electrochemical sensors, ultrasonic testing, etc.), service offerings (installation, maintenance, data analysis), and specific applications within refinery processes (pipelines, tanks, vessels). The competitive landscape is populated by both established players like Honeywell, Emerson, and Baker Hughes, and specialized providers such as ClampOn and Orisonic Technology, indicating a market with opportunities for both large corporations and innovative niche players.
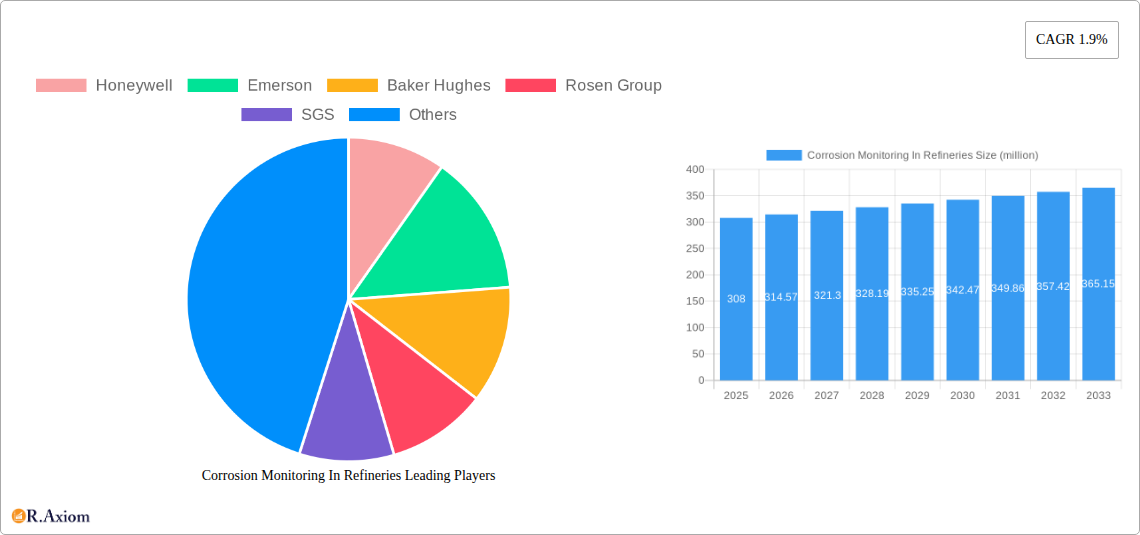
Corrosion Monitoring In Refineries Market Size (In Million)
The continued growth in the refining industry, particularly in developing economies, will further fuel demand for effective corrosion monitoring solutions. Furthermore, the increasing focus on predictive maintenance strategies, leveraging real-time data from corrosion monitoring systems, promises to enhance operational efficiency and reduce downtime. Future growth will likely be influenced by technological advancements, specifically in areas such as improved sensor accuracy, wireless communication capabilities, and the development of more user-friendly data analysis tools. The consolidation of smaller companies through mergers and acquisitions also presents a potential trend shaping the competitive landscape. Companies are also likely to focus on developing integrated solutions that combine various monitoring technologies and data analysis capabilities to offer more comprehensive and cost-effective corrosion management services to refineries worldwide.
Corrosion Monitoring In Refineries Company Market Share
Corrosion Monitoring in Refineries Market Report: 2019-2033
This comprehensive report provides an in-depth analysis of the global Corrosion Monitoring in Refineries market, offering valuable insights for industry stakeholders, investors, and strategic decision-makers. The report covers the period from 2019 to 2033, with a focus on the forecast period from 2025 to 2033, using 2025 as the base year and estimated year. The market is valued at $XX million in 2025 and is projected to reach $XX million by 2033, exhibiting a CAGR of XX% during the forecast period.
Corrosion Monitoring In Refineries Market Concentration & Innovation
This section analyzes the competitive landscape of the Corrosion Monitoring in Refineries market, focusing on market concentration, innovation drivers, regulatory frameworks, product substitutes, end-user trends, and M&A activities. The market is moderately concentrated, with several major players holding significant market share. Honeywell, Emerson, and Baker Hughes are among the leading companies, each commanding a market share between XX% and XX%. Smaller players like Rosen Group, SGS, and others collectively account for the remaining share. The total market value of M&A deals in the sector between 2019 and 2024 is estimated at $XX million.
- Innovation Drivers: Advancements in sensor technology, data analytics, and cloud-based platforms are driving innovation. The demand for real-time monitoring and predictive maintenance is fueling the development of sophisticated corrosion monitoring systems.
- Regulatory Frameworks: Stringent environmental regulations and safety standards are pushing refineries to adopt advanced corrosion monitoring solutions to minimize risks and ensure operational efficiency.
- Product Substitutes: While corrosion monitoring remains the most effective method, some refineries might utilize alternative methods like regular inspections, but these are less efficient and cost-effective.
- End-User Trends: Refineries are increasingly adopting integrated solutions that combine corrosion monitoring with other asset management systems to optimize operations and maintenance strategies.
- M&A Activities: Consolidation is expected to continue, driven by the need for broader technological expertise and market reach.
Corrosion Monitoring In Refineries Industry Trends & Insights
The global Corrosion Monitoring in Refineries market is experiencing robust growth, driven by several factors. The increasing complexity of refinery operations, coupled with the need to enhance safety and extend the lifespan of critical assets, is driving demand for advanced corrosion monitoring systems. The rising adoption of digitalization and Industry 4.0 technologies is also contributing to market growth. Technological advancements like wireless sensor networks, improved data analytics, and the development of predictive maintenance algorithms are revolutionizing the industry. Consumer preference is shifting towards integrated solutions that provide comprehensive data analysis and predictive capabilities. Competitive dynamics are intense, with key players focusing on product innovation, strategic partnerships, and acquisitions to gain a competitive edge.
Market penetration of advanced corrosion monitoring technologies remains relatively low in some regions, presenting significant growth opportunities. The market is expected to witness a considerable expansion in regions with a large concentration of refineries and a growing focus on safety and environmental compliance.
Dominant Markets & Segments in Corrosion Monitoring In Refineries
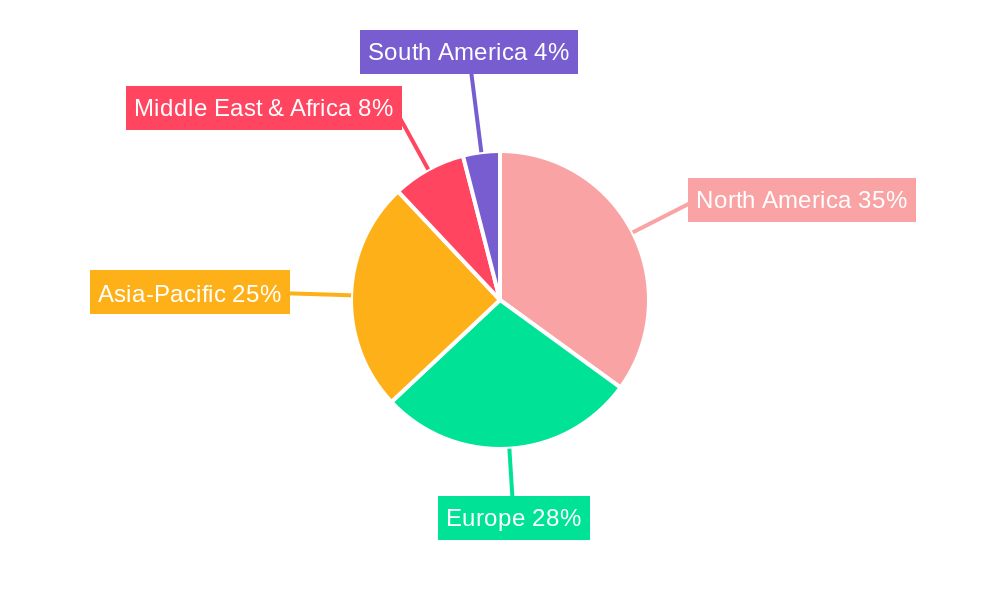
The North American market currently holds a leading position in the Corrosion Monitoring in Refineries sector. This dominance can be attributed to several factors:
- Stringent Regulations: North America has stringent environmental and safety regulations for refineries, necessitating the use of advanced corrosion monitoring systems.
- High Investment in Infrastructure: Significant investments in refinery infrastructure and modernization projects are driving the demand for sophisticated monitoring solutions.
- Technological Advancements: North America is a hub for innovation in corrosion monitoring technologies, with several leading companies having their headquarters and R&D facilities in the region.
Other significant markets include Europe and Asia Pacific, each showing robust growth driven by similar factors, though perhaps with slightly varying regulatory pressures and levels of investment in infrastructure.
Corrosion Monitoring In Refineries Product Developments
Recent product innovations in the Corrosion Monitoring in Refineries market include the development of wireless sensor networks, improved data analytics capabilities, and the integration of artificial intelligence for predictive maintenance. These advancements are leading to more efficient and accurate corrosion monitoring systems, resulting in improved safety and reduced operational costs. The market is witnessing a shift from traditional, wired systems to wireless solutions, offering greater flexibility and ease of installation.
Report Scope & Segmentation Analysis
This report segments the Corrosion Monitoring in Refineries market based on technology (e.g., electrochemical sensors, ultrasonic sensors, etc.), application (e.g., pipelines, tanks, vessels, etc.), and region. Each segment exhibits unique growth trajectories and competitive dynamics. The electrochemical sensor segment is anticipated to dominate the market owing to its wide applications and relatively lower costs compared to others. The pipeline application segment is expected to hold the largest market share due to the extensive pipeline networks in the refining industry.
Key Drivers of Corrosion Monitoring In Refineries Growth
The growth of the Corrosion Monitoring in Refineries market is primarily driven by the following:
- Stringent safety and environmental regulations mandate the implementation of effective corrosion monitoring systems to prevent catastrophic failures and environmental damage.
- Increasing operational efficiency is achieved through better maintenance scheduling and asset life extension enabled by accurate corrosion monitoring data.
- Technological advancements are continually improving the accuracy, reliability, and cost-effectiveness of corrosion monitoring systems, making them more accessible to a wider range of refineries.
Challenges in the Corrosion Monitoring In Refineries Sector
The Corrosion Monitoring in Refineries sector faces challenges such as:
- High initial investment costs associated with the implementation of advanced monitoring systems can deter some smaller refineries.
- Complex data analysis requires skilled personnel and specialized software for interpretation and effective utilization of the collected data.
- Maintaining system reliability in harsh environments necessitates robust system design and regular maintenance procedures.
Emerging Opportunities in Corrosion Monitoring In Refineries
Emerging opportunities in this sector include:
- Expansion into developing countries: A significant potential for growth exists in regions with burgeoning refining industries and a growing emphasis on safety and environmental concerns.
- Integration with other asset management systems: The integration of corrosion monitoring data with other refinery management systems can enhance operational efficiency and predictive maintenance capabilities.
- Development of advanced analytics and AI-based solutions: This offers the ability to predict corrosion rates and optimize maintenance schedules more effectively.
Leading Players in the Corrosion Monitoring In Refineries Market
- Honeywell
- Emerson
- Baker Hughes
- Rosen Group
- SGS
- DNV Group
- Applus+
- TÜV Rheinland
- Sensor Networks
- Intertek
- Cosasco
- Sensorlink
- Sentry
- ZKwell
- ClampOn
- Orisonic Technology
Key Developments in Corrosion Monitoring In Refineries Industry
- Q3 2022: Honeywell launched a new corrosion monitoring system with enhanced AI-powered predictive capabilities.
- Q1 2023: Emerson acquired a smaller corrosion monitoring company, expanding its product portfolio and market reach.
- Q4 2024: Several companies announced partnerships to integrate their corrosion monitoring solutions with other asset management platforms.
(Note: Specific dates and details of M&A activities are estimated where not publicly available.)
Strategic Outlook for Corrosion Monitoring In Refineries Market
The Corrosion Monitoring in Refineries market is poised for significant growth in the coming years, driven by the ongoing need for enhanced safety, improved operational efficiency, and compliance with increasingly stringent environmental regulations. The adoption of advanced technologies, including AI and machine learning, will further drive innovation and market expansion. Strategic partnerships and acquisitions will continue to reshape the competitive landscape, with a focus on providing integrated solutions that cater to the evolving needs of refineries worldwide. The focus on predictive maintenance and digitalization will remain key growth catalysts for the sector.
Corrosion Monitoring In Refineries Segmentation
-
1. Application
- 1.1. Pipeline
- 1.2. Equipment
- 1.3. Other
-
2. Type
- 2.1. Intrusive Corrosion Monitoring
- 2.2. Non-intrusive Corrosion Monitoring
Corrosion Monitoring In Refineries Segmentation By Geography
-
1. North America
- 1.1. United States
- 1.2. Canada
- 1.3. Mexico
-
2. South America
- 2.1. Brazil
- 2.2. Argentina
- 2.3. Rest of South America
-
3. Europe
- 3.1. United Kingdom
- 3.2. Germany
- 3.3. France
- 3.4. Italy
- 3.5. Spain
- 3.6. Russia
- 3.7. Benelux
- 3.8. Nordics
- 3.9. Rest of Europe
-
4. Middle East & Africa
- 4.1. Turkey
- 4.2. Israel
- 4.3. GCC
- 4.4. North Africa
- 4.5. South Africa
- 4.6. Rest of Middle East & Africa
-
5. Asia Pacific
- 5.1. China
- 5.2. India
- 5.3. Japan
- 5.4. South Korea
- 5.5. ASEAN
- 5.6. Oceania
- 5.7. Rest of Asia Pacific
Corrosion Monitoring In Refineries Regional Market Share
Geographic Coverage of Corrosion Monitoring In Refineries
Corrosion Monitoring In Refineries REPORT HIGHLIGHTS
| Aspects | Details |
|---|---|
| Study Period | 2020-2034 |
| Base Year | 2025 |
| Estimated Year | 2026 |
| Forecast Period | 2026-2034 |
| Historical Period | 2020-2025 |
| Growth Rate | CAGR of 1.9% from 2020-2034 |
| Segmentation |
|
Table of Contents
- 1. Introduction
- 1.1. Research Scope
- 1.2. Market Segmentation
- 1.3. Research Objective
- 1.4. Definitions and Assumptions
- 2. Executive Summary
- 2.1. Market Snapshot
- 3. Market Dynamics
- 3.1. Market Drivers
- 3.2. Market Restrains
- 3.3. Market Trends
- 3.4. Market Opportunities
- 4. Market Factor Analysis
- 4.1. Porters Five Forces
- 4.1.1. Bargaining Power of Suppliers
- 4.1.2. Bargaining Power of Buyers
- 4.1.3. Threat of New Entrants
- 4.1.4. Threat of Substitutes
- 4.1.5. Competitive Rivalry
- 4.2. PESTEL analysis
- 4.3. BCG Analysis
- 4.3.1. Stars (High Growth, High Market Share)
- 4.3.2. Cash Cows (Low Growth, High Market Share)
- 4.3.3. Question Mark (High Growth, Low Market Share)
- 4.3.4. Dogs (Low Growth, Low Market Share)
- 4.4. Ansoff Matrix Analysis
- 4.5. Supply Chain Analysis
- 4.6. Regulatory Landscape
- 4.7. Current Market Potential and Opportunity Assessment (TAM–SAM–SOM Framework)
- 4.8. RAX Analyst Note
- 4.1. Porters Five Forces
- 5. Market Analysis, Insights and Forecast 2021-2033
- 5.1. Market Analysis, Insights and Forecast - by Application
- 5.1.1. Pipeline
- 5.1.2. Equipment
- 5.1.3. Other
- 5.2. Market Analysis, Insights and Forecast - by Type
- 5.2.1. Intrusive Corrosion Monitoring
- 5.2.2. Non-intrusive Corrosion Monitoring
- 5.3. Market Analysis, Insights and Forecast - by Region
- 5.3.1. North America
- 5.3.2. South America
- 5.3.3. Europe
- 5.3.4. Middle East & Africa
- 5.3.5. Asia Pacific
- 5.1. Market Analysis, Insights and Forecast - by Application
- 6. Global Corrosion Monitoring In Refineries Analysis, Insights and Forecast, 2021-2033
- 6.1. Market Analysis, Insights and Forecast - by Application
- 6.1.1. Pipeline
- 6.1.2. Equipment
- 6.1.3. Other
- 6.2. Market Analysis, Insights and Forecast - by Type
- 6.2.1. Intrusive Corrosion Monitoring
- 6.2.2. Non-intrusive Corrosion Monitoring
- 6.1. Market Analysis, Insights and Forecast - by Application
- 7. North America Corrosion Monitoring In Refineries Analysis, Insights and Forecast, 2020-2032
- 7.1. Market Analysis, Insights and Forecast - by Application
- 7.1.1. Pipeline
- 7.1.2. Equipment
- 7.1.3. Other
- 7.2. Market Analysis, Insights and Forecast - by Type
- 7.2.1. Intrusive Corrosion Monitoring
- 7.2.2. Non-intrusive Corrosion Monitoring
- 7.1. Market Analysis, Insights and Forecast - by Application
- 8. South America Corrosion Monitoring In Refineries Analysis, Insights and Forecast, 2020-2032
- 8.1. Market Analysis, Insights and Forecast - by Application
- 8.1.1. Pipeline
- 8.1.2. Equipment
- 8.1.3. Other
- 8.2. Market Analysis, Insights and Forecast - by Type
- 8.2.1. Intrusive Corrosion Monitoring
- 8.2.2. Non-intrusive Corrosion Monitoring
- 8.1. Market Analysis, Insights and Forecast - by Application
- 9. Europe Corrosion Monitoring In Refineries Analysis, Insights and Forecast, 2020-2032
- 9.1. Market Analysis, Insights and Forecast - by Application
- 9.1.1. Pipeline
- 9.1.2. Equipment
- 9.1.3. Other
- 9.2. Market Analysis, Insights and Forecast - by Type
- 9.2.1. Intrusive Corrosion Monitoring
- 9.2.2. Non-intrusive Corrosion Monitoring
- 9.1. Market Analysis, Insights and Forecast - by Application
- 10. Middle East & Africa Corrosion Monitoring In Refineries Analysis, Insights and Forecast, 2020-2032
- 10.1. Market Analysis, Insights and Forecast - by Application
- 10.1.1. Pipeline
- 10.1.2. Equipment
- 10.1.3. Other
- 10.2. Market Analysis, Insights and Forecast - by Type
- 10.2.1. Intrusive Corrosion Monitoring
- 10.2.2. Non-intrusive Corrosion Monitoring
- 10.1. Market Analysis, Insights and Forecast - by Application
- 11. Asia Pacific Corrosion Monitoring In Refineries Analysis, Insights and Forecast, 2020-2032
- 11.1. Market Analysis, Insights and Forecast - by Application
- 11.1.1. Pipeline
- 11.1.2. Equipment
- 11.1.3. Other
- 11.2. Market Analysis, Insights and Forecast - by Type
- 11.2.1. Intrusive Corrosion Monitoring
- 11.2.2. Non-intrusive Corrosion Monitoring
- 11.1. Market Analysis, Insights and Forecast - by Application
- 12. Competitive Analysis
- 12.1. Company Profiles
- 12.1.1 Honeywell
- 12.1.1.1. Company Overview
- 12.1.1.2. Products
- 12.1.1.3. Company Financials
- 12.1.1.4. SWOT Analysis
- 12.1.2 Emerson
- 12.1.2.1. Company Overview
- 12.1.2.2. Products
- 12.1.2.3. Company Financials
- 12.1.2.4. SWOT Analysis
- 12.1.3 Baker Hughes
- 12.1.3.1. Company Overview
- 12.1.3.2. Products
- 12.1.3.3. Company Financials
- 12.1.3.4. SWOT Analysis
- 12.1.4 Rosen Group
- 12.1.4.1. Company Overview
- 12.1.4.2. Products
- 12.1.4.3. Company Financials
- 12.1.4.4. SWOT Analysis
- 12.1.5 SGS
- 12.1.5.1. Company Overview
- 12.1.5.2. Products
- 12.1.5.3. Company Financials
- 12.1.5.4. SWOT Analysis
- 12.1.6 DNV Group
- 12.1.6.1. Company Overview
- 12.1.6.2. Products
- 12.1.6.3. Company Financials
- 12.1.6.4. SWOT Analysis
- 12.1.7 Applus+
- 12.1.7.1. Company Overview
- 12.1.7.2. Products
- 12.1.7.3. Company Financials
- 12.1.7.4. SWOT Analysis
- 12.1.8 TÜV Rheinland
- 12.1.8.1. Company Overview
- 12.1.8.2. Products
- 12.1.8.3. Company Financials
- 12.1.8.4. SWOT Analysis
- 12.1.9 Sensor Networks
- 12.1.9.1. Company Overview
- 12.1.9.2. Products
- 12.1.9.3. Company Financials
- 12.1.9.4. SWOT Analysis
- 12.1.10 Intertek
- 12.1.10.1. Company Overview
- 12.1.10.2. Products
- 12.1.10.3. Company Financials
- 12.1.10.4. SWOT Analysis
- 12.1.11 Cosasco
- 12.1.11.1. Company Overview
- 12.1.11.2. Products
- 12.1.11.3. Company Financials
- 12.1.11.4. SWOT Analysis
- 12.1.12 Sensorlink
- 12.1.12.1. Company Overview
- 12.1.12.2. Products
- 12.1.12.3. Company Financials
- 12.1.12.4. SWOT Analysis
- 12.1.13 Sentry
- 12.1.13.1. Company Overview
- 12.1.13.2. Products
- 12.1.13.3. Company Financials
- 12.1.13.4. SWOT Analysis
- 12.1.14 ZKwell
- 12.1.14.1. Company Overview
- 12.1.14.2. Products
- 12.1.14.3. Company Financials
- 12.1.14.4. SWOT Analysis
- 12.1.15 ClampOn
- 12.1.15.1. Company Overview
- 12.1.15.2. Products
- 12.1.15.3. Company Financials
- 12.1.15.4. SWOT Analysis
- 12.1.16 Orisonic Technology
- 12.1.16.1. Company Overview
- 12.1.16.2. Products
- 12.1.16.3. Company Financials
- 12.1.16.4. SWOT Analysis
- 12.1.1 Honeywell
- 12.2. Market Entropy
- 12.2.1 Company's Key Areas Served
- 12.2.2 Recent Developments
- 12.3. Company Market Share Analysis 2025
- 12.3.1 Top 5 Companies Market Share Analysis
- 12.3.2 Top 3 Companies Market Share Analysis
- 12.4. List of Potential Customers
- 13. Research Methodology
List of Figures
- Figure 1: Global Corrosion Monitoring In Refineries Revenue Breakdown (million, %) by Region 2025 & 2033
- Figure 2: North America Corrosion Monitoring In Refineries Revenue (million), by Application 2025 & 2033
- Figure 3: North America Corrosion Monitoring In Refineries Revenue Share (%), by Application 2025 & 2033
- Figure 4: North America Corrosion Monitoring In Refineries Revenue (million), by Type 2025 & 2033
- Figure 5: North America Corrosion Monitoring In Refineries Revenue Share (%), by Type 2025 & 2033
- Figure 6: North America Corrosion Monitoring In Refineries Revenue (million), by Country 2025 & 2033
- Figure 7: North America Corrosion Monitoring In Refineries Revenue Share (%), by Country 2025 & 2033
- Figure 8: South America Corrosion Monitoring In Refineries Revenue (million), by Application 2025 & 2033
- Figure 9: South America Corrosion Monitoring In Refineries Revenue Share (%), by Application 2025 & 2033
- Figure 10: South America Corrosion Monitoring In Refineries Revenue (million), by Type 2025 & 2033
- Figure 11: South America Corrosion Monitoring In Refineries Revenue Share (%), by Type 2025 & 2033
- Figure 12: South America Corrosion Monitoring In Refineries Revenue (million), by Country 2025 & 2033
- Figure 13: South America Corrosion Monitoring In Refineries Revenue Share (%), by Country 2025 & 2033
- Figure 14: Europe Corrosion Monitoring In Refineries Revenue (million), by Application 2025 & 2033
- Figure 15: Europe Corrosion Monitoring In Refineries Revenue Share (%), by Application 2025 & 2033
- Figure 16: Europe Corrosion Monitoring In Refineries Revenue (million), by Type 2025 & 2033
- Figure 17: Europe Corrosion Monitoring In Refineries Revenue Share (%), by Type 2025 & 2033
- Figure 18: Europe Corrosion Monitoring In Refineries Revenue (million), by Country 2025 & 2033
- Figure 19: Europe Corrosion Monitoring In Refineries Revenue Share (%), by Country 2025 & 2033
- Figure 20: Middle East & Africa Corrosion Monitoring In Refineries Revenue (million), by Application 2025 & 2033
- Figure 21: Middle East & Africa Corrosion Monitoring In Refineries Revenue Share (%), by Application 2025 & 2033
- Figure 22: Middle East & Africa Corrosion Monitoring In Refineries Revenue (million), by Type 2025 & 2033
- Figure 23: Middle East & Africa Corrosion Monitoring In Refineries Revenue Share (%), by Type 2025 & 2033
- Figure 24: Middle East & Africa Corrosion Monitoring In Refineries Revenue (million), by Country 2025 & 2033
- Figure 25: Middle East & Africa Corrosion Monitoring In Refineries Revenue Share (%), by Country 2025 & 2033
- Figure 26: Asia Pacific Corrosion Monitoring In Refineries Revenue (million), by Application 2025 & 2033
- Figure 27: Asia Pacific Corrosion Monitoring In Refineries Revenue Share (%), by Application 2025 & 2033
- Figure 28: Asia Pacific Corrosion Monitoring In Refineries Revenue (million), by Type 2025 & 2033
- Figure 29: Asia Pacific Corrosion Monitoring In Refineries Revenue Share (%), by Type 2025 & 2033
- Figure 30: Asia Pacific Corrosion Monitoring In Refineries Revenue (million), by Country 2025 & 2033
- Figure 31: Asia Pacific Corrosion Monitoring In Refineries Revenue Share (%), by Country 2025 & 2033
List of Tables
- Table 1: Global Corrosion Monitoring In Refineries Revenue million Forecast, by Application 2020 & 2033
- Table 2: Global Corrosion Monitoring In Refineries Revenue million Forecast, by Type 2020 & 2033
- Table 3: Global Corrosion Monitoring In Refineries Revenue million Forecast, by Region 2020 & 2033
- Table 4: Global Corrosion Monitoring In Refineries Revenue million Forecast, by Application 2020 & 2033
- Table 5: Global Corrosion Monitoring In Refineries Revenue million Forecast, by Type 2020 & 2033
- Table 6: Global Corrosion Monitoring In Refineries Revenue million Forecast, by Country 2020 & 2033
- Table 7: United States Corrosion Monitoring In Refineries Revenue (million) Forecast, by Application 2020 & 2033
- Table 8: Canada Corrosion Monitoring In Refineries Revenue (million) Forecast, by Application 2020 & 2033
- Table 9: Mexico Corrosion Monitoring In Refineries Revenue (million) Forecast, by Application 2020 & 2033
- Table 10: Global Corrosion Monitoring In Refineries Revenue million Forecast, by Application 2020 & 2033
- Table 11: Global Corrosion Monitoring In Refineries Revenue million Forecast, by Type 2020 & 2033
- Table 12: Global Corrosion Monitoring In Refineries Revenue million Forecast, by Country 2020 & 2033
- Table 13: Brazil Corrosion Monitoring In Refineries Revenue (million) Forecast, by Application 2020 & 2033
- Table 14: Argentina Corrosion Monitoring In Refineries Revenue (million) Forecast, by Application 2020 & 2033
- Table 15: Rest of South America Corrosion Monitoring In Refineries Revenue (million) Forecast, by Application 2020 & 2033
- Table 16: Global Corrosion Monitoring In Refineries Revenue million Forecast, by Application 2020 & 2033
- Table 17: Global Corrosion Monitoring In Refineries Revenue million Forecast, by Type 2020 & 2033
- Table 18: Global Corrosion Monitoring In Refineries Revenue million Forecast, by Country 2020 & 2033
- Table 19: United Kingdom Corrosion Monitoring In Refineries Revenue (million) Forecast, by Application 2020 & 2033
- Table 20: Germany Corrosion Monitoring In Refineries Revenue (million) Forecast, by Application 2020 & 2033
- Table 21: France Corrosion Monitoring In Refineries Revenue (million) Forecast, by Application 2020 & 2033
- Table 22: Italy Corrosion Monitoring In Refineries Revenue (million) Forecast, by Application 2020 & 2033
- Table 23: Spain Corrosion Monitoring In Refineries Revenue (million) Forecast, by Application 2020 & 2033
- Table 24: Russia Corrosion Monitoring In Refineries Revenue (million) Forecast, by Application 2020 & 2033
- Table 25: Benelux Corrosion Monitoring In Refineries Revenue (million) Forecast, by Application 2020 & 2033
- Table 26: Nordics Corrosion Monitoring In Refineries Revenue (million) Forecast, by Application 2020 & 2033
- Table 27: Rest of Europe Corrosion Monitoring In Refineries Revenue (million) Forecast, by Application 2020 & 2033
- Table 28: Global Corrosion Monitoring In Refineries Revenue million Forecast, by Application 2020 & 2033
- Table 29: Global Corrosion Monitoring In Refineries Revenue million Forecast, by Type 2020 & 2033
- Table 30: Global Corrosion Monitoring In Refineries Revenue million Forecast, by Country 2020 & 2033
- Table 31: Turkey Corrosion Monitoring In Refineries Revenue (million) Forecast, by Application 2020 & 2033
- Table 32: Israel Corrosion Monitoring In Refineries Revenue (million) Forecast, by Application 2020 & 2033
- Table 33: GCC Corrosion Monitoring In Refineries Revenue (million) Forecast, by Application 2020 & 2033
- Table 34: North Africa Corrosion Monitoring In Refineries Revenue (million) Forecast, by Application 2020 & 2033
- Table 35: South Africa Corrosion Monitoring In Refineries Revenue (million) Forecast, by Application 2020 & 2033
- Table 36: Rest of Middle East & Africa Corrosion Monitoring In Refineries Revenue (million) Forecast, by Application 2020 & 2033
- Table 37: Global Corrosion Monitoring In Refineries Revenue million Forecast, by Application 2020 & 2033
- Table 38: Global Corrosion Monitoring In Refineries Revenue million Forecast, by Type 2020 & 2033
- Table 39: Global Corrosion Monitoring In Refineries Revenue million Forecast, by Country 2020 & 2033
- Table 40: China Corrosion Monitoring In Refineries Revenue (million) Forecast, by Application 2020 & 2033
- Table 41: India Corrosion Monitoring In Refineries Revenue (million) Forecast, by Application 2020 & 2033
- Table 42: Japan Corrosion Monitoring In Refineries Revenue (million) Forecast, by Application 2020 & 2033
- Table 43: South Korea Corrosion Monitoring In Refineries Revenue (million) Forecast, by Application 2020 & 2033
- Table 44: ASEAN Corrosion Monitoring In Refineries Revenue (million) Forecast, by Application 2020 & 2033
- Table 45: Oceania Corrosion Monitoring In Refineries Revenue (million) Forecast, by Application 2020 & 2033
- Table 46: Rest of Asia Pacific Corrosion Monitoring In Refineries Revenue (million) Forecast, by Application 2020 & 2033
Frequently Asked Questions
1. What is the projected Compound Annual Growth Rate (CAGR) of the Corrosion Monitoring In Refineries?
The projected CAGR is approximately 1.9%.
2. Which companies are prominent players in the Corrosion Monitoring In Refineries?
Key companies in the market include Honeywell, Emerson, Baker Hughes, Rosen Group, SGS, DNV Group, Applus+, TÜV Rheinland, Sensor Networks, Intertek, Cosasco, Sensorlink, Sentry, ZKwell, ClampOn, Orisonic Technology.
3. What are the main segments of the Corrosion Monitoring In Refineries?
The market segments include Application, Type.
4. Can you provide details about the market size?
The market size is estimated to be USD 308 million as of 2022.
5. What are some drivers contributing to market growth?
N/A
6. What are the notable trends driving market growth?
N/A
7. Are there any restraints impacting market growth?
N/A
8. Can you provide examples of recent developments in the market?
N/A
9. What pricing options are available for accessing the report?
Pricing options include single-user, multi-user, and enterprise licenses priced at USD 4900.00, USD 7350.00, and USD 9800.00 respectively.
10. Is the market size provided in terms of value or volume?
The market size is provided in terms of value, measured in million.
11. Are there any specific market keywords associated with the report?
Yes, the market keyword associated with the report is "Corrosion Monitoring In Refineries," which aids in identifying and referencing the specific market segment covered.
12. How do I determine which pricing option suits my needs best?
The pricing options vary based on user requirements and access needs. Individual users may opt for single-user licenses, while businesses requiring broader access may choose multi-user or enterprise licenses for cost-effective access to the report.
13. Are there any additional resources or data provided in the Corrosion Monitoring In Refineries report?
While the report offers comprehensive insights, it's advisable to review the specific contents or supplementary materials provided to ascertain if additional resources or data are available.
14. How can I stay updated on further developments or reports in the Corrosion Monitoring In Refineries?
To stay informed about further developments, trends, and reports in the Corrosion Monitoring In Refineries, consider subscribing to industry newsletters, following relevant companies and organizations, or regularly checking reputable industry news sources and publications.
Methodology
Step 1 - Identification of Relevant Samples Size from Population Database


Step 2 - Approaches for Defining Global Market Size (Value, Volume* & Price*)

Note*: In applicable scenarios
Step 3 - Data Sources
Primary Research
- Web Analytics
- Survey Reports
- Research Institute
- Latest Research Reports
- Opinion Leaders
Secondary Research
- Annual Reports
- White Paper
- Latest Press Release
- Industry Association
- Paid Database
- Investor Presentations

Step 4 - Data Triangulation
Involves using different sources of information in order to increase the validity of a study
These sources are likely to be stakeholders in a program - participants, other researchers, program staff, other community members, and so on.
Then we put all data in single framework & apply various statistical tools to find out the dynamic on the market.
During the analysis stage, feedback from the stakeholder groups would be compared to determine areas of agreement as well as areas of divergence

