Key Insights
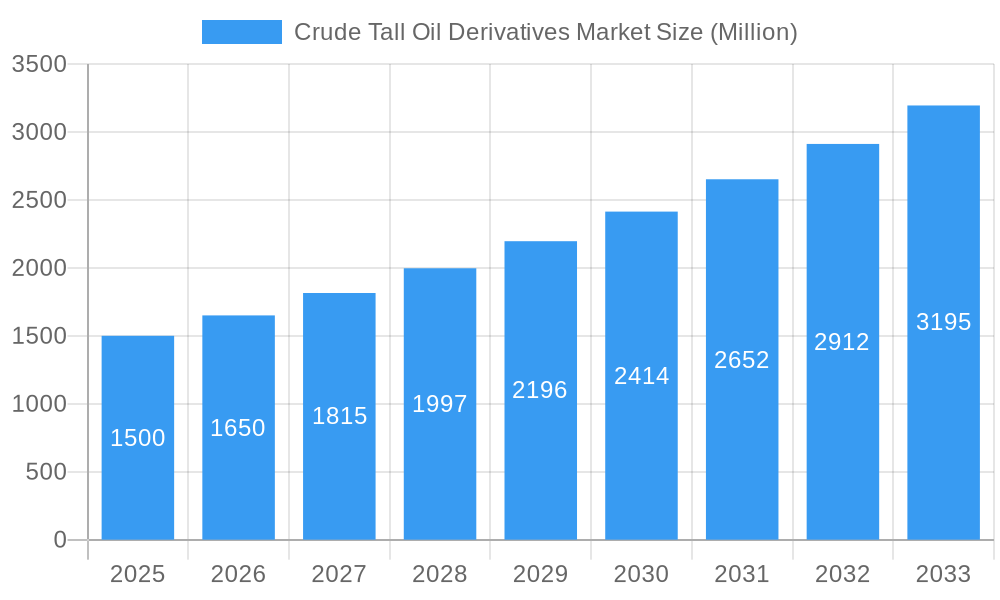
The Crude Tall Oil Derivatives market is projected for substantial expansion, driven by escalating demand across numerous downstream industries. Our analysis indicates a robust Compound Annual Growth Rate (CAGR) of 5.3%. The market size was valued at approximately $2.35 billion in the base year of 2025, with projections extending to 2033. Key growth catalysts include the rising adoption of bio-based materials as sustainable alternatives to petrochemicals and the expanding applications in sectors such as paints, coatings, adhesives, and biofuels. Further market penetration in emerging economies and advancements in production technologies will accelerate this growth.
Crude Tall Oil Derivatives Market Market Size (In Billion)
Continued growth in the Crude Tall Oil Derivatives market is underpinned by several critical factors. Favorable government regulations promoting renewable resources create significant market opportunities. Ongoing research and development efforts focused on enhancing derivative performance drive broader market acceptance. Additionally, the increasing price volatility of petroleum-based alternatives enhances the competitive advantage of these sustainable and cost-effective derivatives. The market is expected to experience heightened competition among key players, spurring product innovation and competitive pricing, which will ultimately benefit consumers and foster market expansion.
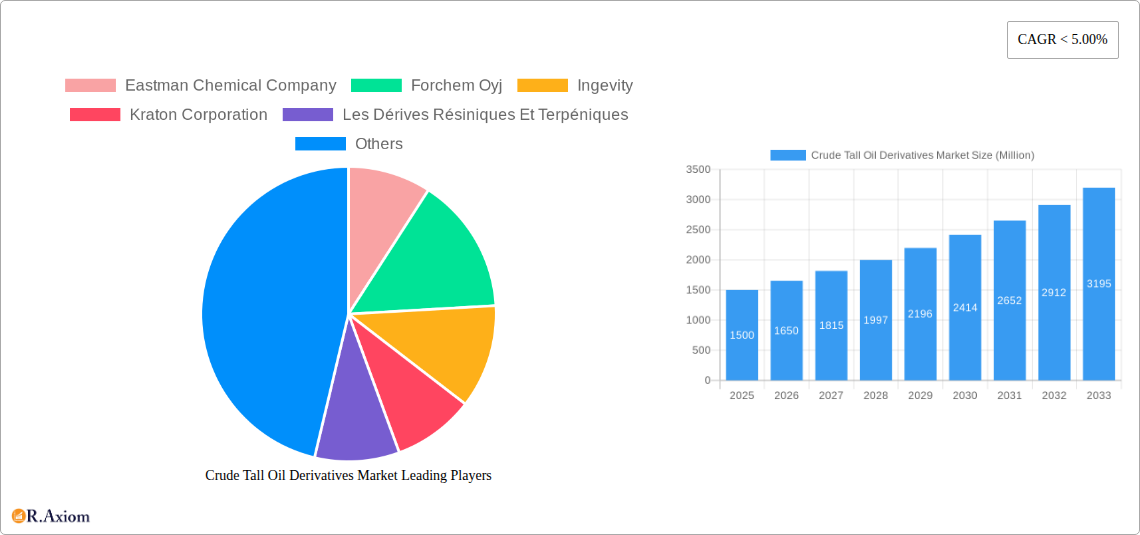
Crude Tall Oil Derivatives Market Company Market Share
This report delivers a comprehensive analysis of the Crude Tall Oil Derivatives market, providing actionable intelligence for stakeholders. The study encompasses the period from 2019 to 2033, with 2025 established as the base year. It meticulously investigates market dynamics, growth drivers, challenges, and emerging opportunities, forecasting market trends through 2033.
Crude Tall Oil Derivatives Market Market Concentration & Innovation
The Crude Tall Oil Derivatives market exhibits a moderately concentrated landscape, with a few major players holding significant market share. While precise market share figures for individual companies remain proprietary, Eastman Chemical Company, Forchem Oyj, Ingevity, Kraton Corporation, and Neste are recognized as key players. Market concentration is influenced by economies of scale in production, access to raw materials, and technological capabilities. Innovation within the market is primarily driven by the development of sustainable and high-performance derivatives catering to evolving end-user demands. This includes advancements in bio-based tall oil derivatives and the exploration of novel applications across diverse industries. Regulatory frameworks, particularly those focused on environmental sustainability and chemical safety, significantly influence product development and market access. The presence of substitute materials, such as petroleum-based chemicals, necessitates continuous innovation to maintain competitiveness. End-user trends, driven by increasing demand for sustainable and renewable products, are shaping the market, compelling manufacturers to innovate and diversify their product portfolio. Mergers and acquisitions (M&A) activity, while not exceptionally frequent, has the potential to reshape the market landscape, particularly concerning the consolidation of production capacity and technological expertise. The total value of M&A deals in the past five years is estimated to be around xx Million, indicating a relatively stable but not highly active M&A environment.
Crude Tall Oil Derivatives Market Industry Trends & Insights
The Crude Tall Oil Derivatives market is projected to experience a Compound Annual Growth Rate (CAGR) of xx% during the forecast period (2025-2033). Several factors contribute to this growth. Firstly, the increasing demand for sustainable and bio-based materials across various sectors is a significant driver. The expanding adoption of renewable resources, in line with global sustainability initiatives, favors the growth of this market. Secondly, technological advancements in refining processes and derivative production are leading to the creation of higher-performance products with enhanced properties. Technological disruptions, such as improved extraction techniques and novel chemical processes, contribute to increased efficiency and lower production costs. Consumer preferences, increasingly focused on eco-friendly products with minimal environmental impact, are another key driver, promoting the adoption of tall oil derivatives as a viable alternative to traditional petroleum-based counterparts. Competitive dynamics are shaped by factors such as pricing strategies, product differentiation, and geographical reach. Market penetration of tall oil derivatives is increasing across various sectors, particularly in adhesives, coatings, and surfactants, which directly translates to enhanced market growth.
Dominant Markets & Segments in Crude Tall Oil Derivatives Market
Dominant Region: North America currently holds the largest market share in Crude Tall Oil Derivatives, fueled by abundant raw material availability and a strong presence of major players.
Key Drivers in North America:
- Abundant pulp and paper industry, providing a significant source of tall oil.
- Established infrastructure for processing and distribution of tall oil derivatives.
- Supportive regulatory environment promoting the adoption of bio-based materials.
- Significant investments in research and development within the region.
The dominance of North America is attributable to several factors. The region possesses a mature pulp and paper industry, the primary source of tall oil, creating a readily available feedstock. Furthermore, well-developed infrastructure facilitates the processing, distribution, and application of tall oil derivatives. The supportive regulatory landscape and government incentives for bio-based materials further enhance market growth. Continued investments in research and development also contribute to innovation and the emergence of new applications, solidifying North America’s position as a dominant market. While Europe and Asia-Pacific are also significant markets, their growth is constrained by factors like varying regulations and availability of feedstock.
Crude Tall Oil Derivatives Market Product Developments
Recent product innovations focus on enhancing the performance characteristics of tall oil derivatives, such as improved viscosity, adhesion, and durability. This is achieved through advancements in chemical modification and blending techniques. New applications are continually emerging across diverse sectors, including bio-plastics, lubricants, and specialty chemicals. The competitive advantage lies in developing sustainable, cost-effective, and high-performance derivatives tailored to specific end-user needs, emphasizing both functionality and environmental benefits. The market trend shows a shift toward bio-based alternatives, enhancing the marketability and sustainability of tall oil derivatives.
Report Scope & Segmentation Analysis
This report segments the Crude Tall Oil Derivatives market based on several factors:
By Product Type: This includes fatty acids, rosin, and other derivatives, each with varying growth projections and market sizes. Competitive dynamics differ within these segments depending on specific product applications and pricing.
By Application: This covers diverse end-use industries such as adhesives, coatings, surfactants, and others. The growth rates and market size vary across these applications, reflecting the unique demands of each industry. Competitive landscapes differ due to the varying technical specifications required in different sectors.
By Geography: The report provides detailed regional analysis, including North America, Europe, Asia Pacific, and other regions. Each region shows different growth patterns and competitive intensities, determined by factors like raw material availability, regulatory frameworks, and industrial development.
Key Drivers of Crude Tall Oil Derivatives Market Growth
Several factors fuel the growth of the Crude Tall Oil Derivatives market. Firstly, the increasing demand for sustainable and renewable materials from industries prioritizing environmental responsibility represents a major driver. The push for reduced carbon footprints across various sectors boosts the adoption of bio-based alternatives like tall oil derivatives. Secondly, technological advancements enhance production efficiency and lead to new, high-performance derivatives, improving their competitiveness against petroleum-based counterparts. Finally, supportive governmental policies and regulations, particularly those promoting bio-based materials, facilitate market expansion.
Challenges in the Crude Tall Oil Derivatives Market Sector
The Crude Tall Oil Derivatives market faces several challenges. Fluctuations in raw material prices, significantly impacting profitability, pose a significant risk. Furthermore, competition from petroleum-based substitutes, often cheaper, presents a continuous challenge. Regulatory changes and compliance requirements, potentially adding to production costs, are another factor. Finally, the need for continuous innovation to meet ever-evolving end-user demands and maintain competitiveness represents a critical challenge.
Emerging Opportunities in Crude Tall Oil Derivatives Market
Emerging opportunities include expanding into new markets, particularly developing economies where the demand for affordable, sustainable materials is high. Further innovation, especially in applications targeting high-growth sectors such as bioplastics and renewable energy, offers substantial potential. Collaborations and partnerships with research institutions and other industry stakeholders could create synergies and accelerate product development.
Leading Players in the Crude Tall Oil Derivatives Market Market
- Eastman Chemical Company
- Forchem Oyj
- Ingevity
- Kraton Corporation
- Les Dérives Résiniques Et Terpéniques
- Mercer International Inc
- Neste
- OOO Torgoviy Dom Lesokhimik
- Pine Chemical Group Oy
- Segezha Group
- Sunpine AB
- UPM
Key Developments in Crude Tall Oil Derivatives Market Industry
November 2022: Neste's acquisition of Crimson Renewable Energy Holdings' UCO business strengthened its US presence and operations in the renewable fuels sector, indirectly impacting the tall oil derivatives market through increased resource utilization and potentially leading to diversification of feedstock.
September 2022: Neste's strategic study on transitioning its Porvoo refinery to a renewable and circular site signals a long-term shift towards sustainable production, impacting the tall oil derivatives market through potentially increased demand for renewable feedstocks and innovative processing technologies.
Strategic Outlook for Crude Tall Oil Derivatives Market Market
The Crude Tall Oil Derivatives market exhibits robust growth potential, driven by ongoing demand for sustainable alternatives and advancements in production technologies. Continued innovation in product development, expansion into new applications, and strategic partnerships will further propel market growth. The market's future success hinges on the ability of key players to adapt to evolving consumer preferences and regulatory landscapes while maintaining cost-competitiveness.
Crude Tall Oil Derivatives Market Segmentation
-
1. Fraction
- 1.1. Tall Oil Pitch (TOP)
- 1.2. Tall Oil Rosin (TOR)
- 1.3. Distilled Tall Oil (DTO)
- 1.4. Tall Oil Fatty Acid (TOFA)
-
2. End-user Industry
-
2.1. Automotive
- 2.1.1. Bio-diesel (fuel)
- 2.1.2. Lubricant
- 2.1.3. Tire Manufacturing (rubber)
-
2.2. Specialty Chemicals & Petrochemicals
- 2.2.1. Plastics
- 2.2.2. Metalworking Fluids
- 2.2.3. Soap & Detergents
- 2.2.4. Coatings
- 2.2.5. Printing inks
- 2.2.6. Paper Sizing
- 2.2.7. Adhesives
-
2.3. Oil & Gas and Mining
- 2.3.1. Oil Drilling
- 2.3.2. Mining flotation
-
2.4. Other End-user Industries
- 2.4.1. Sterols
- 2.4.2. Chewing gum
- 2.4.3. Other End Users
-
2.1. Automotive
Crude Tall Oil Derivatives Market Segmentation By Geography
-
1. Asia Pacific
- 1.1. China
- 1.2. India
- 1.3. Japan
- 1.4. South Korea
- 1.5. Rest of Asia Pacific
-
2. North America
- 2.1. United States
- 2.2. Canada
- 2.3. Rest of North America
-
3. Europe
- 3.1. Germany
- 3.2. France
- 3.3. United Kingdom
- 3.4. Spain
- 3.5. Finland
- 3.6. Sweden
- 3.7. Rest of Europe
-
4. Rest of the World
- 4.1. Brazil
- 4.2. South Africa
- 4.3. Rest of the Countries

Crude Tall Oil Derivatives Market Regional Market Share
Geographic Coverage of Crude Tall Oil Derivatives Market
Crude Tall Oil Derivatives Market REPORT HIGHLIGHTS
| Aspects | Details |
|---|---|
| Study Period | 2020-2034 |
| Base Year | 2025 |
| Estimated Year | 2026 |
| Forecast Period | 2026-2034 |
| Historical Period | 2020-2025 |
| Growth Rate | CAGR of 5.3% from 2020-2034 |
| Segmentation |
|
Table of Contents
- 1. Introduction
- 1.1. Research Scope
- 1.2. Market Segmentation
- 1.3. Research Objective
- 1.4. Definitions and Assumptions
- 2. Executive Summary
- 2.1. Market Snapshot
- 3. Market Dynamics
- 3.1. Market Drivers
- 3.2. Market Restrains
- 3.3. Market Trends
- 3.4. Market Opportunities
- 4. Market Factor Analysis
- 4.1. Porters Five Forces
- 4.1.1. Bargaining Power of Suppliers
- 4.1.2. Bargaining Power of Buyers
- 4.1.3. Threat of New Entrants
- 4.1.4. Threat of Substitutes
- 4.1.5. Competitive Rivalry
- 4.2. PESTEL analysis
- 4.3. BCG Analysis
- 4.3.1. Stars (High Growth, High Market Share)
- 4.3.2. Cash Cows (Low Growth, High Market Share)
- 4.3.3. Question Mark (High Growth, Low Market Share)
- 4.3.4. Dogs (Low Growth, Low Market Share)
- 4.4. Ansoff Matrix Analysis
- 4.5. Supply Chain Analysis
- 4.6. Regulatory Landscape
- 4.7. Current Market Potential and Opportunity Assessment (TAM–SAM–SOM Framework)
- 4.8. RAX Analyst Note
- 4.1. Porters Five Forces
- 5. Market Analysis, Insights and Forecast 2021-2033
- 5.1. Market Analysis, Insights and Forecast - by Fraction
- 5.1.1. Tall Oil Pitch (TOP)
- 5.1.2. Tall Oil Rosin (TOR)
- 5.1.3. Distilled Tall Oil (DTO)
- 5.1.4. Tall Oil Fatty Acid (TOFA)
- 5.2. Market Analysis, Insights and Forecast - by End-user Industry
- 5.2.1. Automotive
- 5.2.1.1. Bio-diesel (fuel)
- 5.2.1.2. Lubricant
- 5.2.1.3. Tire Manufacturing (rubber)
- 5.2.2. Specialty Chemicals & Petrochemicals
- 5.2.2.1. Plastics
- 5.2.2.2. Metalworking Fluids
- 5.2.2.3. Soap & Detergents
- 5.2.2.4. Coatings
- 5.2.2.5. Printing inks
- 5.2.2.6. Paper Sizing
- 5.2.2.7. Adhesives
- 5.2.3. Oil & Gas and Mining
- 5.2.3.1. Oil Drilling
- 5.2.3.2. Mining flotation
- 5.2.4. Other End-user Industries
- 5.2.4.1. Sterols
- 5.2.4.2. Chewing gum
- 5.2.4.3. Other End Users
- 5.2.1. Automotive
- 5.3. Market Analysis, Insights and Forecast - by Region
- 5.3.1. Asia Pacific
- 5.3.2. North America
- 5.3.3. Europe
- 5.3.4. Rest of the World
- 5.1. Market Analysis, Insights and Forecast - by Fraction
- 6. Global Crude Tall Oil Derivatives Market Analysis, Insights and Forecast, 2021-2033
- 6.1. Market Analysis, Insights and Forecast - by Fraction
- 6.1.1. Tall Oil Pitch (TOP)
- 6.1.2. Tall Oil Rosin (TOR)
- 6.1.3. Distilled Tall Oil (DTO)
- 6.1.4. Tall Oil Fatty Acid (TOFA)
- 6.2. Market Analysis, Insights and Forecast - by End-user Industry
- 6.2.1. Automotive
- 6.2.1.1. Bio-diesel (fuel)
- 6.2.1.2. Lubricant
- 6.2.1.3. Tire Manufacturing (rubber)
- 6.2.2. Specialty Chemicals & Petrochemicals
- 6.2.2.1. Plastics
- 6.2.2.2. Metalworking Fluids
- 6.2.2.3. Soap & Detergents
- 6.2.2.4. Coatings
- 6.2.2.5. Printing inks
- 6.2.2.6. Paper Sizing
- 6.2.2.7. Adhesives
- 6.2.3. Oil & Gas and Mining
- 6.2.3.1. Oil Drilling
- 6.2.3.2. Mining flotation
- 6.2.4. Other End-user Industries
- 6.2.4.1. Sterols
- 6.2.4.2. Chewing gum
- 6.2.4.3. Other End Users
- 6.2.1. Automotive
- 6.1. Market Analysis, Insights and Forecast - by Fraction
- 7. Asia Pacific Crude Tall Oil Derivatives Market Analysis, Insights and Forecast, 2020-2032
- 7.1. Market Analysis, Insights and Forecast - by Fraction
- 7.1.1. Tall Oil Pitch (TOP)
- 7.1.2. Tall Oil Rosin (TOR)
- 7.1.3. Distilled Tall Oil (DTO)
- 7.1.4. Tall Oil Fatty Acid (TOFA)
- 7.2. Market Analysis, Insights and Forecast - by End-user Industry
- 7.2.1. Automotive
- 7.2.1.1. Bio-diesel (fuel)
- 7.2.1.2. Lubricant
- 7.2.1.3. Tire Manufacturing (rubber)
- 7.2.2. Specialty Chemicals & Petrochemicals
- 7.2.2.1. Plastics
- 7.2.2.2. Metalworking Fluids
- 7.2.2.3. Soap & Detergents
- 7.2.2.4. Coatings
- 7.2.2.5. Printing inks
- 7.2.2.6. Paper Sizing
- 7.2.2.7. Adhesives
- 7.2.3. Oil & Gas and Mining
- 7.2.3.1. Oil Drilling
- 7.2.3.2. Mining flotation
- 7.2.4. Other End-user Industries
- 7.2.4.1. Sterols
- 7.2.4.2. Chewing gum
- 7.2.4.3. Other End Users
- 7.2.1. Automotive
- 7.1. Market Analysis, Insights and Forecast - by Fraction
- 8. North America Crude Tall Oil Derivatives Market Analysis, Insights and Forecast, 2020-2032
- 8.1. Market Analysis, Insights and Forecast - by Fraction
- 8.1.1. Tall Oil Pitch (TOP)
- 8.1.2. Tall Oil Rosin (TOR)
- 8.1.3. Distilled Tall Oil (DTO)
- 8.1.4. Tall Oil Fatty Acid (TOFA)
- 8.2. Market Analysis, Insights and Forecast - by End-user Industry
- 8.2.1. Automotive
- 8.2.1.1. Bio-diesel (fuel)
- 8.2.1.2. Lubricant
- 8.2.1.3. Tire Manufacturing (rubber)
- 8.2.2. Specialty Chemicals & Petrochemicals
- 8.2.2.1. Plastics
- 8.2.2.2. Metalworking Fluids
- 8.2.2.3. Soap & Detergents
- 8.2.2.4. Coatings
- 8.2.2.5. Printing inks
- 8.2.2.6. Paper Sizing
- 8.2.2.7. Adhesives
- 8.2.3. Oil & Gas and Mining
- 8.2.3.1. Oil Drilling
- 8.2.3.2. Mining flotation
- 8.2.4. Other End-user Industries
- 8.2.4.1. Sterols
- 8.2.4.2. Chewing gum
- 8.2.4.3. Other End Users
- 8.2.1. Automotive
- 8.1. Market Analysis, Insights and Forecast - by Fraction
- 9. Europe Crude Tall Oil Derivatives Market Analysis, Insights and Forecast, 2020-2032
- 9.1. Market Analysis, Insights and Forecast - by Fraction
- 9.1.1. Tall Oil Pitch (TOP)
- 9.1.2. Tall Oil Rosin (TOR)
- 9.1.3. Distilled Tall Oil (DTO)
- 9.1.4. Tall Oil Fatty Acid (TOFA)
- 9.2. Market Analysis, Insights and Forecast - by End-user Industry
- 9.2.1. Automotive
- 9.2.1.1. Bio-diesel (fuel)
- 9.2.1.2. Lubricant
- 9.2.1.3. Tire Manufacturing (rubber)
- 9.2.2. Specialty Chemicals & Petrochemicals
- 9.2.2.1. Plastics
- 9.2.2.2. Metalworking Fluids
- 9.2.2.3. Soap & Detergents
- 9.2.2.4. Coatings
- 9.2.2.5. Printing inks
- 9.2.2.6. Paper Sizing
- 9.2.2.7. Adhesives
- 9.2.3. Oil & Gas and Mining
- 9.2.3.1. Oil Drilling
- 9.2.3.2. Mining flotation
- 9.2.4. Other End-user Industries
- 9.2.4.1. Sterols
- 9.2.4.2. Chewing gum
- 9.2.4.3. Other End Users
- 9.2.1. Automotive
- 9.1. Market Analysis, Insights and Forecast - by Fraction
- 10. Rest of the World Crude Tall Oil Derivatives Market Analysis, Insights and Forecast, 2020-2032
- 10.1. Market Analysis, Insights and Forecast - by Fraction
- 10.1.1. Tall Oil Pitch (TOP)
- 10.1.2. Tall Oil Rosin (TOR)
- 10.1.3. Distilled Tall Oil (DTO)
- 10.1.4. Tall Oil Fatty Acid (TOFA)
- 10.2. Market Analysis, Insights and Forecast - by End-user Industry
- 10.2.1. Automotive
- 10.2.1.1. Bio-diesel (fuel)
- 10.2.1.2. Lubricant
- 10.2.1.3. Tire Manufacturing (rubber)
- 10.2.2. Specialty Chemicals & Petrochemicals
- 10.2.2.1. Plastics
- 10.2.2.2. Metalworking Fluids
- 10.2.2.3. Soap & Detergents
- 10.2.2.4. Coatings
- 10.2.2.5. Printing inks
- 10.2.2.6. Paper Sizing
- 10.2.2.7. Adhesives
- 10.2.3. Oil & Gas and Mining
- 10.2.3.1. Oil Drilling
- 10.2.3.2. Mining flotation
- 10.2.4. Other End-user Industries
- 10.2.4.1. Sterols
- 10.2.4.2. Chewing gum
- 10.2.4.3. Other End Users
- 10.2.1. Automotive
- 10.1. Market Analysis, Insights and Forecast - by Fraction
- 11. Competitive Analysis
- 11.1. Company Profiles
- 11.1.1 Eastman Chemical Company
- 11.1.1.1. Company Overview
- 11.1.1.2. Products
- 11.1.1.3. Company Financials
- 11.1.1.4. SWOT Analysis
- 11.1.2 Forchem Oyj
- 11.1.2.1. Company Overview
- 11.1.2.2. Products
- 11.1.2.3. Company Financials
- 11.1.2.4. SWOT Analysis
- 11.1.3 Ingevity
- 11.1.3.1. Company Overview
- 11.1.3.2. Products
- 11.1.3.3. Company Financials
- 11.1.3.4. SWOT Analysis
- 11.1.4 Kraton Corporation
- 11.1.4.1. Company Overview
- 11.1.4.2. Products
- 11.1.4.3. Company Financials
- 11.1.4.4. SWOT Analysis
- 11.1.5 Les Dérives Résiniques Et Terpéniques
- 11.1.5.1. Company Overview
- 11.1.5.2. Products
- 11.1.5.3. Company Financials
- 11.1.5.4. SWOT Analysis
- 11.1.6 Mercer International Inc
- 11.1.6.1. Company Overview
- 11.1.6.2. Products
- 11.1.6.3. Company Financials
- 11.1.6.4. SWOT Analysis
- 11.1.7 Neste
- 11.1.7.1. Company Overview
- 11.1.7.2. Products
- 11.1.7.3. Company Financials
- 11.1.7.4. SWOT Analysis
- 11.1.8 Ooo Torgoviy Dom Lesokhimik
- 11.1.8.1. Company Overview
- 11.1.8.2. Products
- 11.1.8.3. Company Financials
- 11.1.8.4. SWOT Analysis
- 11.1.9 Pine Chemical Group Oy
- 11.1.9.1. Company Overview
- 11.1.9.2. Products
- 11.1.9.3. Company Financials
- 11.1.9.4. SWOT Analysis
- 11.1.10 Segezha Group
- 11.1.10.1. Company Overview
- 11.1.10.2. Products
- 11.1.10.3. Company Financials
- 11.1.10.4. SWOT Analysis
- 11.1.11 Sunpine AB
- 11.1.11.1. Company Overview
- 11.1.11.2. Products
- 11.1.11.3. Company Financials
- 11.1.11.4. SWOT Analysis
- 11.1.12 UPM*List Not Exhaustive
- 11.1.12.1. Company Overview
- 11.1.12.2. Products
- 11.1.12.3. Company Financials
- 11.1.12.4. SWOT Analysis
- 11.1.1 Eastman Chemical Company
- 11.2. Market Entropy
- 11.2.1 Company's Key Areas Served
- 11.2.2 Recent Developments
- 11.3. Company Market Share Analysis 2025
- 11.3.1 Top 5 Companies Market Share Analysis
- 11.3.2 Top 3 Companies Market Share Analysis
- 11.4. List of Potential Customers
- 12. Research Methodology
List of Figures
- Figure 1: Global Crude Tall Oil Derivatives Market Revenue Breakdown (billion, %) by Region 2025 & 2033
- Figure 2: Asia Pacific Crude Tall Oil Derivatives Market Revenue (billion), by Fraction 2025 & 2033
- Figure 3: Asia Pacific Crude Tall Oil Derivatives Market Revenue Share (%), by Fraction 2025 & 2033
- Figure 4: Asia Pacific Crude Tall Oil Derivatives Market Revenue (billion), by End-user Industry 2025 & 2033
- Figure 5: Asia Pacific Crude Tall Oil Derivatives Market Revenue Share (%), by End-user Industry 2025 & 2033
- Figure 6: Asia Pacific Crude Tall Oil Derivatives Market Revenue (billion), by Country 2025 & 2033
- Figure 7: Asia Pacific Crude Tall Oil Derivatives Market Revenue Share (%), by Country 2025 & 2033
- Figure 8: North America Crude Tall Oil Derivatives Market Revenue (billion), by Fraction 2025 & 2033
- Figure 9: North America Crude Tall Oil Derivatives Market Revenue Share (%), by Fraction 2025 & 2033
- Figure 10: North America Crude Tall Oil Derivatives Market Revenue (billion), by End-user Industry 2025 & 2033
- Figure 11: North America Crude Tall Oil Derivatives Market Revenue Share (%), by End-user Industry 2025 & 2033
- Figure 12: North America Crude Tall Oil Derivatives Market Revenue (billion), by Country 2025 & 2033
- Figure 13: North America Crude Tall Oil Derivatives Market Revenue Share (%), by Country 2025 & 2033
- Figure 14: Europe Crude Tall Oil Derivatives Market Revenue (billion), by Fraction 2025 & 2033
- Figure 15: Europe Crude Tall Oil Derivatives Market Revenue Share (%), by Fraction 2025 & 2033
- Figure 16: Europe Crude Tall Oil Derivatives Market Revenue (billion), by End-user Industry 2025 & 2033
- Figure 17: Europe Crude Tall Oil Derivatives Market Revenue Share (%), by End-user Industry 2025 & 2033
- Figure 18: Europe Crude Tall Oil Derivatives Market Revenue (billion), by Country 2025 & 2033
- Figure 19: Europe Crude Tall Oil Derivatives Market Revenue Share (%), by Country 2025 & 2033
- Figure 20: Rest of the World Crude Tall Oil Derivatives Market Revenue (billion), by Fraction 2025 & 2033
- Figure 21: Rest of the World Crude Tall Oil Derivatives Market Revenue Share (%), by Fraction 2025 & 2033
- Figure 22: Rest of the World Crude Tall Oil Derivatives Market Revenue (billion), by End-user Industry 2025 & 2033
- Figure 23: Rest of the World Crude Tall Oil Derivatives Market Revenue Share (%), by End-user Industry 2025 & 2033
- Figure 24: Rest of the World Crude Tall Oil Derivatives Market Revenue (billion), by Country 2025 & 2033
- Figure 25: Rest of the World Crude Tall Oil Derivatives Market Revenue Share (%), by Country 2025 & 2033
List of Tables
- Table 1: Global Crude Tall Oil Derivatives Market Revenue billion Forecast, by Fraction 2020 & 2033
- Table 2: Global Crude Tall Oil Derivatives Market Revenue billion Forecast, by End-user Industry 2020 & 2033
- Table 3: Global Crude Tall Oil Derivatives Market Revenue billion Forecast, by Region 2020 & 2033
- Table 4: Global Crude Tall Oil Derivatives Market Revenue billion Forecast, by Fraction 2020 & 2033
- Table 5: Global Crude Tall Oil Derivatives Market Revenue billion Forecast, by End-user Industry 2020 & 2033
- Table 6: Global Crude Tall Oil Derivatives Market Revenue billion Forecast, by Country 2020 & 2033
- Table 7: China Crude Tall Oil Derivatives Market Revenue (billion) Forecast, by Application 2020 & 2033
- Table 8: India Crude Tall Oil Derivatives Market Revenue (billion) Forecast, by Application 2020 & 2033
- Table 9: Japan Crude Tall Oil Derivatives Market Revenue (billion) Forecast, by Application 2020 & 2033
- Table 10: South Korea Crude Tall Oil Derivatives Market Revenue (billion) Forecast, by Application 2020 & 2033
- Table 11: Rest of Asia Pacific Crude Tall Oil Derivatives Market Revenue (billion) Forecast, by Application 2020 & 2033
- Table 12: Global Crude Tall Oil Derivatives Market Revenue billion Forecast, by Fraction 2020 & 2033
- Table 13: Global Crude Tall Oil Derivatives Market Revenue billion Forecast, by End-user Industry 2020 & 2033
- Table 14: Global Crude Tall Oil Derivatives Market Revenue billion Forecast, by Country 2020 & 2033
- Table 15: United States Crude Tall Oil Derivatives Market Revenue (billion) Forecast, by Application 2020 & 2033
- Table 16: Canada Crude Tall Oil Derivatives Market Revenue (billion) Forecast, by Application 2020 & 2033
- Table 17: Rest of North America Crude Tall Oil Derivatives Market Revenue (billion) Forecast, by Application 2020 & 2033
- Table 18: Global Crude Tall Oil Derivatives Market Revenue billion Forecast, by Fraction 2020 & 2033
- Table 19: Global Crude Tall Oil Derivatives Market Revenue billion Forecast, by End-user Industry 2020 & 2033
- Table 20: Global Crude Tall Oil Derivatives Market Revenue billion Forecast, by Country 2020 & 2033
- Table 21: Germany Crude Tall Oil Derivatives Market Revenue (billion) Forecast, by Application 2020 & 2033
- Table 22: France Crude Tall Oil Derivatives Market Revenue (billion) Forecast, by Application 2020 & 2033
- Table 23: United Kingdom Crude Tall Oil Derivatives Market Revenue (billion) Forecast, by Application 2020 & 2033
- Table 24: Spain Crude Tall Oil Derivatives Market Revenue (billion) Forecast, by Application 2020 & 2033
- Table 25: Finland Crude Tall Oil Derivatives Market Revenue (billion) Forecast, by Application 2020 & 2033
- Table 26: Sweden Crude Tall Oil Derivatives Market Revenue (billion) Forecast, by Application 2020 & 2033
- Table 27: Rest of Europe Crude Tall Oil Derivatives Market Revenue (billion) Forecast, by Application 2020 & 2033
- Table 28: Global Crude Tall Oil Derivatives Market Revenue billion Forecast, by Fraction 2020 & 2033
- Table 29: Global Crude Tall Oil Derivatives Market Revenue billion Forecast, by End-user Industry 2020 & 2033
- Table 30: Global Crude Tall Oil Derivatives Market Revenue billion Forecast, by Country 2020 & 2033
- Table 31: Brazil Crude Tall Oil Derivatives Market Revenue (billion) Forecast, by Application 2020 & 2033
- Table 32: South Africa Crude Tall Oil Derivatives Market Revenue (billion) Forecast, by Application 2020 & 2033
- Table 33: Rest of the Countries Crude Tall Oil Derivatives Market Revenue (billion) Forecast, by Application 2020 & 2033
Frequently Asked Questions
1. What is the projected Compound Annual Growth Rate (CAGR) of the Crude Tall Oil Derivatives Market?
The projected CAGR is approximately 5.3%.
2. Which companies are prominent players in the Crude Tall Oil Derivatives Market?
Key companies in the market include Eastman Chemical Company, Forchem Oyj, Ingevity, Kraton Corporation, Les Dérives Résiniques Et Terpéniques, Mercer International Inc, Neste, Ooo Torgoviy Dom Lesokhimik, Pine Chemical Group Oy, Segezha Group, Sunpine AB, UPM*List Not Exhaustive.
3. What are the main segments of the Crude Tall Oil Derivatives Market?
The market segments include Fraction, End-user Industry.
4. Can you provide details about the market size?
The market size is estimated to be USD 2.35 billion as of 2022.
5. What are some drivers contributing to market growth?
Increasing Demand For Bio-based Chemicals In End-user Industries; Rising Application in the Automotive Industry; Other Drivers.
6. What are the notable trends driving market growth?
TOFA Segment to Dominate the Market.
7. Are there any restraints impacting market growth?
Increasing Demand For Bio-based Chemicals In End-user Industries; Rising Application in the Automotive Industry; Other Drivers.
8. Can you provide examples of recent developments in the market?
November 2022: Neste agreed to acquire the used cooking oil (UCO) collection and aggregation business and related assets in the United States from Crimson Renewable Energy Holdings, LLC. This acquisition further strengthens Neste's presence and operations in the United States.
9. What pricing options are available for accessing the report?
Pricing options include single-user, multi-user, and enterprise licenses priced at USD 4750, USD 5250, and USD 8750 respectively.
10. Is the market size provided in terms of value or volume?
The market size is provided in terms of value, measured in billion.
11. Are there any specific market keywords associated with the report?
Yes, the market keyword associated with the report is "Crude Tall Oil Derivatives Market," which aids in identifying and referencing the specific market segment covered.
12. How do I determine which pricing option suits my needs best?
The pricing options vary based on user requirements and access needs. Individual users may opt for single-user licenses, while businesses requiring broader access may choose multi-user or enterprise licenses for cost-effective access to the report.
13. Are there any additional resources or data provided in the Crude Tall Oil Derivatives Market report?
While the report offers comprehensive insights, it's advisable to review the specific contents or supplementary materials provided to ascertain if additional resources or data are available.
14. How can I stay updated on further developments or reports in the Crude Tall Oil Derivatives Market?
To stay informed about further developments, trends, and reports in the Crude Tall Oil Derivatives Market, consider subscribing to industry newsletters, following relevant companies and organizations, or regularly checking reputable industry news sources and publications.
Methodology
Step 1 - Identification of Relevant Samples Size from Population Database


Step 2 - Approaches for Defining Global Market Size (Value, Volume* & Price*)

Note*: In applicable scenarios
Step 3 - Data Sources
Primary Research
- Web Analytics
- Survey Reports
- Research Institute
- Latest Research Reports
- Opinion Leaders
Secondary Research
- Annual Reports
- White Paper
- Latest Press Release
- Industry Association
- Paid Database
- Investor Presentations

Step 4 - Data Triangulation
Involves using different sources of information in order to increase the validity of a study
These sources are likely to be stakeholders in a program - participants, other researchers, program staff, other community members, and so on.
Then we put all data in single framework & apply various statistical tools to find out the dynamic on the market.
During the analysis stage, feedback from the stakeholder groups would be compared to determine areas of agreement as well as areas of divergence

