

Key Insights
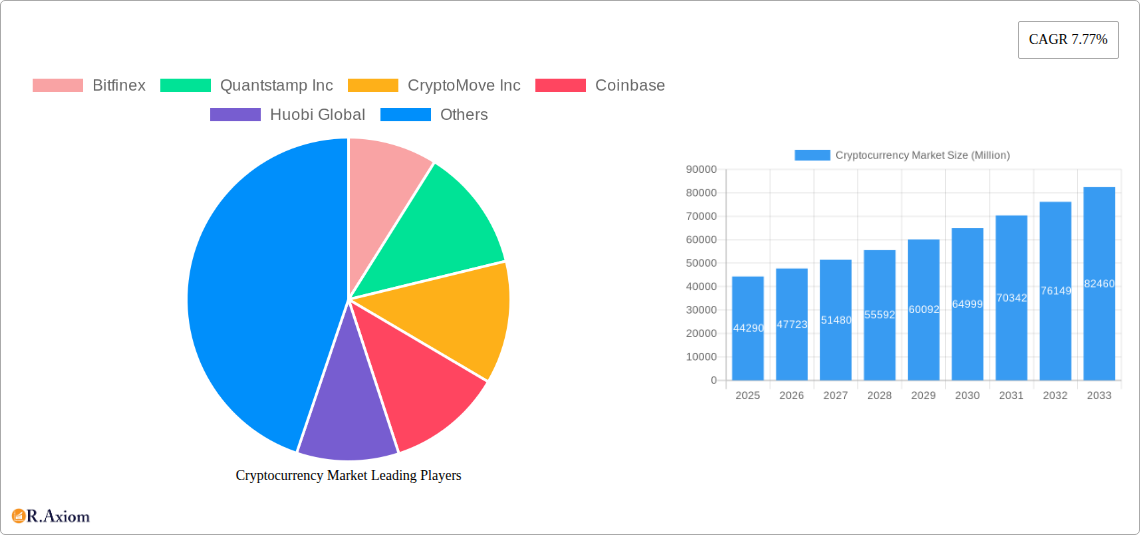
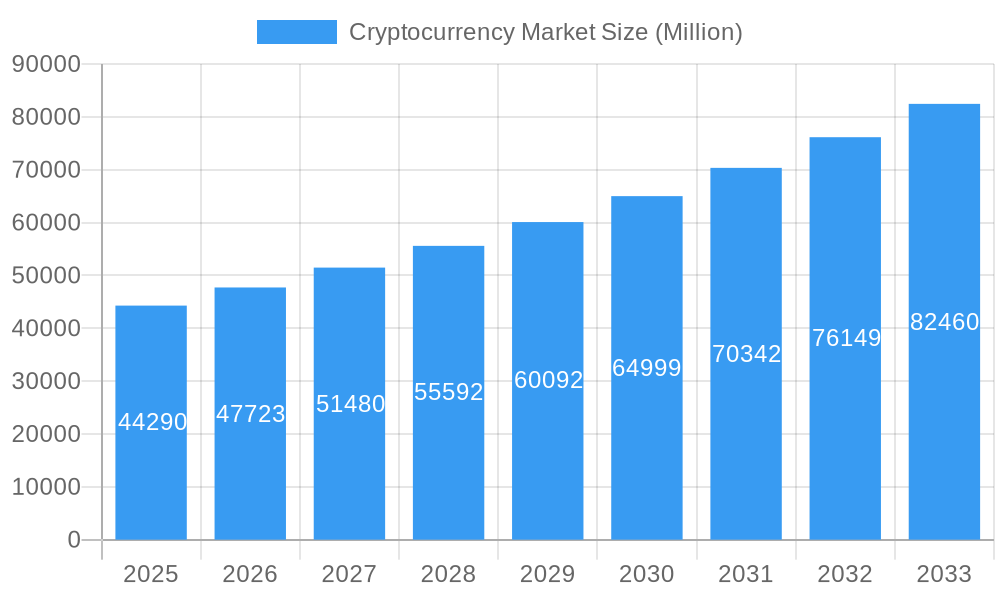
The cryptocurrency market, valued at $44.29 billion in 2025, is projected to experience robust growth, exhibiting a Compound Annual Growth Rate (CAGR) of 7.77% from 2025 to 2033. This expansion is driven by several key factors. Increasing mainstream adoption, fueled by regulatory clarity in certain jurisdictions and the development of user-friendly applications, is a major catalyst. Technological advancements, such as layer-2 scaling solutions and the rise of decentralized finance (DeFi), are enhancing efficiency and accessibility, attracting both institutional and retail investors. Furthermore, the growing interest in blockchain technology beyond cryptocurrencies, extending into supply chain management and other sectors, contributes to the overall market expansion. Competition among established exchanges like Coinbase, Binance, and Huobi Global, alongside emerging players, fosters innovation and pushes the market forward.
Cryptocurrency Market Market Size (In Billion)
However, the market faces challenges. Volatility remains a significant concern, impacting investor confidence and potentially hindering widespread adoption. Regulatory uncertainty in various regions creates obstacles for businesses operating in this space. Security risks, including hacking incidents and scams, also pose a threat to the market's stability and growth. Despite these headwinds, the long-term outlook remains positive, driven by the underlying technological advancements and growing institutional interest. The continued evolution of blockchain technology and its expanding applications will be crucial in shaping the future trajectory of this dynamic market. The integration of cryptocurrencies into traditional financial systems and the development of more sophisticated infrastructure will be instrumental in fostering broader adoption and mitigating existing risks.
Cryptocurrency Market Company Market Share
Cryptocurrency Market: A Comprehensive Report (2019-2033)
This in-depth report provides a comprehensive analysis of the Cryptocurrency Market, covering the period from 2019 to 2033. The report leverages historical data (2019-2024), utilizes a base year of 2025, and offers detailed forecasts until 2033. It examines market concentration, innovation, key players, emerging trends, and challenges within this dynamic sector, providing actionable insights for industry stakeholders. The report incorporates data from key players including, but not limited to, Bitfinex, Quantstamp Inc, CryptoMove Inc, Coinbase, Huobi Global, CoinCheck, Gemini, Bitfury, Binance, and Cannan Inc.
Cryptocurrency Market Concentration & Innovation
The Cryptocurrency Market exhibits a complex landscape of concentration and innovation. While a few large players dominate trading volume and market capitalization, a significant number of smaller firms drive innovation through niche products and services. Market share fluctuates frequently based on technological advancements, regulatory changes, and market sentiment. Recent years have witnessed a surge in decentralized finance (DeFi) applications, resulting in increased competition and fragmentation.
- Market Concentration: The top 5 exchanges account for approximately xx% of global trading volume in 2025 (Estimated). This dominance is subject to change due to the competitive nature of the market.
- Innovation Drivers: The primary drivers are technological advancements (e.g., layer-2 scaling solutions, improved consensus mechanisms), regulatory developments (e.g., the emergence of clearer legal frameworks), and growing consumer adoption.
- Regulatory Frameworks: Varying regulatory approaches across jurisdictions create uncertainty and influence market behavior. Harmonization of regulations is a key factor influencing market growth and concentration.
- Product Substitutes: While cryptocurrencies themselves are substitutes for traditional assets, alternative blockchain technologies and payment systems pose competitive threats to established players.
- End-User Trends: Growing adoption by institutional investors and the rise of decentralized autonomous organizations (DAOs) are key trends shaping market dynamics.
- M&A Activities: The market has witnessed significant M&A activity in recent years, with deal values reaching xx Million USD annually in the historical period, a number expected to grow during the forecast period. Consolidation is likely to continue as larger players seek to expand their market share.
Cryptocurrency Market Industry Trends & Insights
The Cryptocurrency Market is characterized by rapid growth and substantial volatility. Technological disruptions such as the rise of Web3 and the metaverse are reshaping the sector. Consumer preferences are shifting towards user-friendly interfaces and decentralized applications. Competitive dynamics are intensifying as established players and new entrants battle for market share. The Compound Annual Growth Rate (CAGR) during the forecast period (2025-2033) is estimated to be xx%, with market penetration expected to reach xx% by 2033. Several factors influence this trajectory, including evolving regulatory landscapes, technological breakthroughs, and the increasing integration of cryptocurrencies into traditional financial systems. Further analysis reveals significant correlation between the adoption rates of cryptocurrencies and the overall financial literacy in different regions. The continued development of robust and secure infrastructure is crucial to ensure the sustained growth of the market and maintain investor confidence.
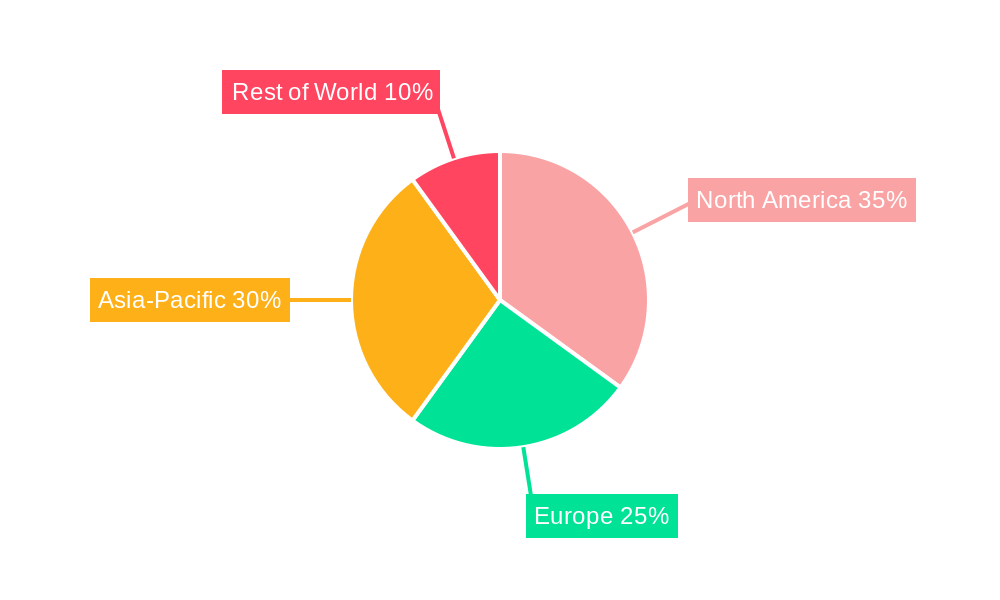
Dominant Markets & Segments in Cryptocurrency Market
The Asia-Pacific region is currently leading the Cryptocurrency Market, driven by high adoption rates in countries like Japan, South Korea, and Singapore.
- Key Drivers (Asia-Pacific):
- Supportive regulatory environments (in certain jurisdictions).
- High levels of technological proficiency and early adoption of digital technologies.
- A large population with significant disposable income.
- Robust financial infrastructure in some key markets.
While the Asia-Pacific region holds the largest share, North America and Europe also exhibit significant growth potential, propelled by increasing regulatory clarity and institutional adoption. The dominance of specific regions is contingent upon multiple factors, including regulatory developments, economic conditions, and technological infrastructure.
Cryptocurrency Market Product Developments
The Cryptocurrency Market showcases continuous product innovation, encompassing new cryptocurrencies, DeFi platforms, NFTs, and metaverse-related projects. These developments drive market expansion by addressing user needs and expanding use cases beyond speculation. Technological advancements like layer-2 scaling solutions enhance transaction speeds and reduce costs, improving the overall user experience and fostering wider adoption. This also contributes to the heightened security and usability that bolster market confidence.
Report Scope & Segmentation Analysis
This report segments the Cryptocurrency Market by type (Bitcoin, Ethereum, Altcoins), by application (payments, investments, DeFi), and by geography (North America, Europe, Asia-Pacific, etc.). Each segment is analyzed in detail, offering growth projections, market sizes, and competitive dynamics. Growth rates vary across segments, reflecting differing levels of adoption and technological maturity. The competitive landscape is dynamic, with new entrants continuously emerging, demanding comprehensive analysis of the market segments.
Key Drivers of Cryptocurrency Market Growth
The Cryptocurrency Market’s growth is fueled by technological advancements (e.g., blockchain improvements, DeFi innovations), increasing economic uncertainty leading to diversification of investment portfolios, and evolving regulatory clarity in certain regions. Institutional investment is a major driver, adding significant capital and enhancing market liquidity. Increased awareness and educational initiatives are contributing to growing consumer adoption.
Challenges in the Cryptocurrency Market Sector
The Cryptocurrency Market faces significant challenges, including regulatory uncertainty, security risks (hacks, scams), volatility, and scalability limitations. Regulatory hurdles differ across jurisdictions, creating complexities for businesses operating globally. Supply chain disruptions and fluctuating energy prices further impact mining operations. Intense competition among numerous players necessitates strategic maneuvering for success.
Emerging Opportunities in Cryptocurrency Market
Emerging opportunities abound in the Cryptocurrency Market, such as the growing adoption of CBDCs (Central Bank Digital Currencies), the expansion of the metaverse and NFTs, and the increasing integration of blockchain technology into various industries (supply chain management, healthcare, etc.). Decentralized autonomous organizations (DAOs) present new models for governance and ownership. These developments present significant potential for growth and innovation.
Key Developments in Cryptocurrency Market Industry
- December 2023: Bitfinex Securities Ltd. secured USD 5.2 Million in USDT through its tokenized bond ALT2612, facilitated by ALTERNATIVE, a Luxembourg-based securitization fund managed by Mikro Kapita. This highlights innovative financing methods within the crypto space.
- October 2023: Quantstamp launched DeFi Protection, a security solution compensating users for DeFi losses. This innovative product enhances trust and security in the DeFi ecosystem.
Strategic Outlook for Cryptocurrency Market Market
The Cryptocurrency Market exhibits immense future potential driven by technological innovations, expanding applications, and growing institutional adoption. While challenges persist, the long-term outlook remains positive, with continued growth expected across various segments and geographical regions. Strategic partnerships, technological advancements, and regulatory developments will shape the market landscape in the coming years.
Cryptocurrency Market Segmentation
-
1. Market Capitalization
- 1.1. Bitcoin
- 1.2. Ethereum
- 1.3. Ripple
- 1.4. Bitcoin Cash
- 1.5. Cardano
- 1.6. Others
- 2. Geography
-
3. North America
- 3.1. United States
- 3.2. Canada
- 3.3. Mexico
- 3.4. Rest of North America
-
4. Europe
- 4.1. United Kingdom
- 4.2. Germany
- 4.3. France
- 4.4. Russia
- 4.5. Italy
- 4.6. Spain
- 4.7. Rest of Europe
-
5. Asia-Pacific
- 5.1. India
- 5.2. China
- 5.3. Japan
- 5.4. Australia
- 5.5. Rest of Asia-Pacific
-
6. South America
- 6.1. Brazil
- 6.2. Argentina
- 6.3. Rest of South America
-
7. Middle East & Africa
- 7.1. United Arab Emirates
- 7.2. South Africa
- 7.3. Rest of Middle East & Africa
Cryptocurrency Market Segmentation By Geography
-
1. North America
- 1.1. United States
- 1.2. Canada
- 1.3. Mexico
-
2. South America
- 2.1. Brazil
- 2.2. Argentina
- 2.3. Rest of South America
-
3. Europe
- 3.1. United Kingdom
- 3.2. Germany
- 3.3. France
- 3.4. Italy
- 3.5. Spain
- 3.6. Russia
- 3.7. Benelux
- 3.8. Nordics
- 3.9. Rest of Europe
-
4. Middle East & Africa
- 4.1. Turkey
- 4.2. Israel
- 4.3. GCC
- 4.4. North Africa
- 4.5. South Africa
- 4.6. Rest of Middle East & Africa
-
5. Asia Pacific
- 5.1. China
- 5.2. India
- 5.3. Japan
- 5.4. South Korea
- 5.5. ASEAN
- 5.6. Oceania
- 5.7. Rest of Asia Pacific
Cryptocurrency Market Regional Market Share
Geographic Coverage of Cryptocurrency Market
Cryptocurrency Market REPORT HIGHLIGHTS
| Aspects | Details |
|---|---|
| Study Period | 2020-2034 |
| Base Year | 2025 |
| Estimated Year | 2026 |
| Forecast Period | 2026-2034 |
| Historical Period | 2020-2025 |
| Growth Rate | CAGR of 7.77% from 2020-2034 |
| Segmentation |
|
Table of Contents
- 1. Introduction
- 1.1. Research Scope
- 1.2. Market Segmentation
- 1.3. Research Objective
- 1.4. Definitions and Assumptions
- 2. Executive Summary
- 2.1. Market Snapshot
- 3. Market Dynamics
- 3.1. Market Drivers
- 3.2. Market Restrains
- 3.3. Market Trends
- 3.4. Market Opportunities
- 4. Market Factor Analysis
- 4.1. Porters Five Forces
- 4.1.1. Bargaining Power of Suppliers
- 4.1.2. Bargaining Power of Buyers
- 4.1.3. Threat of New Entrants
- 4.1.4. Threat of Substitutes
- 4.1.5. Competitive Rivalry
- 4.2. PESTEL analysis
- 4.3. BCG Analysis
- 4.3.1. Stars (High Growth, High Market Share)
- 4.3.2. Cash Cows (Low Growth, High Market Share)
- 4.3.3. Question Mark (High Growth, Low Market Share)
- 4.3.4. Dogs (Low Growth, Low Market Share)
- 4.4. Ansoff Matrix Analysis
- 4.5. Supply Chain Analysis
- 4.6. Regulatory Landscape
- 4.7. Current Market Potential and Opportunity Assessment (TAM–SAM–SOM Framework)
- 4.8. RAX Analyst Note
- 4.1. Porters Five Forces
- 5. Market Analysis, Insights and Forecast 2021-2033
- 5.1. Market Analysis, Insights and Forecast - by Market Capitalization
- 5.1.1. Bitcoin
- 5.1.2. Ethereum
- 5.1.3. Ripple
- 5.1.4. Bitcoin Cash
- 5.1.5. Cardano
- 5.1.6. Others
- 5.2. Market Analysis, Insights and Forecast - by Geography
- 5.3. Market Analysis, Insights and Forecast - by North America
- 5.3.1. United States
- 5.3.2. Canada
- 5.3.3. Mexico
- 5.3.4. Rest of North America
- 5.4. Market Analysis, Insights and Forecast - by Europe
- 5.4.1. United Kingdom
- 5.4.2. Germany
- 5.4.3. France
- 5.4.4. Russia
- 5.4.5. Italy
- 5.4.6. Spain
- 5.4.7. Rest of Europe
- 5.5. Market Analysis, Insights and Forecast - by Asia-Pacific
- 5.5.1. India
- 5.5.2. China
- 5.5.3. Japan
- 5.5.4. Australia
- 5.5.5. Rest of Asia-Pacific
- 5.6. Market Analysis, Insights and Forecast - by South America
- 5.6.1. Brazil
- 5.6.2. Argentina
- 5.6.3. Rest of South America
- 5.7. Market Analysis, Insights and Forecast - by Middle East & Africa
- 5.7.1. United Arab Emirates
- 5.7.2. South Africa
- 5.7.3. Rest of Middle East & Africa
- 5.8. Market Analysis, Insights and Forecast - by Region
- 5.8.1. North America
- 5.8.2. South America
- 5.8.3. Europe
- 5.8.4. Middle East & Africa
- 5.8.5. Asia Pacific
- 5.1. Market Analysis, Insights and Forecast - by Market Capitalization
- 6. Global Cryptocurrency Market Analysis, Insights and Forecast, 2021-2033
- 6.1. Market Analysis, Insights and Forecast - by Market Capitalization
- 6.1.1. Bitcoin
- 6.1.2. Ethereum
- 6.1.3. Ripple
- 6.1.4. Bitcoin Cash
- 6.1.5. Cardano
- 6.1.6. Others
- 6.2. Market Analysis, Insights and Forecast - by Geography
- 6.3. Market Analysis, Insights and Forecast - by North America
- 6.3.1. United States
- 6.3.2. Canada
- 6.3.3. Mexico
- 6.3.4. Rest of North America
- 6.4. Market Analysis, Insights and Forecast - by Europe
- 6.4.1. United Kingdom
- 6.4.2. Germany
- 6.4.3. France
- 6.4.4. Russia
- 6.4.5. Italy
- 6.4.6. Spain
- 6.4.7. Rest of Europe
- 6.5. Market Analysis, Insights and Forecast - by Asia-Pacific
- 6.5.1. India
- 6.5.2. China
- 6.5.3. Japan
- 6.5.4. Australia
- 6.5.5. Rest of Asia-Pacific
- 6.6. Market Analysis, Insights and Forecast - by South America
- 6.6.1. Brazil
- 6.6.2. Argentina
- 6.6.3. Rest of South America
- 6.7. Market Analysis, Insights and Forecast - by Middle East & Africa
- 6.7.1. United Arab Emirates
- 6.7.2. South Africa
- 6.7.3. Rest of Middle East & Africa
- 6.1. Market Analysis, Insights and Forecast - by Market Capitalization
- 7. North America Cryptocurrency Market Analysis, Insights and Forecast, 2020-2032
- 7.1. Market Analysis, Insights and Forecast - by Market Capitalization
- 7.1.1. Bitcoin
- 7.1.2. Ethereum
- 7.1.3. Ripple
- 7.1.4. Bitcoin Cash
- 7.1.5. Cardano
- 7.1.6. Others
- 7.2. Market Analysis, Insights and Forecast - by Geography
- 7.3. Market Analysis, Insights and Forecast - by North America
- 7.3.1. United States
- 7.3.2. Canada
- 7.3.3. Mexico
- 7.3.4. Rest of North America
- 7.4. Market Analysis, Insights and Forecast - by Europe
- 7.4.1. United Kingdom
- 7.4.2. Germany
- 7.4.3. France
- 7.4.4. Russia
- 7.4.5. Italy
- 7.4.6. Spain
- 7.4.7. Rest of Europe
- 7.5. Market Analysis, Insights and Forecast - by Asia-Pacific
- 7.5.1. India
- 7.5.2. China
- 7.5.3. Japan
- 7.5.4. Australia
- 7.5.5. Rest of Asia-Pacific
- 7.6. Market Analysis, Insights and Forecast - by South America
- 7.6.1. Brazil
- 7.6.2. Argentina
- 7.6.3. Rest of South America
- 7.7. Market Analysis, Insights and Forecast - by Middle East & Africa
- 7.7.1. United Arab Emirates
- 7.7.2. South Africa
- 7.7.3. Rest of Middle East & Africa
- 7.1. Market Analysis, Insights and Forecast - by Market Capitalization
- 8. South America Cryptocurrency Market Analysis, Insights and Forecast, 2020-2032
- 8.1. Market Analysis, Insights and Forecast - by Market Capitalization
- 8.1.1. Bitcoin
- 8.1.2. Ethereum
- 8.1.3. Ripple
- 8.1.4. Bitcoin Cash
- 8.1.5. Cardano
- 8.1.6. Others
- 8.2. Market Analysis, Insights and Forecast - by Geography
- 8.3. Market Analysis, Insights and Forecast - by North America
- 8.3.1. United States
- 8.3.2. Canada
- 8.3.3. Mexico
- 8.3.4. Rest of North America
- 8.4. Market Analysis, Insights and Forecast - by Europe
- 8.4.1. United Kingdom
- 8.4.2. Germany
- 8.4.3. France
- 8.4.4. Russia
- 8.4.5. Italy
- 8.4.6. Spain
- 8.4.7. Rest of Europe
- 8.5. Market Analysis, Insights and Forecast - by Asia-Pacific
- 8.5.1. India
- 8.5.2. China
- 8.5.3. Japan
- 8.5.4. Australia
- 8.5.5. Rest of Asia-Pacific
- 8.6. Market Analysis, Insights and Forecast - by South America
- 8.6.1. Brazil
- 8.6.2. Argentina
- 8.6.3. Rest of South America
- 8.7. Market Analysis, Insights and Forecast - by Middle East & Africa
- 8.7.1. United Arab Emirates
- 8.7.2. South Africa
- 8.7.3. Rest of Middle East & Africa
- 8.1. Market Analysis, Insights and Forecast - by Market Capitalization
- 9. Europe Cryptocurrency Market Analysis, Insights and Forecast, 2020-2032
- 9.1. Market Analysis, Insights and Forecast - by Market Capitalization
- 9.1.1. Bitcoin
- 9.1.2. Ethereum
- 9.1.3. Ripple
- 9.1.4. Bitcoin Cash
- 9.1.5. Cardano
- 9.1.6. Others
- 9.2. Market Analysis, Insights and Forecast - by Geography
- 9.3. Market Analysis, Insights and Forecast - by North America
- 9.3.1. United States
- 9.3.2. Canada
- 9.3.3. Mexico
- 9.3.4. Rest of North America
- 9.4. Market Analysis, Insights and Forecast - by Europe
- 9.4.1. United Kingdom
- 9.4.2. Germany
- 9.4.3. France
- 9.4.4. Russia
- 9.4.5. Italy
- 9.4.6. Spain
- 9.4.7. Rest of Europe
- 9.5. Market Analysis, Insights and Forecast - by Asia-Pacific
- 9.5.1. India
- 9.5.2. China
- 9.5.3. Japan
- 9.5.4. Australia
- 9.5.5. Rest of Asia-Pacific
- 9.6. Market Analysis, Insights and Forecast - by South America
- 9.6.1. Brazil
- 9.6.2. Argentina
- 9.6.3. Rest of South America
- 9.7. Market Analysis, Insights and Forecast - by Middle East & Africa
- 9.7.1. United Arab Emirates
- 9.7.2. South Africa
- 9.7.3. Rest of Middle East & Africa
- 9.1. Market Analysis, Insights and Forecast - by Market Capitalization
- 10. Middle East & Africa Cryptocurrency Market Analysis, Insights and Forecast, 2020-2032
- 10.1. Market Analysis, Insights and Forecast - by Market Capitalization
- 10.1.1. Bitcoin
- 10.1.2. Ethereum
- 10.1.3. Ripple
- 10.1.4. Bitcoin Cash
- 10.1.5. Cardano
- 10.1.6. Others
- 10.2. Market Analysis, Insights and Forecast - by Geography
- 10.3. Market Analysis, Insights and Forecast - by North America
- 10.3.1. United States
- 10.3.2. Canada
- 10.3.3. Mexico
- 10.3.4. Rest of North America
- 10.4. Market Analysis, Insights and Forecast - by Europe
- 10.4.1. United Kingdom
- 10.4.2. Germany
- 10.4.3. France
- 10.4.4. Russia
- 10.4.5. Italy
- 10.4.6. Spain
- 10.4.7. Rest of Europe
- 10.5. Market Analysis, Insights and Forecast - by Asia-Pacific
- 10.5.1. India
- 10.5.2. China
- 10.5.3. Japan
- 10.5.4. Australia
- 10.5.5. Rest of Asia-Pacific
- 10.6. Market Analysis, Insights and Forecast - by South America
- 10.6.1. Brazil
- 10.6.2. Argentina
- 10.6.3. Rest of South America
- 10.7. Market Analysis, Insights and Forecast - by Middle East & Africa
- 10.7.1. United Arab Emirates
- 10.7.2. South Africa
- 10.7.3. Rest of Middle East & Africa
- 10.1. Market Analysis, Insights and Forecast - by Market Capitalization
- 11. Asia Pacific Cryptocurrency Market Analysis, Insights and Forecast, 2020-2032
- 11.1. Market Analysis, Insights and Forecast - by Market Capitalization
- 11.1.1. Bitcoin
- 11.1.2. Ethereum
- 11.1.3. Ripple
- 11.1.4. Bitcoin Cash
- 11.1.5. Cardano
- 11.1.6. Others
- 11.2. Market Analysis, Insights and Forecast - by Geography
- 11.3. Market Analysis, Insights and Forecast - by North America
- 11.3.1. United States
- 11.3.2. Canada
- 11.3.3. Mexico
- 11.3.4. Rest of North America
- 11.4. Market Analysis, Insights and Forecast - by Europe
- 11.4.1. United Kingdom
- 11.4.2. Germany
- 11.4.3. France
- 11.4.4. Russia
- 11.4.5. Italy
- 11.4.6. Spain
- 11.4.7. Rest of Europe
- 11.5. Market Analysis, Insights and Forecast - by Asia-Pacific
- 11.5.1. India
- 11.5.2. China
- 11.5.3. Japan
- 11.5.4. Australia
- 11.5.5. Rest of Asia-Pacific
- 11.6. Market Analysis, Insights and Forecast - by South America
- 11.6.1. Brazil
- 11.6.2. Argentina
- 11.6.3. Rest of South America
- 11.7. Market Analysis, Insights and Forecast - by Middle East & Africa
- 11.7.1. United Arab Emirates
- 11.7.2. South Africa
- 11.7.3. Rest of Middle East & Africa
- 11.1. Market Analysis, Insights and Forecast - by Market Capitalization
- 12. Competitive Analysis
- 12.1. Company Profiles
- 12.1.1 Bitfinex
- 12.1.1.1. Company Overview
- 12.1.1.2. Products
- 12.1.1.3. Company Financials
- 12.1.1.4. SWOT Analysis
- 12.1.2 Quantstamp Inc
- 12.1.2.1. Company Overview
- 12.1.2.2. Products
- 12.1.2.3. Company Financials
- 12.1.2.4. SWOT Analysis
- 12.1.3 CryptoMove Inc
- 12.1.3.1. Company Overview
- 12.1.3.2. Products
- 12.1.3.3. Company Financials
- 12.1.3.4. SWOT Analysis
- 12.1.4 Coinbase
- 12.1.4.1. Company Overview
- 12.1.4.2. Products
- 12.1.4.3. Company Financials
- 12.1.4.4. SWOT Analysis
- 12.1.5 Huobi Global
- 12.1.5.1. Company Overview
- 12.1.5.2. Products
- 12.1.5.3. Company Financials
- 12.1.5.4. SWOT Analysis
- 12.1.6 CoinCheck
- 12.1.6.1. Company Overview
- 12.1.6.2. Products
- 12.1.6.3. Company Financials
- 12.1.6.4. SWOT Analysis
- 12.1.7 Gemini
- 12.1.7.1. Company Overview
- 12.1.7.2. Products
- 12.1.7.3. Company Financials
- 12.1.7.4. SWOT Analysis
- 12.1.8 Bitfury
- 12.1.8.1. Company Overview
- 12.1.8.2. Products
- 12.1.8.3. Company Financials
- 12.1.8.4. SWOT Analysis
- 12.1.9 Binance
- 12.1.9.1. Company Overview
- 12.1.9.2. Products
- 12.1.9.3. Company Financials
- 12.1.9.4. SWOT Analysis
- 12.1.10 Cannan Inc**List Not Exhaustive
- 12.1.10.1. Company Overview
- 12.1.10.2. Products
- 12.1.10.3. Company Financials
- 12.1.10.4. SWOT Analysis
- 12.1.1 Bitfinex
- 12.2. Market Entropy
- 12.2.1 Company's Key Areas Served
- 12.2.2 Recent Developments
- 12.3. Company Market Share Analysis 2025
- 12.3.1 Top 5 Companies Market Share Analysis
- 12.3.2 Top 3 Companies Market Share Analysis
- 12.4. List of Potential Customers
- 13. Research Methodology
List of Figures
- Figure 1: Global Cryptocurrency Market Revenue Breakdown (Million, %) by Region 2025 & 2033
- Figure 2: Global Cryptocurrency Market Volume Breakdown (Billion, %) by Region 2025 & 2033
- Figure 3: North America Cryptocurrency Market Revenue (Million), by Market Capitalization 2025 & 2033
- Figure 4: North America Cryptocurrency Market Volume (Billion), by Market Capitalization 2025 & 2033
- Figure 5: North America Cryptocurrency Market Revenue Share (%), by Market Capitalization 2025 & 2033
- Figure 6: North America Cryptocurrency Market Volume Share (%), by Market Capitalization 2025 & 2033
- Figure 7: North America Cryptocurrency Market Revenue (Million), by Geography 2025 & 2033
- Figure 8: North America Cryptocurrency Market Volume (Billion), by Geography 2025 & 2033
- Figure 9: North America Cryptocurrency Market Revenue Share (%), by Geography 2025 & 2033
- Figure 10: North America Cryptocurrency Market Volume Share (%), by Geography 2025 & 2033
- Figure 11: North America Cryptocurrency Market Revenue (Million), by North America 2025 & 2033
- Figure 12: North America Cryptocurrency Market Volume (Billion), by North America 2025 & 2033
- Figure 13: North America Cryptocurrency Market Revenue Share (%), by North America 2025 & 2033
- Figure 14: North America Cryptocurrency Market Volume Share (%), by North America 2025 & 2033
- Figure 15: North America Cryptocurrency Market Revenue (Million), by Europe 2025 & 2033
- Figure 16: North America Cryptocurrency Market Volume (Billion), by Europe 2025 & 2033
- Figure 17: North America Cryptocurrency Market Revenue Share (%), by Europe 2025 & 2033
- Figure 18: North America Cryptocurrency Market Volume Share (%), by Europe 2025 & 2033
- Figure 19: North America Cryptocurrency Market Revenue (Million), by Asia-Pacific 2025 & 2033
- Figure 20: North America Cryptocurrency Market Volume (Billion), by Asia-Pacific 2025 & 2033
- Figure 21: North America Cryptocurrency Market Revenue Share (%), by Asia-Pacific 2025 & 2033
- Figure 22: North America Cryptocurrency Market Volume Share (%), by Asia-Pacific 2025 & 2033
- Figure 23: North America Cryptocurrency Market Revenue (Million), by South America 2025 & 2033
- Figure 24: North America Cryptocurrency Market Volume (Billion), by South America 2025 & 2033
- Figure 25: North America Cryptocurrency Market Revenue Share (%), by South America 2025 & 2033
- Figure 26: North America Cryptocurrency Market Volume Share (%), by South America 2025 & 2033
- Figure 27: North America Cryptocurrency Market Revenue (Million), by Middle East & Africa 2025 & 2033
- Figure 28: North America Cryptocurrency Market Volume (Billion), by Middle East & Africa 2025 & 2033
- Figure 29: North America Cryptocurrency Market Revenue Share (%), by Middle East & Africa 2025 & 2033
- Figure 30: North America Cryptocurrency Market Volume Share (%), by Middle East & Africa 2025 & 2033
- Figure 31: North America Cryptocurrency Market Revenue (Million), by Country 2025 & 2033
- Figure 32: North America Cryptocurrency Market Volume (Billion), by Country 2025 & 2033
- Figure 33: North America Cryptocurrency Market Revenue Share (%), by Country 2025 & 2033
- Figure 34: North America Cryptocurrency Market Volume Share (%), by Country 2025 & 2033
- Figure 35: South America Cryptocurrency Market Revenue (Million), by Market Capitalization 2025 & 2033
- Figure 36: South America Cryptocurrency Market Volume (Billion), by Market Capitalization 2025 & 2033
- Figure 37: South America Cryptocurrency Market Revenue Share (%), by Market Capitalization 2025 & 2033
- Figure 38: South America Cryptocurrency Market Volume Share (%), by Market Capitalization 2025 & 2033
- Figure 39: South America Cryptocurrency Market Revenue (Million), by Geography 2025 & 2033
- Figure 40: South America Cryptocurrency Market Volume (Billion), by Geography 2025 & 2033
- Figure 41: South America Cryptocurrency Market Revenue Share (%), by Geography 2025 & 2033
- Figure 42: South America Cryptocurrency Market Volume Share (%), by Geography 2025 & 2033
- Figure 43: South America Cryptocurrency Market Revenue (Million), by North America 2025 & 2033
- Figure 44: South America Cryptocurrency Market Volume (Billion), by North America 2025 & 2033
- Figure 45: South America Cryptocurrency Market Revenue Share (%), by North America 2025 & 2033
- Figure 46: South America Cryptocurrency Market Volume Share (%), by North America 2025 & 2033
- Figure 47: South America Cryptocurrency Market Revenue (Million), by Europe 2025 & 2033
- Figure 48: South America Cryptocurrency Market Volume (Billion), by Europe 2025 & 2033
- Figure 49: South America Cryptocurrency Market Revenue Share (%), by Europe 2025 & 2033
- Figure 50: South America Cryptocurrency Market Volume Share (%), by Europe 2025 & 2033
- Figure 51: South America Cryptocurrency Market Revenue (Million), by Asia-Pacific 2025 & 2033
- Figure 52: South America Cryptocurrency Market Volume (Billion), by Asia-Pacific 2025 & 2033
- Figure 53: South America Cryptocurrency Market Revenue Share (%), by Asia-Pacific 2025 & 2033
- Figure 54: South America Cryptocurrency Market Volume Share (%), by Asia-Pacific 2025 & 2033
- Figure 55: South America Cryptocurrency Market Revenue (Million), by South America 2025 & 2033
- Figure 56: South America Cryptocurrency Market Volume (Billion), by South America 2025 & 2033
- Figure 57: South America Cryptocurrency Market Revenue Share (%), by South America 2025 & 2033
- Figure 58: South America Cryptocurrency Market Volume Share (%), by South America 2025 & 2033
- Figure 59: South America Cryptocurrency Market Revenue (Million), by Middle East & Africa 2025 & 2033
- Figure 60: South America Cryptocurrency Market Volume (Billion), by Middle East & Africa 2025 & 2033
- Figure 61: South America Cryptocurrency Market Revenue Share (%), by Middle East & Africa 2025 & 2033
- Figure 62: South America Cryptocurrency Market Volume Share (%), by Middle East & Africa 2025 & 2033
- Figure 63: South America Cryptocurrency Market Revenue (Million), by Country 2025 & 2033
- Figure 64: South America Cryptocurrency Market Volume (Billion), by Country 2025 & 2033
- Figure 65: South America Cryptocurrency Market Revenue Share (%), by Country 2025 & 2033
- Figure 66: South America Cryptocurrency Market Volume Share (%), by Country 2025 & 2033
- Figure 67: Europe Cryptocurrency Market Revenue (Million), by Market Capitalization 2025 & 2033
- Figure 68: Europe Cryptocurrency Market Volume (Billion), by Market Capitalization 2025 & 2033
- Figure 69: Europe Cryptocurrency Market Revenue Share (%), by Market Capitalization 2025 & 2033
- Figure 70: Europe Cryptocurrency Market Volume Share (%), by Market Capitalization 2025 & 2033
- Figure 71: Europe Cryptocurrency Market Revenue (Million), by Geography 2025 & 2033
- Figure 72: Europe Cryptocurrency Market Volume (Billion), by Geography 2025 & 2033
- Figure 73: Europe Cryptocurrency Market Revenue Share (%), by Geography 2025 & 2033
- Figure 74: Europe Cryptocurrency Market Volume Share (%), by Geography 2025 & 2033
- Figure 75: Europe Cryptocurrency Market Revenue (Million), by North America 2025 & 2033
- Figure 76: Europe Cryptocurrency Market Volume (Billion), by North America 2025 & 2033
- Figure 77: Europe Cryptocurrency Market Revenue Share (%), by North America 2025 & 2033
- Figure 78: Europe Cryptocurrency Market Volume Share (%), by North America 2025 & 2033
- Figure 79: Europe Cryptocurrency Market Revenue (Million), by Europe 2025 & 2033
- Figure 80: Europe Cryptocurrency Market Volume (Billion), by Europe 2025 & 2033
- Figure 81: Europe Cryptocurrency Market Revenue Share (%), by Europe 2025 & 2033
- Figure 82: Europe Cryptocurrency Market Volume Share (%), by Europe 2025 & 2033
- Figure 83: Europe Cryptocurrency Market Revenue (Million), by Asia-Pacific 2025 & 2033
- Figure 84: Europe Cryptocurrency Market Volume (Billion), by Asia-Pacific 2025 & 2033
- Figure 85: Europe Cryptocurrency Market Revenue Share (%), by Asia-Pacific 2025 & 2033
- Figure 86: Europe Cryptocurrency Market Volume Share (%), by Asia-Pacific 2025 & 2033
- Figure 87: Europe Cryptocurrency Market Revenue (Million), by South America 2025 & 2033
- Figure 88: Europe Cryptocurrency Market Volume (Billion), by South America 2025 & 2033
- Figure 89: Europe Cryptocurrency Market Revenue Share (%), by South America 2025 & 2033
- Figure 90: Europe Cryptocurrency Market Volume Share (%), by South America 2025 & 2033
- Figure 91: Europe Cryptocurrency Market Revenue (Million), by Middle East & Africa 2025 & 2033
- Figure 92: Europe Cryptocurrency Market Volume (Billion), by Middle East & Africa 2025 & 2033
- Figure 93: Europe Cryptocurrency Market Revenue Share (%), by Middle East & Africa 2025 & 2033
- Figure 94: Europe Cryptocurrency Market Volume Share (%), by Middle East & Africa 2025 & 2033
- Figure 95: Europe Cryptocurrency Market Revenue (Million), by Country 2025 & 2033
- Figure 96: Europe Cryptocurrency Market Volume (Billion), by Country 2025 & 2033
- Figure 97: Europe Cryptocurrency Market Revenue Share (%), by Country 2025 & 2033
- Figure 98: Europe Cryptocurrency Market Volume Share (%), by Country 2025 & 2033
- Figure 99: Middle East & Africa Cryptocurrency Market Revenue (Million), by Market Capitalization 2025 & 2033
- Figure 100: Middle East & Africa Cryptocurrency Market Volume (Billion), by Market Capitalization 2025 & 2033
- Figure 101: Middle East & Africa Cryptocurrency Market Revenue Share (%), by Market Capitalization 2025 & 2033
- Figure 102: Middle East & Africa Cryptocurrency Market Volume Share (%), by Market Capitalization 2025 & 2033
- Figure 103: Middle East & Africa Cryptocurrency Market Revenue (Million), by Geography 2025 & 2033
- Figure 104: Middle East & Africa Cryptocurrency Market Volume (Billion), by Geography 2025 & 2033
- Figure 105: Middle East & Africa Cryptocurrency Market Revenue Share (%), by Geography 2025 & 2033
- Figure 106: Middle East & Africa Cryptocurrency Market Volume Share (%), by Geography 2025 & 2033
- Figure 107: Middle East & Africa Cryptocurrency Market Revenue (Million), by North America 2025 & 2033
- Figure 108: Middle East & Africa Cryptocurrency Market Volume (Billion), by North America 2025 & 2033
- Figure 109: Middle East & Africa Cryptocurrency Market Revenue Share (%), by North America 2025 & 2033
- Figure 110: Middle East & Africa Cryptocurrency Market Volume Share (%), by North America 2025 & 2033
- Figure 111: Middle East & Africa Cryptocurrency Market Revenue (Million), by Europe 2025 & 2033
- Figure 112: Middle East & Africa Cryptocurrency Market Volume (Billion), by Europe 2025 & 2033
- Figure 113: Middle East & Africa Cryptocurrency Market Revenue Share (%), by Europe 2025 & 2033
- Figure 114: Middle East & Africa Cryptocurrency Market Volume Share (%), by Europe 2025 & 2033
- Figure 115: Middle East & Africa Cryptocurrency Market Revenue (Million), by Asia-Pacific 2025 & 2033
- Figure 116: Middle East & Africa Cryptocurrency Market Volume (Billion), by Asia-Pacific 2025 & 2033
- Figure 117: Middle East & Africa Cryptocurrency Market Revenue Share (%), by Asia-Pacific 2025 & 2033
- Figure 118: Middle East & Africa Cryptocurrency Market Volume Share (%), by Asia-Pacific 2025 & 2033
- Figure 119: Middle East & Africa Cryptocurrency Market Revenue (Million), by South America 2025 & 2033
- Figure 120: Middle East & Africa Cryptocurrency Market Volume (Billion), by South America 2025 & 2033
- Figure 121: Middle East & Africa Cryptocurrency Market Revenue Share (%), by South America 2025 & 2033
- Figure 122: Middle East & Africa Cryptocurrency Market Volume Share (%), by South America 2025 & 2033
- Figure 123: Middle East & Africa Cryptocurrency Market Revenue (Million), by Middle East & Africa 2025 & 2033
- Figure 124: Middle East & Africa Cryptocurrency Market Volume (Billion), by Middle East & Africa 2025 & 2033
- Figure 125: Middle East & Africa Cryptocurrency Market Revenue Share (%), by Middle East & Africa 2025 & 2033
- Figure 126: Middle East & Africa Cryptocurrency Market Volume Share (%), by Middle East & Africa 2025 & 2033
- Figure 127: Middle East & Africa Cryptocurrency Market Revenue (Million), by Country 2025 & 2033
- Figure 128: Middle East & Africa Cryptocurrency Market Volume (Billion), by Country 2025 & 2033
- Figure 129: Middle East & Africa Cryptocurrency Market Revenue Share (%), by Country 2025 & 2033
- Figure 130: Middle East & Africa Cryptocurrency Market Volume Share (%), by Country 2025 & 2033
- Figure 131: Asia Pacific Cryptocurrency Market Revenue (Million), by Market Capitalization 2025 & 2033
- Figure 132: Asia Pacific Cryptocurrency Market Volume (Billion), by Market Capitalization 2025 & 2033
- Figure 133: Asia Pacific Cryptocurrency Market Revenue Share (%), by Market Capitalization 2025 & 2033
- Figure 134: Asia Pacific Cryptocurrency Market Volume Share (%), by Market Capitalization 2025 & 2033
- Figure 135: Asia Pacific Cryptocurrency Market Revenue (Million), by Geography 2025 & 2033
- Figure 136: Asia Pacific Cryptocurrency Market Volume (Billion), by Geography 2025 & 2033
- Figure 137: Asia Pacific Cryptocurrency Market Revenue Share (%), by Geography 2025 & 2033
- Figure 138: Asia Pacific Cryptocurrency Market Volume Share (%), by Geography 2025 & 2033
- Figure 139: Asia Pacific Cryptocurrency Market Revenue (Million), by North America 2025 & 2033
- Figure 140: Asia Pacific Cryptocurrency Market Volume (Billion), by North America 2025 & 2033
- Figure 141: Asia Pacific Cryptocurrency Market Revenue Share (%), by North America 2025 & 2033
- Figure 142: Asia Pacific Cryptocurrency Market Volume Share (%), by North America 2025 & 2033
- Figure 143: Asia Pacific Cryptocurrency Market Revenue (Million), by Europe 2025 & 2033
- Figure 144: Asia Pacific Cryptocurrency Market Volume (Billion), by Europe 2025 & 2033
- Figure 145: Asia Pacific Cryptocurrency Market Revenue Share (%), by Europe 2025 & 2033
- Figure 146: Asia Pacific Cryptocurrency Market Volume Share (%), by Europe 2025 & 2033
- Figure 147: Asia Pacific Cryptocurrency Market Revenue (Million), by Asia-Pacific 2025 & 2033
- Figure 148: Asia Pacific Cryptocurrency Market Volume (Billion), by Asia-Pacific 2025 & 2033
- Figure 149: Asia Pacific Cryptocurrency Market Revenue Share (%), by Asia-Pacific 2025 & 2033
- Figure 150: Asia Pacific Cryptocurrency Market Volume Share (%), by Asia-Pacific 2025 & 2033
- Figure 151: Asia Pacific Cryptocurrency Market Revenue (Million), by South America 2025 & 2033
- Figure 152: Asia Pacific Cryptocurrency Market Volume (Billion), by South America 2025 & 2033
- Figure 153: Asia Pacific Cryptocurrency Market Revenue Share (%), by South America 2025 & 2033
- Figure 154: Asia Pacific Cryptocurrency Market Volume Share (%), by South America 2025 & 2033
- Figure 155: Asia Pacific Cryptocurrency Market Revenue (Million), by Middle East & Africa 2025 & 2033
- Figure 156: Asia Pacific Cryptocurrency Market Volume (Billion), by Middle East & Africa 2025 & 2033
- Figure 157: Asia Pacific Cryptocurrency Market Revenue Share (%), by Middle East & Africa 2025 & 2033
- Figure 158: Asia Pacific Cryptocurrency Market Volume Share (%), by Middle East & Africa 2025 & 2033
- Figure 159: Asia Pacific Cryptocurrency Market Revenue (Million), by Country 2025 & 2033
- Figure 160: Asia Pacific Cryptocurrency Market Volume (Billion), by Country 2025 & 2033
- Figure 161: Asia Pacific Cryptocurrency Market Revenue Share (%), by Country 2025 & 2033
- Figure 162: Asia Pacific Cryptocurrency Market Volume Share (%), by Country 2025 & 2033
List of Tables
- Table 1: Global Cryptocurrency Market Revenue Million Forecast, by Market Capitalization 2020 & 2033
- Table 2: Global Cryptocurrency Market Volume Billion Forecast, by Market Capitalization 2020 & 2033
- Table 3: Global Cryptocurrency Market Revenue Million Forecast, by Geography 2020 & 2033
- Table 4: Global Cryptocurrency Market Volume Billion Forecast, by Geography 2020 & 2033
- Table 5: Global Cryptocurrency Market Revenue Million Forecast, by North America 2020 & 2033
- Table 6: Global Cryptocurrency Market Volume Billion Forecast, by North America 2020 & 2033
- Table 7: Global Cryptocurrency Market Revenue Million Forecast, by Europe 2020 & 2033
- Table 8: Global Cryptocurrency Market Volume Billion Forecast, by Europe 2020 & 2033
- Table 9: Global Cryptocurrency Market Revenue Million Forecast, by Asia-Pacific 2020 & 2033
- Table 10: Global Cryptocurrency Market Volume Billion Forecast, by Asia-Pacific 2020 & 2033
- Table 11: Global Cryptocurrency Market Revenue Million Forecast, by South America 2020 & 2033
- Table 12: Global Cryptocurrency Market Volume Billion Forecast, by South America 2020 & 2033
- Table 13: Global Cryptocurrency Market Revenue Million Forecast, by Middle East & Africa 2020 & 2033
- Table 14: Global Cryptocurrency Market Volume Billion Forecast, by Middle East & Africa 2020 & 2033
- Table 15: Global Cryptocurrency Market Revenue Million Forecast, by Region 2020 & 2033
- Table 16: Global Cryptocurrency Market Volume Billion Forecast, by Region 2020 & 2033
- Table 17: Global Cryptocurrency Market Revenue Million Forecast, by Market Capitalization 2020 & 2033
- Table 18: Global Cryptocurrency Market Volume Billion Forecast, by Market Capitalization 2020 & 2033
- Table 19: Global Cryptocurrency Market Revenue Million Forecast, by Geography 2020 & 2033
- Table 20: Global Cryptocurrency Market Volume Billion Forecast, by Geography 2020 & 2033
- Table 21: Global Cryptocurrency Market Revenue Million Forecast, by North America 2020 & 2033
- Table 22: Global Cryptocurrency Market Volume Billion Forecast, by North America 2020 & 2033
- Table 23: Global Cryptocurrency Market Revenue Million Forecast, by Europe 2020 & 2033
- Table 24: Global Cryptocurrency Market Volume Billion Forecast, by Europe 2020 & 2033
- Table 25: Global Cryptocurrency Market Revenue Million Forecast, by Asia-Pacific 2020 & 2033
- Table 26: Global Cryptocurrency Market Volume Billion Forecast, by Asia-Pacific 2020 & 2033
- Table 27: Global Cryptocurrency Market Revenue Million Forecast, by South America 2020 & 2033
- Table 28: Global Cryptocurrency Market Volume Billion Forecast, by South America 2020 & 2033
- Table 29: Global Cryptocurrency Market Revenue Million Forecast, by Middle East & Africa 2020 & 2033
- Table 30: Global Cryptocurrency Market Volume Billion Forecast, by Middle East & Africa 2020 & 2033
- Table 31: Global Cryptocurrency Market Revenue Million Forecast, by Country 2020 & 2033
- Table 32: Global Cryptocurrency Market Volume Billion Forecast, by Country 2020 & 2033
- Table 33: United States Cryptocurrency Market Revenue (Million) Forecast, by Application 2020 & 2033
- Table 34: United States Cryptocurrency Market Volume (Billion) Forecast, by Application 2020 & 2033
- Table 35: Canada Cryptocurrency Market Revenue (Million) Forecast, by Application 2020 & 2033
- Table 36: Canada Cryptocurrency Market Volume (Billion) Forecast, by Application 2020 & 2033
- Table 37: Mexico Cryptocurrency Market Revenue (Million) Forecast, by Application 2020 & 2033
- Table 38: Mexico Cryptocurrency Market Volume (Billion) Forecast, by Application 2020 & 2033
- Table 39: Global Cryptocurrency Market Revenue Million Forecast, by Market Capitalization 2020 & 2033
- Table 40: Global Cryptocurrency Market Volume Billion Forecast, by Market Capitalization 2020 & 2033
- Table 41: Global Cryptocurrency Market Revenue Million Forecast, by Geography 2020 & 2033
- Table 42: Global Cryptocurrency Market Volume Billion Forecast, by Geography 2020 & 2033
- Table 43: Global Cryptocurrency Market Revenue Million Forecast, by North America 2020 & 2033
- Table 44: Global Cryptocurrency Market Volume Billion Forecast, by North America 2020 & 2033
- Table 45: Global Cryptocurrency Market Revenue Million Forecast, by Europe 2020 & 2033
- Table 46: Global Cryptocurrency Market Volume Billion Forecast, by Europe 2020 & 2033
- Table 47: Global Cryptocurrency Market Revenue Million Forecast, by Asia-Pacific 2020 & 2033
- Table 48: Global Cryptocurrency Market Volume Billion Forecast, by Asia-Pacific 2020 & 2033
- Table 49: Global Cryptocurrency Market Revenue Million Forecast, by South America 2020 & 2033
- Table 50: Global Cryptocurrency Market Volume Billion Forecast, by South America 2020 & 2033
- Table 51: Global Cryptocurrency Market Revenue Million Forecast, by Middle East & Africa 2020 & 2033
- Table 52: Global Cryptocurrency Market Volume Billion Forecast, by Middle East & Africa 2020 & 2033
- Table 53: Global Cryptocurrency Market Revenue Million Forecast, by Country 2020 & 2033
- Table 54: Global Cryptocurrency Market Volume Billion Forecast, by Country 2020 & 2033
- Table 55: Brazil Cryptocurrency Market Revenue (Million) Forecast, by Application 2020 & 2033
- Table 56: Brazil Cryptocurrency Market Volume (Billion) Forecast, by Application 2020 & 2033
- Table 57: Argentina Cryptocurrency Market Revenue (Million) Forecast, by Application 2020 & 2033
- Table 58: Argentina Cryptocurrency Market Volume (Billion) Forecast, by Application 2020 & 2033
- Table 59: Rest of South America Cryptocurrency Market Revenue (Million) Forecast, by Application 2020 & 2033
- Table 60: Rest of South America Cryptocurrency Market Volume (Billion) Forecast, by Application 2020 & 2033
- Table 61: Global Cryptocurrency Market Revenue Million Forecast, by Market Capitalization 2020 & 2033
- Table 62: Global Cryptocurrency Market Volume Billion Forecast, by Market Capitalization 2020 & 2033
- Table 63: Global Cryptocurrency Market Revenue Million Forecast, by Geography 2020 & 2033
- Table 64: Global Cryptocurrency Market Volume Billion Forecast, by Geography 2020 & 2033
- Table 65: Global Cryptocurrency Market Revenue Million Forecast, by North America 2020 & 2033
- Table 66: Global Cryptocurrency Market Volume Billion Forecast, by North America 2020 & 2033
- Table 67: Global Cryptocurrency Market Revenue Million Forecast, by Europe 2020 & 2033
- Table 68: Global Cryptocurrency Market Volume Billion Forecast, by Europe 2020 & 2033
- Table 69: Global Cryptocurrency Market Revenue Million Forecast, by Asia-Pacific 2020 & 2033
- Table 70: Global Cryptocurrency Market Volume Billion Forecast, by Asia-Pacific 2020 & 2033
- Table 71: Global Cryptocurrency Market Revenue Million Forecast, by South America 2020 & 2033
- Table 72: Global Cryptocurrency Market Volume Billion Forecast, by South America 2020 & 2033
- Table 73: Global Cryptocurrency Market Revenue Million Forecast, by Middle East & Africa 2020 & 2033
- Table 74: Global Cryptocurrency Market Volume Billion Forecast, by Middle East & Africa 2020 & 2033
- Table 75: Global Cryptocurrency Market Revenue Million Forecast, by Country 2020 & 2033
- Table 76: Global Cryptocurrency Market Volume Billion Forecast, by Country 2020 & 2033
- Table 77: United Kingdom Cryptocurrency Market Revenue (Million) Forecast, by Application 2020 & 2033
- Table 78: United Kingdom Cryptocurrency Market Volume (Billion) Forecast, by Application 2020 & 2033
- Table 79: Germany Cryptocurrency Market Revenue (Million) Forecast, by Application 2020 & 2033
- Table 80: Germany Cryptocurrency Market Volume (Billion) Forecast, by Application 2020 & 2033
- Table 81: France Cryptocurrency Market Revenue (Million) Forecast, by Application 2020 & 2033
- Table 82: France Cryptocurrency Market Volume (Billion) Forecast, by Application 2020 & 2033
- Table 83: Italy Cryptocurrency Market Revenue (Million) Forecast, by Application 2020 & 2033
- Table 84: Italy Cryptocurrency Market Volume (Billion) Forecast, by Application 2020 & 2033
- Table 85: Spain Cryptocurrency Market Revenue (Million) Forecast, by Application 2020 & 2033
- Table 86: Spain Cryptocurrency Market Volume (Billion) Forecast, by Application 2020 & 2033
- Table 87: Russia Cryptocurrency Market Revenue (Million) Forecast, by Application 2020 & 2033
- Table 88: Russia Cryptocurrency Market Volume (Billion) Forecast, by Application 2020 & 2033
- Table 89: Benelux Cryptocurrency Market Revenue (Million) Forecast, by Application 2020 & 2033
- Table 90: Benelux Cryptocurrency Market Volume (Billion) Forecast, by Application 2020 & 2033
- Table 91: Nordics Cryptocurrency Market Revenue (Million) Forecast, by Application 2020 & 2033
- Table 92: Nordics Cryptocurrency Market Volume (Billion) Forecast, by Application 2020 & 2033
- Table 93: Rest of Europe Cryptocurrency Market Revenue (Million) Forecast, by Application 2020 & 2033
- Table 94: Rest of Europe Cryptocurrency Market Volume (Billion) Forecast, by Application 2020 & 2033
- Table 95: Global Cryptocurrency Market Revenue Million Forecast, by Market Capitalization 2020 & 2033
- Table 96: Global Cryptocurrency Market Volume Billion Forecast, by Market Capitalization 2020 & 2033
- Table 97: Global Cryptocurrency Market Revenue Million Forecast, by Geography 2020 & 2033
- Table 98: Global Cryptocurrency Market Volume Billion Forecast, by Geography 2020 & 2033
- Table 99: Global Cryptocurrency Market Revenue Million Forecast, by North America 2020 & 2033
- Table 100: Global Cryptocurrency Market Volume Billion Forecast, by North America 2020 & 2033
- Table 101: Global Cryptocurrency Market Revenue Million Forecast, by Europe 2020 & 2033
- Table 102: Global Cryptocurrency Market Volume Billion Forecast, by Europe 2020 & 2033
- Table 103: Global Cryptocurrency Market Revenue Million Forecast, by Asia-Pacific 2020 & 2033
- Table 104: Global Cryptocurrency Market Volume Billion Forecast, by Asia-Pacific 2020 & 2033
- Table 105: Global Cryptocurrency Market Revenue Million Forecast, by South America 2020 & 2033
- Table 106: Global Cryptocurrency Market Volume Billion Forecast, by South America 2020 & 2033
- Table 107: Global Cryptocurrency Market Revenue Million Forecast, by Middle East & Africa 2020 & 2033
- Table 108: Global Cryptocurrency Market Volume Billion Forecast, by Middle East & Africa 2020 & 2033
- Table 109: Global Cryptocurrency Market Revenue Million Forecast, by Country 2020 & 2033
- Table 110: Global Cryptocurrency Market Volume Billion Forecast, by Country 2020 & 2033
- Table 111: Turkey Cryptocurrency Market Revenue (Million) Forecast, by Application 2020 & 2033
- Table 112: Turkey Cryptocurrency Market Volume (Billion) Forecast, by Application 2020 & 2033
- Table 113: Israel Cryptocurrency Market Revenue (Million) Forecast, by Application 2020 & 2033
- Table 114: Israel Cryptocurrency Market Volume (Billion) Forecast, by Application 2020 & 2033
- Table 115: GCC Cryptocurrency Market Revenue (Million) Forecast, by Application 2020 & 2033
- Table 116: GCC Cryptocurrency Market Volume (Billion) Forecast, by Application 2020 & 2033
- Table 117: North Africa Cryptocurrency Market Revenue (Million) Forecast, by Application 2020 & 2033
- Table 118: North Africa Cryptocurrency Market Volume (Billion) Forecast, by Application 2020 & 2033
- Table 119: South Africa Cryptocurrency Market Revenue (Million) Forecast, by Application 2020 & 2033
- Table 120: South Africa Cryptocurrency Market Volume (Billion) Forecast, by Application 2020 & 2033
- Table 121: Rest of Middle East & Africa Cryptocurrency Market Revenue (Million) Forecast, by Application 2020 & 2033
- Table 122: Rest of Middle East & Africa Cryptocurrency Market Volume (Billion) Forecast, by Application 2020 & 2033
- Table 123: Global Cryptocurrency Market Revenue Million Forecast, by Market Capitalization 2020 & 2033
- Table 124: Global Cryptocurrency Market Volume Billion Forecast, by Market Capitalization 2020 & 2033
- Table 125: Global Cryptocurrency Market Revenue Million Forecast, by Geography 2020 & 2033
- Table 126: Global Cryptocurrency Market Volume Billion Forecast, by Geography 2020 & 2033
- Table 127: Global Cryptocurrency Market Revenue Million Forecast, by North America 2020 & 2033
- Table 128: Global Cryptocurrency Market Volume Billion Forecast, by North America 2020 & 2033
- Table 129: Global Cryptocurrency Market Revenue Million Forecast, by Europe 2020 & 2033
- Table 130: Global Cryptocurrency Market Volume Billion Forecast, by Europe 2020 & 2033
- Table 131: Global Cryptocurrency Market Revenue Million Forecast, by Asia-Pacific 2020 & 2033
- Table 132: Global Cryptocurrency Market Volume Billion Forecast, by Asia-Pacific 2020 & 2033
- Table 133: Global Cryptocurrency Market Revenue Million Forecast, by South America 2020 & 2033
- Table 134: Global Cryptocurrency Market Volume Billion Forecast, by South America 2020 & 2033
- Table 135: Global Cryptocurrency Market Revenue Million Forecast, by Middle East & Africa 2020 & 2033
- Table 136: Global Cryptocurrency Market Volume Billion Forecast, by Middle East & Africa 2020 & 2033
- Table 137: Global Cryptocurrency Market Revenue Million Forecast, by Country 2020 & 2033
- Table 138: Global Cryptocurrency Market Volume Billion Forecast, by Country 2020 & 2033
- Table 139: China Cryptocurrency Market Revenue (Million) Forecast, by Application 2020 & 2033
- Table 140: China Cryptocurrency Market Volume (Billion) Forecast, by Application 2020 & 2033
- Table 141: India Cryptocurrency Market Revenue (Million) Forecast, by Application 2020 & 2033
- Table 142: India Cryptocurrency Market Volume (Billion) Forecast, by Application 2020 & 2033
- Table 143: Japan Cryptocurrency Market Revenue (Million) Forecast, by Application 2020 & 2033
- Table 144: Japan Cryptocurrency Market Volume (Billion) Forecast, by Application 2020 & 2033
- Table 145: South Korea Cryptocurrency Market Revenue (Million) Forecast, by Application 2020 & 2033
- Table 146: South Korea Cryptocurrency Market Volume (Billion) Forecast, by Application 2020 & 2033
- Table 147: ASEAN Cryptocurrency Market Revenue (Million) Forecast, by Application 2020 & 2033
- Table 148: ASEAN Cryptocurrency Market Volume (Billion) Forecast, by Application 2020 & 2033
- Table 149: Oceania Cryptocurrency Market Revenue (Million) Forecast, by Application 2020 & 2033
- Table 150: Oceania Cryptocurrency Market Volume (Billion) Forecast, by Application 2020 & 2033
- Table 151: Rest of Asia Pacific Cryptocurrency Market Revenue (Million) Forecast, by Application 2020 & 2033
- Table 152: Rest of Asia Pacific Cryptocurrency Market Volume (Billion) Forecast, by Application 2020 & 2033
Frequently Asked Questions
1. What is the projected Compound Annual Growth Rate (CAGR) of the Cryptocurrency Market?
The projected CAGR is approximately 7.77%.
2. Which companies are prominent players in the Cryptocurrency Market?
Key companies in the market include Bitfinex, Quantstamp Inc, CryptoMove Inc, Coinbase, Huobi Global, CoinCheck, Gemini, Bitfury, Binance, Cannan Inc**List Not Exhaustive.
3. What are the main segments of the Cryptocurrency Market?
The market segments include Market Capitalization, Geography, North America, Europe, Asia-Pacific, South America, Middle East & Africa.
4. Can you provide details about the market size?
The market size is estimated to be USD 44.29 Million as of 2022.
5. What are some drivers contributing to market growth?
Rising Demand for Operational Efficiency and Transparency in Financial Payment Systems; Increasing Demand for Remittances in Developing Countries.
6. What are the notable trends driving market growth?
Increasing Adoption of Digital Assets is Expected to Drive the Growth of this Market.
7. Are there any restraints impacting market growth?
Rising Demand for Operational Efficiency and Transparency in Financial Payment Systems; Increasing Demand for Remittances in Developing Countries.
8. Can you provide examples of recent developments in the market?
December 2023: Bitfinex Securities Ltd. secured USD 5.2 million in USDT by leveraging its tokenized bond ALT2612. The fundraising initiative was made possible through the assistance of ALTERNATIVE, a securitization fund based in Luxembourg and managed by Mikro Kapita, a renowned microfinancing company.
9. What pricing options are available for accessing the report?
Pricing options include single-user, multi-user, and enterprise licenses priced at USD 4750, USD 5250, and USD 8750 respectively.
10. Is the market size provided in terms of value or volume?
The market size is provided in terms of value, measured in Million and volume, measured in Billion.
11. Are there any specific market keywords associated with the report?
Yes, the market keyword associated with the report is "Cryptocurrency Market," which aids in identifying and referencing the specific market segment covered.
12. How do I determine which pricing option suits my needs best?
The pricing options vary based on user requirements and access needs. Individual users may opt for single-user licenses, while businesses requiring broader access may choose multi-user or enterprise licenses for cost-effective access to the report.
13. Are there any additional resources or data provided in the Cryptocurrency Market report?
While the report offers comprehensive insights, it's advisable to review the specific contents or supplementary materials provided to ascertain if additional resources or data are available.
14. How can I stay updated on further developments or reports in the Cryptocurrency Market?
To stay informed about further developments, trends, and reports in the Cryptocurrency Market, consider subscribing to industry newsletters, following relevant companies and organizations, or regularly checking reputable industry news sources and publications.
Methodology
Step 1 - Identification of Relevant Samples Size from Population Database


Step 2 - Approaches for Defining Global Market Size (Value, Volume* & Price*)

Note*: In applicable scenarios
Step 3 - Data Sources
Primary Research
- Web Analytics
- Survey Reports
- Research Institute
- Latest Research Reports
- Opinion Leaders
Secondary Research
- Annual Reports
- White Paper
- Latest Press Release
- Industry Association
- Paid Database
- Investor Presentations

Step 4 - Data Triangulation
Involves using different sources of information in order to increase the validity of a study
These sources are likely to be stakeholders in a program - participants, other researchers, program staff, other community members, and so on.
Then we put all data in single framework & apply various statistical tools to find out the dynamic on the market.
During the analysis stage, feedback from the stakeholder groups would be compared to determine areas of agreement as well as areas of divergence