

Key Insights
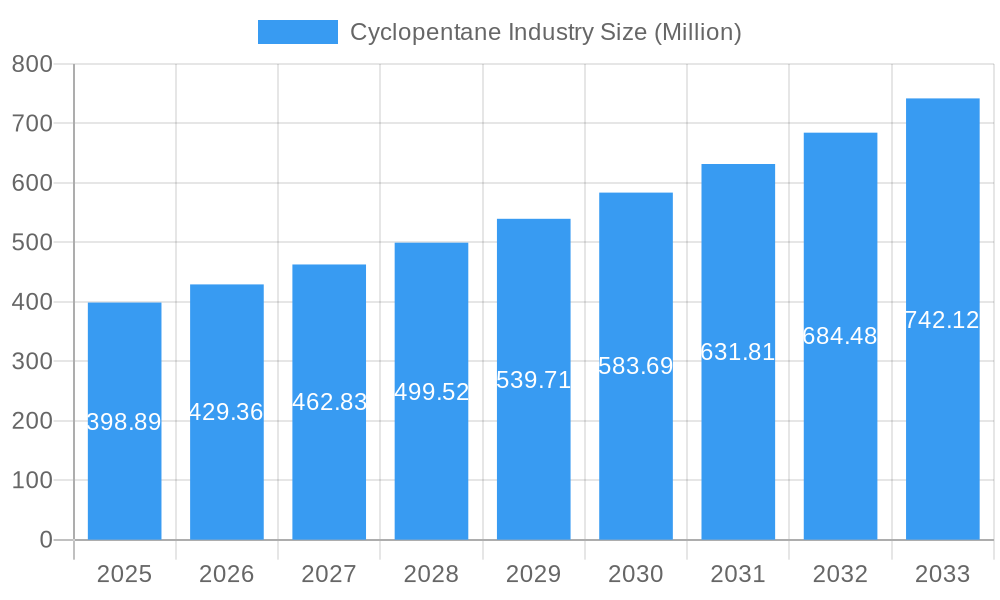
The cyclopentane market, valued at $398.89 million in 2025, is projected to experience robust growth, exhibiting a Compound Annual Growth Rate (CAGR) exceeding 7.50% from 2025 to 2033. This expansion is driven primarily by the increasing demand for cyclopentane as a blowing agent in the production of rigid polyurethane foams, particularly within the refrigeration and insulation sectors. The rising construction activities globally, coupled with stringent energy efficiency regulations, further fuel this demand. Technological advancements in foam production techniques that enhance the efficiency and performance of cyclopentane-based foams also contribute to market growth. However, the market faces challenges, including concerns regarding the environmental impact of certain applications and the volatility of raw material prices. Competition among established players like Dymatic Chemicals Inc., Haldia Petrochemicals Limited, and INEOS is intense, leading to price pressures and necessitating continuous innovation in product offerings and production processes. The market segmentation is likely to see further differentiation based on application (refrigeration, insulation, etc.), purity level, and geographical region, creating opportunities for specialized manufacturers to cater to niche segments.
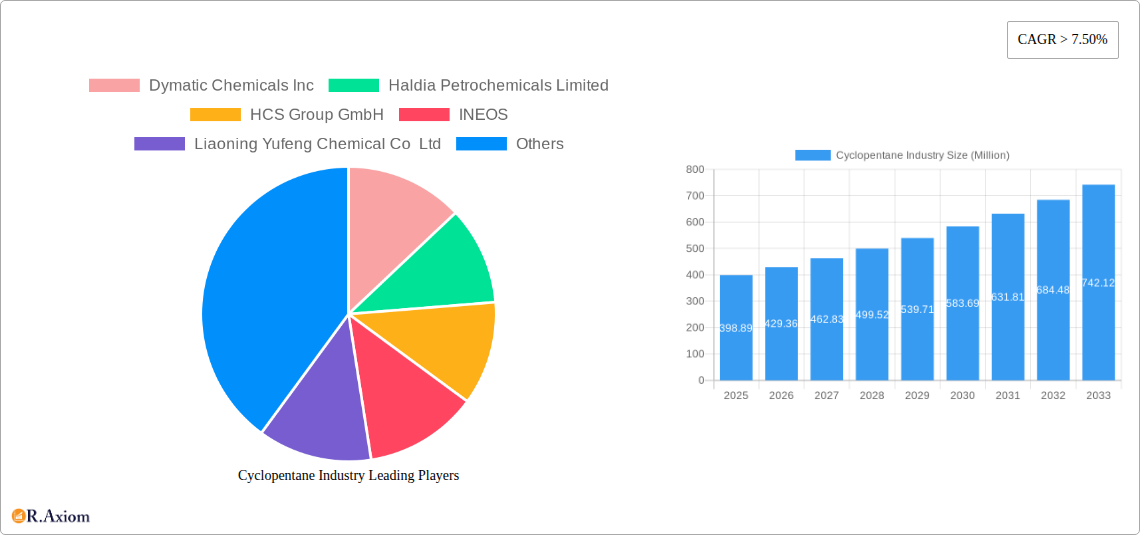
Cyclopentane Industry Market Size (In Million)
The forecast period (2025-2033) anticipates a continued upward trajectory, driven by ongoing advancements in foam technology and increasing adoption in emerging economies. Strategies focused on sustainability, such as exploring bio-based alternatives and improving production efficiency to minimize environmental impact, will be crucial for long-term success in this market. Furthermore, companies are likely to invest in research and development to discover innovative applications and optimize their production processes, aiming for better cost-effectiveness and environmental responsibility. This competitive landscape will continue to encourage mergers and acquisitions, driving consolidation within the industry and shaping the future dynamics of the cyclopentane market.
Cyclopentane Industry Company Market Share
This comprehensive report provides a detailed analysis of the global cyclopentane industry, offering invaluable insights for stakeholders, investors, and industry professionals. The report covers the period 2019-2033, with a base year of 2025 and a forecast period of 2025-2033. The study meticulously examines market size, growth drivers, challenges, and emerging opportunities, providing actionable intelligence for strategic decision-making. Key players such as Dymatic Chemicals Inc, Haldia Petrochemicals Limited, HCS Group GmbH, INEOS, Liaoning Yufeng Chemical Co Ltd, Meilong Cyclopentane Chemical Co Ltd, Merck KGaA, PURECHEM CO KR, SINTECO S R L, TRECORA RESOURCES, and YEOCHUN NCC CO LTD (list not exhaustive) are analyzed, highlighting their market share, strategic initiatives, and competitive landscape. The report also provides a granular segmentation analysis, enabling a deeper understanding of market dynamics across various segments and geographies.
Cyclopentane Industry Market Concentration & Innovation
This section analyzes the competitive landscape of the cyclopentane industry, assessing market concentration, innovation drivers, regulatory frameworks, substitute products, end-user trends, and mergers & acquisitions (M&A) activities. The market is characterized by a moderately concentrated structure, with the top five players holding an estimated xx% market share in 2025. Innovation in cyclopentane production is driven by the demand for environmentally friendly refrigerants and blowing agents, prompting companies to invest in more efficient and sustainable manufacturing processes. Stringent environmental regulations are shaping industry practices, encouraging the adoption of cleaner technologies. Several M&A activities have occurred in the past five years, with deal values totaling approximately $XX Million.
- Market Concentration: Top 5 players hold xx% market share (2025).
- Innovation Drivers: Sustainable manufacturing, environmentally friendly products.
- Regulatory Frameworks: Stringent environmental regulations driving cleaner production.
- Product Substitutes: Limited direct substitutes, but competition from alternative blowing agents exists.
- End-User Trends: Growing demand in refrigeration and foam insulation sectors.
- M&A Activity: Total deal value of approximately $XX Million in the past five years.
Cyclopentane Industry Industry Trends & Insights
The global cyclopentane market exhibits robust growth, driven by rising demand from the refrigeration and foam insulation industries. The market is expected to witness a Compound Annual Growth Rate (CAGR) of xx% during the forecast period (2025-2033). This growth is fueled by increasing construction activities globally, particularly in emerging economies, and a growing preference for energy-efficient building materials. Technological advancements in cyclopentane production processes, such as improved catalyst efficiency and reduced energy consumption, further contribute to market expansion. However, price fluctuations of raw materials and potential regulatory changes pose challenges to market growth. Market penetration in developing regions is also expected to increase significantly, reaching xx% by 2033.
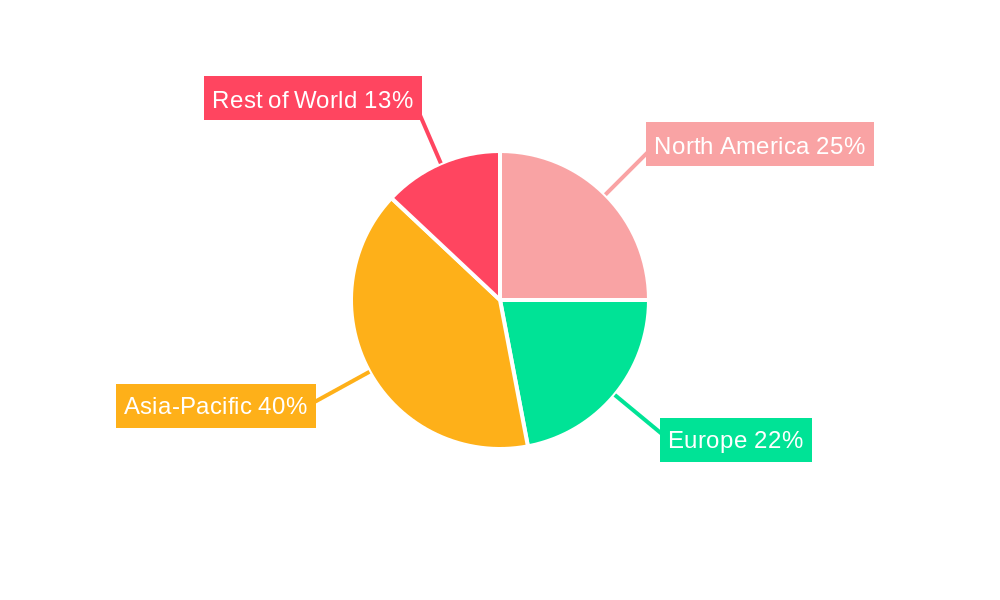
Dominant Markets & Segments in Cyclopentane Industry
The Asia-Pacific region currently dominates the global cyclopentane market, accounting for approximately xx% of the total market share in 2025. This dominance is attributed to several factors:
- Rapid Economic Growth: High industrialization and infrastructure development drive demand.
- Growing Construction Sector: Significant expansion in residential and commercial construction.
- Favorable Government Policies: Supportive policies promoting energy efficiency and sustainable development.
- Increasing Disposable Incomes: Growing consumer demand for energy-efficient appliances and building materials.
Europe and North America also represent significant markets, exhibiting steady growth, driven by stricter environmental regulations and a focus on sustainable building practices. The refrigeration segment holds the largest market share, followed by the foam insulation segment.
Cyclopentane Industry Product Developments
Recent product innovations focus on high-purity cyclopentane for specialized applications and the development of more efficient and environmentally friendly production processes. These developments aim to enhance product performance, improve cost-effectiveness, and minimize environmental impact. The market is witnessing a shift towards more sustainable and energy-efficient production methods, leveraging technological advancements to achieve this goal. New applications are being explored, particularly in the expanding fields of advanced materials and electronics.
Report Scope & Segmentation Analysis
This report offers a comprehensive segmentation analysis, covering various aspects of the cyclopentane market:
By Product Type: High-purity cyclopentane, technical grade cyclopentane. The high-purity segment is expected to exhibit faster growth due to increasing demand from specialized applications.
By Application: Refrigerants, blowing agents, solvents, and other applications. Refrigerants currently dominate the market, followed by blowing agents.
By Region: Asia-Pacific, North America, Europe, the Middle East & Africa, and South America.
Key Drivers of Cyclopentane Industry Growth
The cyclopentane industry's growth is driven by several factors:
- Increased demand for energy-efficient refrigerants and blowing agents: Driven by stringent environmental regulations and consumer preference for eco-friendly products.
- Growth of the construction industry: Driving demand for insulation materials.
- Technological advancements: Improving production efficiency and lowering costs.
Challenges in the Cyclopentane Industry Sector
The industry faces several challenges:
- Fluctuations in raw material prices: Impacting production costs and profitability.
- Stringent environmental regulations: Requiring significant investments in cleaner technologies.
- Intense competition: Pressuring profit margins. The competitive landscape is intensifying, especially from alternative blowing agents.
Emerging Opportunities in Cyclopentane Industry
Emerging opportunities exist in:
- Developing markets: Expanding into regions with high growth potential.
- New applications: Exploring innovative uses in emerging sectors like advanced materials.
- Sustainable production technologies: Developing and implementing cleaner, more efficient production methods.
Leading Players in the Cyclopentane Industry Market
- Dymatic Chemicals Inc
- Haldia Petrochemicals Limited
- HCS Group GmbH
- INEOS
- Liaoning Yufeng Chemical Co Ltd
- Meilong Cyclopentane Chemical Co Ltd
- Merck KGaA
- PURECHEM CO KR
- SINTECO S R L
- TRECORA RESOURCES
- YEOCHUN NCC CO LTD
Key Developments in Cyclopentane Industry Industry
- 2022 Q4: INEOS announced a significant investment in expanding its cyclopentane production capacity.
- 2023 Q1: Merck KGaA launched a new high-purity cyclopentane product line for specialized applications.
- 2024 Q2: A major M&A deal involving two key players reshaped the market landscape. (Specific details are in the full report).
Strategic Outlook for Cyclopentane Industry Market
The cyclopentane market is poised for continued growth, driven by strong demand from key sectors and ongoing technological advancements. Future opportunities lie in developing sustainable production processes, expanding into new applications, and penetrating emerging markets. The industry's focus on innovation and sustainability will be crucial for maintaining its competitiveness and achieving long-term growth.
Cyclopentane Industry Segmentation
-
1. Function
- 1.1. Blowing Agent & Refrigerant
- 1.2. Solvent & Reagent
- 1.3. Other Functions (Rubber Adhesives, Resins, etc.)
-
2. Application
- 2.1. Refrigeration
- 2.2. Insulation
- 2.3. Chemical Solvent
- 2.4. Other Ap
Cyclopentane Industry Segmentation By Geography
-
1. Asia Pacific
- 1.1. China
- 1.2. India
- 1.3. Japan
- 1.4. South Korea
- 1.5. Rest of Asia Pacific
-
2. North America
- 2.1. United States
- 2.2. Canada
- 2.3. Mexico
-
3. Europe
- 3.1. Germany
- 3.2. United Kingdom
- 3.3. Italy
- 3.4. France
- 3.5. Rest of Europe
-
4. South America
- 4.1. Brazil
- 4.2. Argentina
- 4.3. Rest of South America
-
5. Middle East and Africa
- 5.1. Saudi Arabia
- 5.2. South Africa
- 5.3. Rest of Middle East and Africa
Cyclopentane Industry Regional Market Share
Geographic Coverage of Cyclopentane Industry
Cyclopentane Industry REPORT HIGHLIGHTS
| Aspects | Details |
|---|---|
| Study Period | 2020-2034 |
| Base Year | 2025 |
| Estimated Year | 2026 |
| Forecast Period | 2026-2034 |
| Historical Period | 2020-2025 |
| Growth Rate | CAGR of > 7.50% from 2020-2034 |
| Segmentation |
|
Table of Contents
- 1. Introduction
- 1.1. Research Scope
- 1.2. Market Segmentation
- 1.3. Research Objective
- 1.4. Definitions and Assumptions
- 2. Executive Summary
- 2.1. Market Snapshot
- 3. Market Dynamics
- 3.1. Market Drivers
- 3.2. Market Restrains
- 3.3. Market Trends
- 3.4. Market Opportunities
- 4. Market Factor Analysis
- 4.1. Porters Five Forces
- 4.1.1. Bargaining Power of Suppliers
- 4.1.2. Bargaining Power of Buyers
- 4.1.3. Threat of New Entrants
- 4.1.4. Threat of Substitutes
- 4.1.5. Competitive Rivalry
- 4.2. PESTEL analysis
- 4.3. BCG Analysis
- 4.3.1. Stars (High Growth, High Market Share)
- 4.3.2. Cash Cows (Low Growth, High Market Share)
- 4.3.3. Question Mark (High Growth, Low Market Share)
- 4.3.4. Dogs (Low Growth, Low Market Share)
- 4.4. Ansoff Matrix Analysis
- 4.5. Supply Chain Analysis
- 4.6. Regulatory Landscape
- 4.7. Current Market Potential and Opportunity Assessment (TAM–SAM–SOM Framework)
- 4.8. RAX Analyst Note
- 4.1. Porters Five Forces
- 5. Market Analysis, Insights and Forecast 2021-2033
- 5.1. Market Analysis, Insights and Forecast - by Function
- 5.1.1. Blowing Agent & Refrigerant
- 5.1.2. Solvent & Reagent
- 5.1.3. Other Functions (Rubber Adhesives, Resins, etc.)
- 5.2. Market Analysis, Insights and Forecast - by Application
- 5.2.1. Refrigeration
- 5.2.2. Insulation
- 5.2.3. Chemical Solvent
- 5.2.4. Other Ap
- 5.3. Market Analysis, Insights and Forecast - by Region
- 5.3.1. Asia Pacific
- 5.3.2. North America
- 5.3.3. Europe
- 5.3.4. South America
- 5.3.5. Middle East and Africa
- 5.1. Market Analysis, Insights and Forecast - by Function
- 6. Global Cyclopentane Industry Analysis, Insights and Forecast, 2021-2033
- 6.1. Market Analysis, Insights and Forecast - by Function
- 6.1.1. Blowing Agent & Refrigerant
- 6.1.2. Solvent & Reagent
- 6.1.3. Other Functions (Rubber Adhesives, Resins, etc.)
- 6.2. Market Analysis, Insights and Forecast - by Application
- 6.2.1. Refrigeration
- 6.2.2. Insulation
- 6.2.3. Chemical Solvent
- 6.2.4. Other Ap
- 6.1. Market Analysis, Insights and Forecast - by Function
- 7. Asia Pacific Cyclopentane Industry Analysis, Insights and Forecast, 2020-2032
- 7.1. Market Analysis, Insights and Forecast - by Function
- 7.1.1. Blowing Agent & Refrigerant
- 7.1.2. Solvent & Reagent
- 7.1.3. Other Functions (Rubber Adhesives, Resins, etc.)
- 7.2. Market Analysis, Insights and Forecast - by Application
- 7.2.1. Refrigeration
- 7.2.2. Insulation
- 7.2.3. Chemical Solvent
- 7.2.4. Other Ap
- 7.1. Market Analysis, Insights and Forecast - by Function
- 8. North America Cyclopentane Industry Analysis, Insights and Forecast, 2020-2032
- 8.1. Market Analysis, Insights and Forecast - by Function
- 8.1.1. Blowing Agent & Refrigerant
- 8.1.2. Solvent & Reagent
- 8.1.3. Other Functions (Rubber Adhesives, Resins, etc.)
- 8.2. Market Analysis, Insights and Forecast - by Application
- 8.2.1. Refrigeration
- 8.2.2. Insulation
- 8.2.3. Chemical Solvent
- 8.2.4. Other Ap
- 8.1. Market Analysis, Insights and Forecast - by Function
- 9. Europe Cyclopentane Industry Analysis, Insights and Forecast, 2020-2032
- 9.1. Market Analysis, Insights and Forecast - by Function
- 9.1.1. Blowing Agent & Refrigerant
- 9.1.2. Solvent & Reagent
- 9.1.3. Other Functions (Rubber Adhesives, Resins, etc.)
- 9.2. Market Analysis, Insights and Forecast - by Application
- 9.2.1. Refrigeration
- 9.2.2. Insulation
- 9.2.3. Chemical Solvent
- 9.2.4. Other Ap
- 9.1. Market Analysis, Insights and Forecast - by Function
- 10. South America Cyclopentane Industry Analysis, Insights and Forecast, 2020-2032
- 10.1. Market Analysis, Insights and Forecast - by Function
- 10.1.1. Blowing Agent & Refrigerant
- 10.1.2. Solvent & Reagent
- 10.1.3. Other Functions (Rubber Adhesives, Resins, etc.)
- 10.2. Market Analysis, Insights and Forecast - by Application
- 10.2.1. Refrigeration
- 10.2.2. Insulation
- 10.2.3. Chemical Solvent
- 10.2.4. Other Ap
- 10.1. Market Analysis, Insights and Forecast - by Function
- 11. Middle East and Africa Cyclopentane Industry Analysis, Insights and Forecast, 2020-2032
- 11.1. Market Analysis, Insights and Forecast - by Function
- 11.1.1. Blowing Agent & Refrigerant
- 11.1.2. Solvent & Reagent
- 11.1.3. Other Functions (Rubber Adhesives, Resins, etc.)
- 11.2. Market Analysis, Insights and Forecast - by Application
- 11.2.1. Refrigeration
- 11.2.2. Insulation
- 11.2.3. Chemical Solvent
- 11.2.4. Other Ap
- 11.1. Market Analysis, Insights and Forecast - by Function
- 12. Competitive Analysis
- 12.1. Company Profiles
- 12.1.1 Dymatic Chemicals Inc
- 12.1.1.1. Company Overview
- 12.1.1.2. Products
- 12.1.1.3. Company Financials
- 12.1.1.4. SWOT Analysis
- 12.1.2 Haldia Petrochemicals Limited
- 12.1.2.1. Company Overview
- 12.1.2.2. Products
- 12.1.2.3. Company Financials
- 12.1.2.4. SWOT Analysis
- 12.1.3 HCS Group GmbH
- 12.1.3.1. Company Overview
- 12.1.3.2. Products
- 12.1.3.3. Company Financials
- 12.1.3.4. SWOT Analysis
- 12.1.4 INEOS
- 12.1.4.1. Company Overview
- 12.1.4.2. Products
- 12.1.4.3. Company Financials
- 12.1.4.4. SWOT Analysis
- 12.1.5 Liaoning Yufeng Chemical Co Ltd
- 12.1.5.1. Company Overview
- 12.1.5.2. Products
- 12.1.5.3. Company Financials
- 12.1.5.4. SWOT Analysis
- 12.1.6 Meilong Cyclopentane Chemical Co Ltd
- 12.1.6.1. Company Overview
- 12.1.6.2. Products
- 12.1.6.3. Company Financials
- 12.1.6.4. SWOT Analysis
- 12.1.7 Merck KGaA
- 12.1.7.1. Company Overview
- 12.1.7.2. Products
- 12.1.7.3. Company Financials
- 12.1.7.4. SWOT Analysis
- 12.1.8 PURECHEM CO KR
- 12.1.8.1. Company Overview
- 12.1.8.2. Products
- 12.1.8.3. Company Financials
- 12.1.8.4. SWOT Analysis
- 12.1.9 SINTECO S R L
- 12.1.9.1. Company Overview
- 12.1.9.2. Products
- 12.1.9.3. Company Financials
- 12.1.9.4. SWOT Analysis
- 12.1.10 TRECORA RESOURCES
- 12.1.10.1. Company Overview
- 12.1.10.2. Products
- 12.1.10.3. Company Financials
- 12.1.10.4. SWOT Analysis
- 12.1.11 YEOCHUN NCC CO LTD*List Not Exhaustive
- 12.1.11.1. Company Overview
- 12.1.11.2. Products
- 12.1.11.3. Company Financials
- 12.1.11.4. SWOT Analysis
- 12.1.1 Dymatic Chemicals Inc
- 12.2. Market Entropy
- 12.2.1 Company's Key Areas Served
- 12.2.2 Recent Developments
- 12.3. Company Market Share Analysis 2025
- 12.3.1 Top 5 Companies Market Share Analysis
- 12.3.2 Top 3 Companies Market Share Analysis
- 12.4. List of Potential Customers
- 13. Research Methodology
List of Figures
- Figure 1: Global Cyclopentane Industry Revenue Breakdown (Million, %) by Region 2025 & 2033
- Figure 2: Global Cyclopentane Industry Volume Breakdown (Million, %) by Region 2025 & 2033
- Figure 3: Asia Pacific Cyclopentane Industry Revenue (Million), by Function 2025 & 2033
- Figure 4: Asia Pacific Cyclopentane Industry Volume (Million), by Function 2025 & 2033
- Figure 5: Asia Pacific Cyclopentane Industry Revenue Share (%), by Function 2025 & 2033
- Figure 6: Asia Pacific Cyclopentane Industry Volume Share (%), by Function 2025 & 2033
- Figure 7: Asia Pacific Cyclopentane Industry Revenue (Million), by Application 2025 & 2033
- Figure 8: Asia Pacific Cyclopentane Industry Volume (Million), by Application 2025 & 2033
- Figure 9: Asia Pacific Cyclopentane Industry Revenue Share (%), by Application 2025 & 2033
- Figure 10: Asia Pacific Cyclopentane Industry Volume Share (%), by Application 2025 & 2033
- Figure 11: Asia Pacific Cyclopentane Industry Revenue (Million), by Country 2025 & 2033
- Figure 12: Asia Pacific Cyclopentane Industry Volume (Million), by Country 2025 & 2033
- Figure 13: Asia Pacific Cyclopentane Industry Revenue Share (%), by Country 2025 & 2033
- Figure 14: Asia Pacific Cyclopentane Industry Volume Share (%), by Country 2025 & 2033
- Figure 15: North America Cyclopentane Industry Revenue (Million), by Function 2025 & 2033
- Figure 16: North America Cyclopentane Industry Volume (Million), by Function 2025 & 2033
- Figure 17: North America Cyclopentane Industry Revenue Share (%), by Function 2025 & 2033
- Figure 18: North America Cyclopentane Industry Volume Share (%), by Function 2025 & 2033
- Figure 19: North America Cyclopentane Industry Revenue (Million), by Application 2025 & 2033
- Figure 20: North America Cyclopentane Industry Volume (Million), by Application 2025 & 2033
- Figure 21: North America Cyclopentane Industry Revenue Share (%), by Application 2025 & 2033
- Figure 22: North America Cyclopentane Industry Volume Share (%), by Application 2025 & 2033
- Figure 23: North America Cyclopentane Industry Revenue (Million), by Country 2025 & 2033
- Figure 24: North America Cyclopentane Industry Volume (Million), by Country 2025 & 2033
- Figure 25: North America Cyclopentane Industry Revenue Share (%), by Country 2025 & 2033
- Figure 26: North America Cyclopentane Industry Volume Share (%), by Country 2025 & 2033
- Figure 27: Europe Cyclopentane Industry Revenue (Million), by Function 2025 & 2033
- Figure 28: Europe Cyclopentane Industry Volume (Million), by Function 2025 & 2033
- Figure 29: Europe Cyclopentane Industry Revenue Share (%), by Function 2025 & 2033
- Figure 30: Europe Cyclopentane Industry Volume Share (%), by Function 2025 & 2033
- Figure 31: Europe Cyclopentane Industry Revenue (Million), by Application 2025 & 2033
- Figure 32: Europe Cyclopentane Industry Volume (Million), by Application 2025 & 2033
- Figure 33: Europe Cyclopentane Industry Revenue Share (%), by Application 2025 & 2033
- Figure 34: Europe Cyclopentane Industry Volume Share (%), by Application 2025 & 2033
- Figure 35: Europe Cyclopentane Industry Revenue (Million), by Country 2025 & 2033
- Figure 36: Europe Cyclopentane Industry Volume (Million), by Country 2025 & 2033
- Figure 37: Europe Cyclopentane Industry Revenue Share (%), by Country 2025 & 2033
- Figure 38: Europe Cyclopentane Industry Volume Share (%), by Country 2025 & 2033
- Figure 39: South America Cyclopentane Industry Revenue (Million), by Function 2025 & 2033
- Figure 40: South America Cyclopentane Industry Volume (Million), by Function 2025 & 2033
- Figure 41: South America Cyclopentane Industry Revenue Share (%), by Function 2025 & 2033
- Figure 42: South America Cyclopentane Industry Volume Share (%), by Function 2025 & 2033
- Figure 43: South America Cyclopentane Industry Revenue (Million), by Application 2025 & 2033
- Figure 44: South America Cyclopentane Industry Volume (Million), by Application 2025 & 2033
- Figure 45: South America Cyclopentane Industry Revenue Share (%), by Application 2025 & 2033
- Figure 46: South America Cyclopentane Industry Volume Share (%), by Application 2025 & 2033
- Figure 47: South America Cyclopentane Industry Revenue (Million), by Country 2025 & 2033
- Figure 48: South America Cyclopentane Industry Volume (Million), by Country 2025 & 2033
- Figure 49: South America Cyclopentane Industry Revenue Share (%), by Country 2025 & 2033
- Figure 50: South America Cyclopentane Industry Volume Share (%), by Country 2025 & 2033
- Figure 51: Middle East and Africa Cyclopentane Industry Revenue (Million), by Function 2025 & 2033
- Figure 52: Middle East and Africa Cyclopentane Industry Volume (Million), by Function 2025 & 2033
- Figure 53: Middle East and Africa Cyclopentane Industry Revenue Share (%), by Function 2025 & 2033
- Figure 54: Middle East and Africa Cyclopentane Industry Volume Share (%), by Function 2025 & 2033
- Figure 55: Middle East and Africa Cyclopentane Industry Revenue (Million), by Application 2025 & 2033
- Figure 56: Middle East and Africa Cyclopentane Industry Volume (Million), by Application 2025 & 2033
- Figure 57: Middle East and Africa Cyclopentane Industry Revenue Share (%), by Application 2025 & 2033
- Figure 58: Middle East and Africa Cyclopentane Industry Volume Share (%), by Application 2025 & 2033
- Figure 59: Middle East and Africa Cyclopentane Industry Revenue (Million), by Country 2025 & 2033
- Figure 60: Middle East and Africa Cyclopentane Industry Volume (Million), by Country 2025 & 2033
- Figure 61: Middle East and Africa Cyclopentane Industry Revenue Share (%), by Country 2025 & 2033
- Figure 62: Middle East and Africa Cyclopentane Industry Volume Share (%), by Country 2025 & 2033
List of Tables
- Table 1: Global Cyclopentane Industry Revenue Million Forecast, by Function 2020 & 2033
- Table 2: Global Cyclopentane Industry Volume Million Forecast, by Function 2020 & 2033
- Table 3: Global Cyclopentane Industry Revenue Million Forecast, by Application 2020 & 2033
- Table 4: Global Cyclopentane Industry Volume Million Forecast, by Application 2020 & 2033
- Table 5: Global Cyclopentane Industry Revenue Million Forecast, by Region 2020 & 2033
- Table 6: Global Cyclopentane Industry Volume Million Forecast, by Region 2020 & 2033
- Table 7: Global Cyclopentane Industry Revenue Million Forecast, by Function 2020 & 2033
- Table 8: Global Cyclopentane Industry Volume Million Forecast, by Function 2020 & 2033
- Table 9: Global Cyclopentane Industry Revenue Million Forecast, by Application 2020 & 2033
- Table 10: Global Cyclopentane Industry Volume Million Forecast, by Application 2020 & 2033
- Table 11: Global Cyclopentane Industry Revenue Million Forecast, by Country 2020 & 2033
- Table 12: Global Cyclopentane Industry Volume Million Forecast, by Country 2020 & 2033
- Table 13: China Cyclopentane Industry Revenue (Million) Forecast, by Application 2020 & 2033
- Table 14: China Cyclopentane Industry Volume (Million) Forecast, by Application 2020 & 2033
- Table 15: India Cyclopentane Industry Revenue (Million) Forecast, by Application 2020 & 2033
- Table 16: India Cyclopentane Industry Volume (Million) Forecast, by Application 2020 & 2033
- Table 17: Japan Cyclopentane Industry Revenue (Million) Forecast, by Application 2020 & 2033
- Table 18: Japan Cyclopentane Industry Volume (Million) Forecast, by Application 2020 & 2033
- Table 19: South Korea Cyclopentane Industry Revenue (Million) Forecast, by Application 2020 & 2033
- Table 20: South Korea Cyclopentane Industry Volume (Million) Forecast, by Application 2020 & 2033
- Table 21: Rest of Asia Pacific Cyclopentane Industry Revenue (Million) Forecast, by Application 2020 & 2033
- Table 22: Rest of Asia Pacific Cyclopentane Industry Volume (Million) Forecast, by Application 2020 & 2033
- Table 23: Global Cyclopentane Industry Revenue Million Forecast, by Function 2020 & 2033
- Table 24: Global Cyclopentane Industry Volume Million Forecast, by Function 2020 & 2033
- Table 25: Global Cyclopentane Industry Revenue Million Forecast, by Application 2020 & 2033
- Table 26: Global Cyclopentane Industry Volume Million Forecast, by Application 2020 & 2033
- Table 27: Global Cyclopentane Industry Revenue Million Forecast, by Country 2020 & 2033
- Table 28: Global Cyclopentane Industry Volume Million Forecast, by Country 2020 & 2033
- Table 29: United States Cyclopentane Industry Revenue (Million) Forecast, by Application 2020 & 2033
- Table 30: United States Cyclopentane Industry Volume (Million) Forecast, by Application 2020 & 2033
- Table 31: Canada Cyclopentane Industry Revenue (Million) Forecast, by Application 2020 & 2033
- Table 32: Canada Cyclopentane Industry Volume (Million) Forecast, by Application 2020 & 2033
- Table 33: Mexico Cyclopentane Industry Revenue (Million) Forecast, by Application 2020 & 2033
- Table 34: Mexico Cyclopentane Industry Volume (Million) Forecast, by Application 2020 & 2033
- Table 35: Global Cyclopentane Industry Revenue Million Forecast, by Function 2020 & 2033
- Table 36: Global Cyclopentane Industry Volume Million Forecast, by Function 2020 & 2033
- Table 37: Global Cyclopentane Industry Revenue Million Forecast, by Application 2020 & 2033
- Table 38: Global Cyclopentane Industry Volume Million Forecast, by Application 2020 & 2033
- Table 39: Global Cyclopentane Industry Revenue Million Forecast, by Country 2020 & 2033
- Table 40: Global Cyclopentane Industry Volume Million Forecast, by Country 2020 & 2033
- Table 41: Germany Cyclopentane Industry Revenue (Million) Forecast, by Application 2020 & 2033
- Table 42: Germany Cyclopentane Industry Volume (Million) Forecast, by Application 2020 & 2033
- Table 43: United Kingdom Cyclopentane Industry Revenue (Million) Forecast, by Application 2020 & 2033
- Table 44: United Kingdom Cyclopentane Industry Volume (Million) Forecast, by Application 2020 & 2033
- Table 45: Italy Cyclopentane Industry Revenue (Million) Forecast, by Application 2020 & 2033
- Table 46: Italy Cyclopentane Industry Volume (Million) Forecast, by Application 2020 & 2033
- Table 47: France Cyclopentane Industry Revenue (Million) Forecast, by Application 2020 & 2033
- Table 48: France Cyclopentane Industry Volume (Million) Forecast, by Application 2020 & 2033
- Table 49: Rest of Europe Cyclopentane Industry Revenue (Million) Forecast, by Application 2020 & 2033
- Table 50: Rest of Europe Cyclopentane Industry Volume (Million) Forecast, by Application 2020 & 2033
- Table 51: Global Cyclopentane Industry Revenue Million Forecast, by Function 2020 & 2033
- Table 52: Global Cyclopentane Industry Volume Million Forecast, by Function 2020 & 2033
- Table 53: Global Cyclopentane Industry Revenue Million Forecast, by Application 2020 & 2033
- Table 54: Global Cyclopentane Industry Volume Million Forecast, by Application 2020 & 2033
- Table 55: Global Cyclopentane Industry Revenue Million Forecast, by Country 2020 & 2033
- Table 56: Global Cyclopentane Industry Volume Million Forecast, by Country 2020 & 2033
- Table 57: Brazil Cyclopentane Industry Revenue (Million) Forecast, by Application 2020 & 2033
- Table 58: Brazil Cyclopentane Industry Volume (Million) Forecast, by Application 2020 & 2033
- Table 59: Argentina Cyclopentane Industry Revenue (Million) Forecast, by Application 2020 & 2033
- Table 60: Argentina Cyclopentane Industry Volume (Million) Forecast, by Application 2020 & 2033
- Table 61: Rest of South America Cyclopentane Industry Revenue (Million) Forecast, by Application 2020 & 2033
- Table 62: Rest of South America Cyclopentane Industry Volume (Million) Forecast, by Application 2020 & 2033
- Table 63: Global Cyclopentane Industry Revenue Million Forecast, by Function 2020 & 2033
- Table 64: Global Cyclopentane Industry Volume Million Forecast, by Function 2020 & 2033
- Table 65: Global Cyclopentane Industry Revenue Million Forecast, by Application 2020 & 2033
- Table 66: Global Cyclopentane Industry Volume Million Forecast, by Application 2020 & 2033
- Table 67: Global Cyclopentane Industry Revenue Million Forecast, by Country 2020 & 2033
- Table 68: Global Cyclopentane Industry Volume Million Forecast, by Country 2020 & 2033
- Table 69: Saudi Arabia Cyclopentane Industry Revenue (Million) Forecast, by Application 2020 & 2033
- Table 70: Saudi Arabia Cyclopentane Industry Volume (Million) Forecast, by Application 2020 & 2033
- Table 71: South Africa Cyclopentane Industry Revenue (Million) Forecast, by Application 2020 & 2033
- Table 72: South Africa Cyclopentane Industry Volume (Million) Forecast, by Application 2020 & 2033
- Table 73: Rest of Middle East and Africa Cyclopentane Industry Revenue (Million) Forecast, by Application 2020 & 2033
- Table 74: Rest of Middle East and Africa Cyclopentane Industry Volume (Million) Forecast, by Application 2020 & 2033
Frequently Asked Questions
1. What is the projected Compound Annual Growth Rate (CAGR) of the Cyclopentane Industry?
The projected CAGR is approximately > 7.50%.
2. Which companies are prominent players in the Cyclopentane Industry?
Key companies in the market include Dymatic Chemicals Inc, Haldia Petrochemicals Limited, HCS Group GmbH, INEOS, Liaoning Yufeng Chemical Co Ltd, Meilong Cyclopentane Chemical Co Ltd, Merck KGaA, PURECHEM CO KR, SINTECO S R L, TRECORA RESOURCES, YEOCHUN NCC CO LTD*List Not Exhaustive.
3. What are the main segments of the Cyclopentane Industry?
The market segments include Function, Application.
4. Can you provide details about the market size?
The market size is estimated to be USD 398.89 Million as of 2022.
5. What are some drivers contributing to market growth?
Growing Demand in Blowing Agent Application to Manufacture Polyurethane; Increasing Demand in Refrigeration Application; Other Drivers.
6. What are the notable trends driving market growth?
Refrigeration Application Segment to Dominate the Market.
7. Are there any restraints impacting market growth?
Growing Demand in Blowing Agent Application to Manufacture Polyurethane; Increasing Demand in Refrigeration Application; Other Drivers.
8. Can you provide examples of recent developments in the market?
The recent developments pertaining to the major players in the market are being covered in the complete study.
9. What pricing options are available for accessing the report?
Pricing options include single-user, multi-user, and enterprise licenses priced at USD 4750, USD 5250, and USD 8750 respectively.
10. Is the market size provided in terms of value or volume?
The market size is provided in terms of value, measured in Million and volume, measured in Million.
11. Are there any specific market keywords associated with the report?
Yes, the market keyword associated with the report is "Cyclopentane Industry," which aids in identifying and referencing the specific market segment covered.
12. How do I determine which pricing option suits my needs best?
The pricing options vary based on user requirements and access needs. Individual users may opt for single-user licenses, while businesses requiring broader access may choose multi-user or enterprise licenses for cost-effective access to the report.
13. Are there any additional resources or data provided in the Cyclopentane Industry report?
While the report offers comprehensive insights, it's advisable to review the specific contents or supplementary materials provided to ascertain if additional resources or data are available.
14. How can I stay updated on further developments or reports in the Cyclopentane Industry?
To stay informed about further developments, trends, and reports in the Cyclopentane Industry, consider subscribing to industry newsletters, following relevant companies and organizations, or regularly checking reputable industry news sources and publications.
Methodology
Step 1 - Identification of Relevant Samples Size from Population Database


Step 2 - Approaches for Defining Global Market Size (Value, Volume* & Price*)

Note*: In applicable scenarios
Step 3 - Data Sources
Primary Research
- Web Analytics
- Survey Reports
- Research Institute
- Latest Research Reports
- Opinion Leaders
Secondary Research
- Annual Reports
- White Paper
- Latest Press Release
- Industry Association
- Paid Database
- Investor Presentations

Step 4 - Data Triangulation
Involves using different sources of information in order to increase the validity of a study
These sources are likely to be stakeholders in a program - participants, other researchers, program staff, other community members, and so on.
Then we put all data in single framework & apply various statistical tools to find out the dynamic on the market.
During the analysis stage, feedback from the stakeholder groups would be compared to determine areas of agreement as well as areas of divergence