
Key Insights
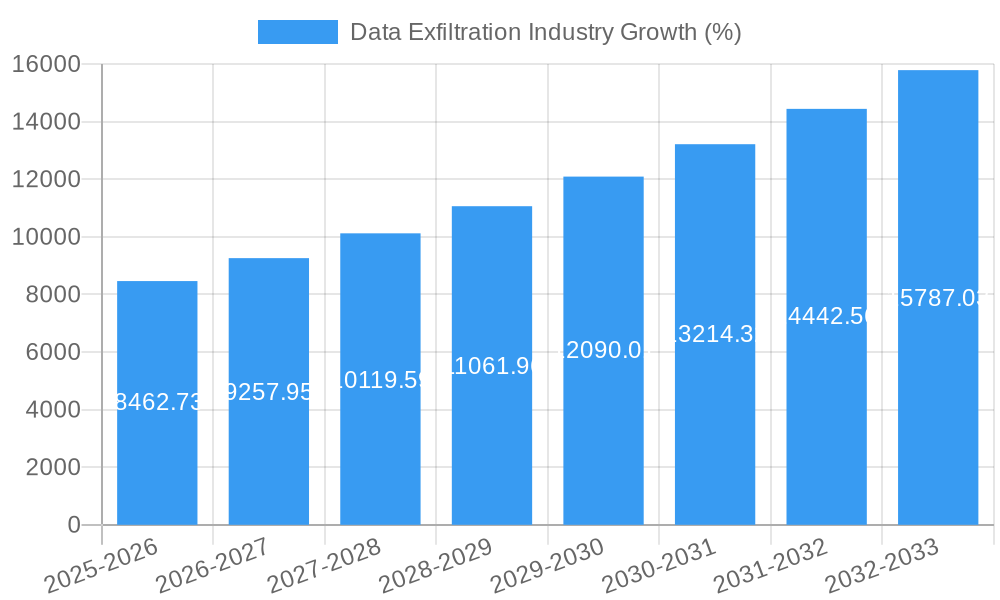
The global data exfiltration prevention market, valued at $87.94 billion in 2025, is projected to experience robust growth, driven by the escalating frequency and sophistication of cyberattacks targeting sensitive data. A compound annual growth rate (CAGR) of 9.38% from 2025 to 2033 indicates a significant market expansion, fueled by several key factors. The increasing adoption of cloud computing and remote work models expands the attack surface, necessitating robust security measures. Furthermore, stringent data privacy regulations like GDPR and CCPA are incentivizing organizations to invest heavily in data protection solutions, significantly boosting market demand. The market is segmented by organization size (SMEs and large enterprises), component (solutions like encryption, antivirus, and firewalls, and services like penetration testing and consulting), and end-user vertical (BFSI, IT & Telecom, Healthcare, etc.). The competitive landscape includes established players like Check Point, Sophos, Cisco, and emerging innovative firms, leading to continuous product development and market innovation. Growth in the Asia-Pacific region, particularly in countries like China and India, is expected to be substantial due to rising digitalization and increasing cybersecurity awareness.
The market's growth trajectory is, however, influenced by certain restraints. High initial investment costs for sophisticated data exfiltration prevention systems can be a barrier for smaller organizations. The complexity of managing and integrating multiple security solutions can also pose a challenge. Furthermore, the evolving nature of cyber threats requires continuous updates and adaptations, adding to the operational costs. Despite these challenges, the overall market outlook remains positive, with a strong emphasis on proactive security measures, advanced threat detection capabilities, and robust incident response strategies. The increasing adoption of artificial intelligence and machine learning in cybersecurity is expected to further drive market growth by enhancing threat detection and prevention capabilities. The market’s segmentation allows for targeted solutions, making it lucrative for various vendors focusing on specific technologies and industries.

Data Exfiltration Industry Market Report: 2019-2033
This comprehensive report provides a detailed analysis of the Data Exfiltration Industry, covering market size, growth projections, key players, and emerging trends from 2019 to 2033. The report utilizes a robust methodology, incorporating historical data (2019-2024), current estimates (2025), and future forecasts (2025-2033) to offer actionable insights for industry stakeholders. With a focus on high-impact keywords like "data exfiltration," "cybersecurity," "data loss prevention," "insider threat," and "network security," this report is designed to enhance search visibility and inform strategic decision-making. The report's value is further amplified by incorporating data from key players such as Check Point Software Technologies, Sophos Group plc, Cisco Systems Inc., Google LLC, and others. The total market value is predicted to reach xx Million by 2033.
Data Exfiltration Industry Market Concentration & Innovation
The Data Exfiltration Industry is characterized by a moderately concentrated market structure, with a few dominant players holding significant market share. However, the landscape is dynamic, with ongoing innovation driving competition and market expansion. Key players like Check Point Software Technologies, Sophos Group plc, and Cisco Systems Inc. hold substantial market share, estimated at xx%, xx%, and xx%, respectively, in 2025. This concentration is partly driven by significant investments in R&D, resulting in advanced solutions and services. However, smaller, specialized firms are also emerging, particularly in niche areas such as insider threat detection and response.
Market innovation is fueled by the constantly evolving threat landscape, necessitating continuous improvements in data loss prevention (DLP) technologies. Advancements in artificial intelligence (AI), machine learning (ML), and behavioral analytics are significantly improving the accuracy and effectiveness of data exfiltration detection systems. Stringent regulatory frameworks, like GDPR and CCPA, are further driving innovation as organizations seek compliance and enhanced data protection. The increasing prevalence of cloud computing and remote work also presents both challenges and opportunities, stimulating the development of cloud-based security solutions and zero-trust architectures.
Mergers and acquisitions (M&A) activities are another significant driver of industry consolidation and innovation. Recent years have witnessed several significant M&A deals, with estimated total deal values exceeding xx Million in the past five years. These activities reflect the strategic importance of data exfiltration prevention and the pursuit of enhanced capabilities through acquisitions. For instance, the acquisition of Company X by Company Y in 2023 significantly expanded Company Y’s capabilities in [Specific area].
Data Exfiltration Industry Industry Trends & Insights
The Data Exfiltration Industry is experiencing robust growth, driven by the escalating number of data breaches and the increasing sophistication of cyberattacks. The market is projected to register a Compound Annual Growth Rate (CAGR) of xx% during the forecast period (2025-2033). This growth is fueled by several key factors: the rising adoption of cloud computing and remote work models, the increasing volume of sensitive data generated and stored by organizations, and growing awareness of the financial and reputational damage associated with data breaches.
Technological disruptions, particularly the advancements in AI and ML, are revolutionizing data exfiltration detection and prevention capabilities. AI-powered solutions can analyze vast amounts of data in real-time, identifying suspicious patterns and anomalies that might indicate a data breach attempt. This has significantly improved the accuracy and speed of threat detection, enabling organizations to respond more effectively to potential attacks. The market penetration of AI-powered solutions is expected to increase from xx% in 2025 to xx% by 2033.
Consumer preferences are shifting towards integrated security solutions that offer comprehensive protection against various cyber threats. Organizations are increasingly seeking solutions that combine multiple security functionalities, such as encryption, antivirus, firewall, intrusion detection, and data loss prevention, into a single platform. This trend is driving the demand for integrated security suites and managed security services. The competitive landscape is marked by intense rivalry among established players and emerging vendors, leading to continuous innovation and price competition. This intense competition benefits consumers, offering access to various advanced security solutions and services at competitive prices.
Dominant Markets & Segments in Data Exfiltration Industry
The North American region currently dominates the global Data Exfiltration Industry market, driven by high technological adoption rates, robust IT infrastructure, and stringent data privacy regulations. However, the Asia-Pacific region is expected to witness the fastest growth during the forecast period due to increasing digitalization, rising internet penetration, and expanding adoption of cloud computing technologies.
By Organization Size: Large enterprises currently hold the largest market share due to their higher budgets for security solutions and their susceptibility to sophisticated cyberattacks. However, SMEs are also experiencing significant growth in data exfiltration prevention investments, driven by increasing regulatory scrutiny and heightened awareness of cyber risks.
By Component: Solutions (particularly data loss prevention and encryption) currently account for a larger market share compared to services. However, the services segment is expected to experience significant growth due to the increasing demand for managed security services, penetration testing, and consulting services.
By End-user Vertical: The Banking, Financial Services, and Insurance (BFSI) sector represents a significant market segment due to its high volume of sensitive customer data and strict regulatory compliance requirements. Other key verticals, such as healthcare and government, are also experiencing substantial growth in data exfiltration prevention investments. The growth in these sectors is driven primarily by stringent regulatory compliance requirements, an increase in data breaches targeting these sectors, and high value of the data that resides within them. The BFSI sector is particularly sensitive due to legal penalties related to data breaches impacting their clients.
Economic policies and infrastructure investment directly impact market growth, particularly in developing economies. For instance, government initiatives promoting digitalization and cybersecurity awareness can significantly accelerate market adoption of data exfiltration prevention solutions. Robust internet infrastructure is also crucial to enable the deployment and effective functioning of cloud-based security solutions.
Data Exfiltration Industry Product Developments
Recent product innovations focus on AI-powered threat detection, advanced encryption techniques, and seamless integration with existing security infrastructure. Solutions are increasingly incorporating behavioral analytics to identify insider threats and anomalies that may indicate data exfiltration attempts. This trend towards proactive threat detection is a key competitive advantage in the market, offering superior protection compared to traditional reactive approaches. The market fit for these advanced solutions is strong given the growing awareness of cyber risks and the need for effective data protection strategies.
Report Scope & Segmentation Analysis
This report segments the Data Exfiltration Industry market by organization size (SMEs and large enterprises), component (solutions and services), and end-user vertical (BFSI, IT and Telecom, Healthcare, Government, Retail, Manufacturing, and Others). Each segment's market size, growth projection, and competitive landscape are analyzed in detail. For example, the SME segment is expected to experience faster growth compared to the large enterprise segment due to increasing cyber awareness and affordable security solutions. In the solutions segment, data loss prevention is poised for significant expansion, driven by stringent regulatory requirements. The BFSI vertical remains a dominant segment, consistently demanding advanced security measures.
Key Drivers of Data Exfiltration Industry Growth
The increasing prevalence of cyberattacks, stringent data privacy regulations (GDPR, CCPA), growing adoption of cloud computing, and the rise of remote work are key drivers of the Data Exfiltration Industry's growth. The expansion of the internet of things (IoT) also contributes, as it expands the attack surface and generates more data vulnerable to exfiltration. These factors necessitate robust security solutions to protect sensitive data and maintain compliance.
Challenges in the Data Exfiltration Industry Sector
The Data Exfiltration Industry faces challenges including the high cost of advanced security solutions, the complexity of integrating various security tools, and the evolving nature of cyber threats requiring constant updates and upgrades. Furthermore, skilled cybersecurity professionals are in high demand, creating a talent shortage that restricts the growth potential of many smaller firms. The cost of compliance and the risk of penalties resulting from a security failure is a significant hurdle for firms of all sizes.
Emerging Opportunities in Data Exfiltration Industry
Emerging opportunities include the development of AI-powered threat intelligence platforms, the integration of blockchain technology for enhanced data security, and the expansion into emerging markets with increasing digitalization. The development of specialized solutions targeting specific industry verticals (like healthcare or finance) also presents significant growth prospects. The increasing adoption of zero-trust security frameworks also opens up new market opportunities for vendors offering compatible solutions.
Leading Players in the Data Exfiltration Industry Market
- Check Point Software Technologies
- Sophos Group plc
- Cisco Systems Inc.
- Google LLC
- GTB Technologies
- McAfee LLC
- Zscaler
- Fortinet
- HP Inc.
- Juniper Networks
- NortonLifeLock
- Palo Alto Networks
- Barracuda Networks
- HackerOne Inc
Key Developments in Data Exfiltration Industry Industry
August 2022: Code42 Software, Inc. partnered with Nullafi to enhance insider risk management and prevent data exfiltration of sensitive data. This collaboration highlights the growing focus on insider threat detection and prevention.
January 2023: EfficientIP launched a free DNS-based data exfiltration application, enabling organizations to conduct ethical hacking exercises to identify network vulnerabilities. This initiative promotes proactive security assessments and highlights the increasing importance of preventative measures.
Strategic Outlook for Data Exfiltration Industry Market
The Data Exfiltration Industry is poised for continued growth, driven by persistent cyber threats, increasing regulatory pressures, and the expanding adoption of digital technologies. Future market potential lies in the development and deployment of advanced AI-powered solutions, integrated security platforms, and specialized services catering to the unique needs of various industry sectors. The focus will continue to shift towards proactive threat detection, prevention, and enhanced user awareness training to minimize the risk of data exfiltration incidents.
Data Exfiltration Industry Segmentation
-
1. Organization Size
- 1.1. Small- and Medium-sized Enterprises (SMEs)
- 1.2. Large Enterprise
-
2. Component
- 2.1. Solution
- 2.2. Services
-
3. End-user Vertical
- 3.1. Banking, Financial Services, and Insurance (BFSI)
- 3.2. IT and Telecom
- 3.3. Healthcare and Life Sciences
- 3.4. Government and Defense
- 3.5. Retail and E-commerce
- 3.6. Manufacturing
- 3.7. Other End-user Verticals
Data Exfiltration Industry Segmentation By Geography
-
1. North America
- 1.1. United States
- 1.2. Canada
-
2. Europe
- 2.1. Germany
- 2.2. United Kingdom
- 2.3. France
- 2.4. Rest of Europe
-
3. Asia Pacific
- 3.1. India
- 3.2. China
- 3.3. Japan
- 3.4. Rest of Asia Pacific
-
4. Latin America
- 4.1. Brazil
- 4.2. Argentina
- 4.3. Rest of Latin America
-
5. Middle East and Africa
- 5.1. United Arab Emirates
- 5.2. Saudi Arabia
- 5.3. Rest of Middle East and Africa

Data Exfiltration Industry REPORT HIGHLIGHTS
| Aspects | Details |
|---|---|
| Study Period | 2019-2033 |
| Base Year | 2024 |
| Estimated Year | 2025 |
| Forecast Period | 2025-2033 |
| Historical Period | 2019-2024 |
| Growth Rate | CAGR of 9.38% from 2019-2033 |
| Segmentation |
|
Table of Contents
- 1. Introduction
- 1.1. Research Scope
- 1.2. Market Segmentation
- 1.3. Research Methodology
- 1.4. Definitions and Assumptions
- 2. Executive Summary
- 2.1. Introduction
- 3. Market Dynamics
- 3.1. Introduction
- 3.2. Market Drivers
- 3.2.1. Exponential Growth in the Volumes of Enterprise Data and the Need for Data Exfiltration Prevention Solutions; Strict Regulatory Requirements for Data Protection; Increasing Incidents of Data Loss in the On-Premises Environment
- 3.3. Market Restrains
- 3.3.1. Compatibility Issues Between On-premises Application and the Cloud Environment
- 3.4. Market Trends
- 3.4.1. Healthcare and Life Sciences End User Segment is Expected to Hold Significant Market Share
- 4. Market Factor Analysis
- 4.1. Porters Five Forces
- 4.2. Supply/Value Chain
- 4.3. PESTEL analysis
- 4.4. Market Entropy
- 4.5. Patent/Trademark Analysis
- 5. Global Data Exfiltration Industry Analysis, Insights and Forecast, 2019-2031
- 5.1. Market Analysis, Insights and Forecast - by Organization Size
- 5.1.1. Small- and Medium-sized Enterprises (SMEs)
- 5.1.2. Large Enterprise
- 5.2. Market Analysis, Insights and Forecast - by Component
- 5.2.1. Solution
- 5.2.2. Services
- 5.3. Market Analysis, Insights and Forecast - by End-user Vertical
- 5.3.1. Banking, Financial Services, and Insurance (BFSI)
- 5.3.2. IT and Telecom
- 5.3.3. Healthcare and Life Sciences
- 5.3.4. Government and Defense
- 5.3.5. Retail and E-commerce
- 5.3.6. Manufacturing
- 5.3.7. Other End-user Verticals
- 5.4. Market Analysis, Insights and Forecast - by Region
- 5.4.1. North America
- 5.4.2. Europe
- 5.4.3. Asia Pacific
- 5.4.4. Latin America
- 5.4.5. Middle East and Africa
- 5.1. Market Analysis, Insights and Forecast - by Organization Size
- 6. North America Data Exfiltration Industry Analysis, Insights and Forecast, 2019-2031
- 6.1. Market Analysis, Insights and Forecast - by Organization Size
- 6.1.1. Small- and Medium-sized Enterprises (SMEs)
- 6.1.2. Large Enterprise
- 6.2. Market Analysis, Insights and Forecast - by Component
- 6.2.1. Solution
- 6.2.2. Services
- 6.3. Market Analysis, Insights and Forecast - by End-user Vertical
- 6.3.1. Banking, Financial Services, and Insurance (BFSI)
- 6.3.2. IT and Telecom
- 6.3.3. Healthcare and Life Sciences
- 6.3.4. Government and Defense
- 6.3.5. Retail and E-commerce
- 6.3.6. Manufacturing
- 6.3.7. Other End-user Verticals
- 6.1. Market Analysis, Insights and Forecast - by Organization Size
- 7. Europe Data Exfiltration Industry Analysis, Insights and Forecast, 2019-2031
- 7.1. Market Analysis, Insights and Forecast - by Organization Size
- 7.1.1. Small- and Medium-sized Enterprises (SMEs)
- 7.1.2. Large Enterprise
- 7.2. Market Analysis, Insights and Forecast - by Component
- 7.2.1. Solution
- 7.2.2. Services
- 7.3. Market Analysis, Insights and Forecast - by End-user Vertical
- 7.3.1. Banking, Financial Services, and Insurance (BFSI)
- 7.3.2. IT and Telecom
- 7.3.3. Healthcare and Life Sciences
- 7.3.4. Government and Defense
- 7.3.5. Retail and E-commerce
- 7.3.6. Manufacturing
- 7.3.7. Other End-user Verticals
- 7.1. Market Analysis, Insights and Forecast - by Organization Size
- 8. Asia Pacific Data Exfiltration Industry Analysis, Insights and Forecast, 2019-2031
- 8.1. Market Analysis, Insights and Forecast - by Organization Size
- 8.1.1. Small- and Medium-sized Enterprises (SMEs)
- 8.1.2. Large Enterprise
- 8.2. Market Analysis, Insights and Forecast - by Component
- 8.2.1. Solution
- 8.2.2. Services
- 8.3. Market Analysis, Insights and Forecast - by End-user Vertical
- 8.3.1. Banking, Financial Services, and Insurance (BFSI)
- 8.3.2. IT and Telecom
- 8.3.3. Healthcare and Life Sciences
- 8.3.4. Government and Defense
- 8.3.5. Retail and E-commerce
- 8.3.6. Manufacturing
- 8.3.7. Other End-user Verticals
- 8.1. Market Analysis, Insights and Forecast - by Organization Size
- 9. Latin America Data Exfiltration Industry Analysis, Insights and Forecast, 2019-2031
- 9.1. Market Analysis, Insights and Forecast - by Organization Size
- 9.1.1. Small- and Medium-sized Enterprises (SMEs)
- 9.1.2. Large Enterprise
- 9.2. Market Analysis, Insights and Forecast - by Component
- 9.2.1. Solution
- 9.2.2. Services
- 9.3. Market Analysis, Insights and Forecast - by End-user Vertical
- 9.3.1. Banking, Financial Services, and Insurance (BFSI)
- 9.3.2. IT and Telecom
- 9.3.3. Healthcare and Life Sciences
- 9.3.4. Government and Defense
- 9.3.5. Retail and E-commerce
- 9.3.6. Manufacturing
- 9.3.7. Other End-user Verticals
- 9.1. Market Analysis, Insights and Forecast - by Organization Size
- 10. Middle East and Africa Data Exfiltration Industry Analysis, Insights and Forecast, 2019-2031
- 10.1. Market Analysis, Insights and Forecast - by Organization Size
- 10.1.1. Small- and Medium-sized Enterprises (SMEs)
- 10.1.2. Large Enterprise
- 10.2. Market Analysis, Insights and Forecast - by Component
- 10.2.1. Solution
- 10.2.2. Services
- 10.3. Market Analysis, Insights and Forecast - by End-user Vertical
- 10.3.1. Banking, Financial Services, and Insurance (BFSI)
- 10.3.2. IT and Telecom
- 10.3.3. Healthcare and Life Sciences
- 10.3.4. Government and Defense
- 10.3.5. Retail and E-commerce
- 10.3.6. Manufacturing
- 10.3.7. Other End-user Verticals
- 10.1. Market Analysis, Insights and Forecast - by Organization Size
- 11. North America Data Exfiltration Industry Analysis, Insights and Forecast, 2019-2031
- 11.1. Market Analysis, Insights and Forecast - By Country/Sub-region
- 11.1.1 United States
- 11.1.2 Canada
- 11.1.3 Mexico
- 12. Europe Data Exfiltration Industry Analysis, Insights and Forecast, 2019-2031
- 12.1. Market Analysis, Insights and Forecast - By Country/Sub-region
- 12.1.1 Germany
- 12.1.2 United Kingdom
- 12.1.3 France
- 12.1.4 Spain
- 12.1.5 Italy
- 12.1.6 Spain
- 12.1.7 Belgium
- 12.1.8 Netherland
- 12.1.9 Nordics
- 12.1.10 Rest of Europe
- 13. Asia Pacific Data Exfiltration Industry Analysis, Insights and Forecast, 2019-2031
- 13.1. Market Analysis, Insights and Forecast - By Country/Sub-region
- 13.1.1 China
- 13.1.2 Japan
- 13.1.3 India
- 13.1.4 South Korea
- 13.1.5 Southeast Asia
- 13.1.6 Australia
- 13.1.7 Indonesia
- 13.1.8 Phillipes
- 13.1.9 Singapore
- 13.1.10 Thailandc
- 13.1.11 Rest of Asia Pacific
- 14. South America Data Exfiltration Industry Analysis, Insights and Forecast, 2019-2031
- 14.1. Market Analysis, Insights and Forecast - By Country/Sub-region
- 14.1.1 Brazil
- 14.1.2 Argentina
- 14.1.3 Peru
- 14.1.4 Chile
- 14.1.5 Colombia
- 14.1.6 Ecuador
- 14.1.7 Venezuela
- 14.1.8 Rest of South America
- 15. North America Data Exfiltration Industry Analysis, Insights and Forecast, 2019-2031
- 15.1. Market Analysis, Insights and Forecast - By Country/Sub-region
- 15.1.1 United States
- 15.1.2 Canada
- 15.1.3 Mexico
- 16. MEA Data Exfiltration Industry Analysis, Insights and Forecast, 2019-2031
- 16.1. Market Analysis, Insights and Forecast - By Country/Sub-region
- 16.1.1 United Arab Emirates
- 16.1.2 Saudi Arabia
- 16.1.3 South Africa
- 16.1.4 Rest of Middle East and Africa
- 17. Competitive Analysis
- 17.1. Global Market Share Analysis 2024
- 17.2. Company Profiles
- 17.2.1 Check Point Software Technologies
- 17.2.1.1. Overview
- 17.2.1.2. Products
- 17.2.1.3. SWOT Analysis
- 17.2.1.4. Recent Developments
- 17.2.1.5. Financials (Based on Availability)
- 17.2.2 Sophos Group plc
- 17.2.2.1. Overview
- 17.2.2.2. Products
- 17.2.2.3. SWOT Analysis
- 17.2.2.4. Recent Developments
- 17.2.2.5. Financials (Based on Availability)
- 17.2.3 Cisco Systems inc
- 17.2.3.1. Overview
- 17.2.3.2. Products
- 17.2.3.3. SWOT Analysis
- 17.2.3.4. Recent Developments
- 17.2.3.5. Financials (Based on Availability)
- 17.2.4 Google LLC
- 17.2.4.1. Overview
- 17.2.4.2. Products
- 17.2.4.3. SWOT Analysis
- 17.2.4.4. Recent Developments
- 17.2.4.5. Financials (Based on Availability)
- 17.2.5 GTB Technologies
- 17.2.5.1. Overview
- 17.2.5.2. Products
- 17.2.5.3. SWOT Analysis
- 17.2.5.4. Recent Developments
- 17.2.5.5. Financials (Based on Availability)
- 17.2.6 McAfee LLC
- 17.2.6.1. Overview
- 17.2.6.2. Products
- 17.2.6.3. SWOT Analysis
- 17.2.6.4. Recent Developments
- 17.2.6.5. Financials (Based on Availability)
- 17.2.7 Zscaler*List Not Exhaustive 7 2 Investment Analysi
- 17.2.7.1. Overview
- 17.2.7.2. Products
- 17.2.7.3. SWOT Analysis
- 17.2.7.4. Recent Developments
- 17.2.7.5. Financials (Based on Availability)
- 17.2.8 Fortinet
- 17.2.8.1. Overview
- 17.2.8.2. Products
- 17.2.8.3. SWOT Analysis
- 17.2.8.4. Recent Developments
- 17.2.8.5. Financials (Based on Availability)
- 17.2.9 HP Inc
- 17.2.9.1. Overview
- 17.2.9.2. Products
- 17.2.9.3. SWOT Analysis
- 17.2.9.4. Recent Developments
- 17.2.9.5. Financials (Based on Availability)
- 17.2.10 Juniper Networks
- 17.2.10.1. Overview
- 17.2.10.2. Products
- 17.2.10.3. SWOT Analysis
- 17.2.10.4. Recent Developments
- 17.2.10.5. Financials (Based on Availability)
- 17.2.11 NortonLifeLock
- 17.2.11.1. Overview
- 17.2.11.2. Products
- 17.2.11.3. SWOT Analysis
- 17.2.11.4. Recent Developments
- 17.2.11.5. Financials (Based on Availability)
- 17.2.12 Palo Alto Networks
- 17.2.12.1. Overview
- 17.2.12.2. Products
- 17.2.12.3. SWOT Analysis
- 17.2.12.4. Recent Developments
- 17.2.12.5. Financials (Based on Availability)
- 17.2.13 Barracuda Networks
- 17.2.13.1. Overview
- 17.2.13.2. Products
- 17.2.13.3. SWOT Analysis
- 17.2.13.4. Recent Developments
- 17.2.13.5. Financials (Based on Availability)
- 17.2.14 Hackerone Inc
- 17.2.14.1. Overview
- 17.2.14.2. Products
- 17.2.14.3. SWOT Analysis
- 17.2.14.4. Recent Developments
- 17.2.14.5. Financials (Based on Availability)
- 17.2.1 Check Point Software Technologies
List of Figures
- Figure 1: Global Data Exfiltration Industry Revenue Breakdown (Million, %) by Region 2024 & 2032
- Figure 2: North America Data Exfiltration Industry Revenue (Million), by Country 2024 & 2032
- Figure 3: North America Data Exfiltration Industry Revenue Share (%), by Country 2024 & 2032
- Figure 4: Europe Data Exfiltration Industry Revenue (Million), by Country 2024 & 2032
- Figure 5: Europe Data Exfiltration Industry Revenue Share (%), by Country 2024 & 2032
- Figure 6: Asia Pacific Data Exfiltration Industry Revenue (Million), by Country 2024 & 2032
- Figure 7: Asia Pacific Data Exfiltration Industry Revenue Share (%), by Country 2024 & 2032
- Figure 8: South America Data Exfiltration Industry Revenue (Million), by Country 2024 & 2032
- Figure 9: South America Data Exfiltration Industry Revenue Share (%), by Country 2024 & 2032
- Figure 10: North America Data Exfiltration Industry Revenue (Million), by Country 2024 & 2032
- Figure 11: North America Data Exfiltration Industry Revenue Share (%), by Country 2024 & 2032
- Figure 12: MEA Data Exfiltration Industry Revenue (Million), by Country 2024 & 2032
- Figure 13: MEA Data Exfiltration Industry Revenue Share (%), by Country 2024 & 2032
- Figure 14: North America Data Exfiltration Industry Revenue (Million), by Organization Size 2024 & 2032
- Figure 15: North America Data Exfiltration Industry Revenue Share (%), by Organization Size 2024 & 2032
- Figure 16: North America Data Exfiltration Industry Revenue (Million), by Component 2024 & 2032
- Figure 17: North America Data Exfiltration Industry Revenue Share (%), by Component 2024 & 2032
- Figure 18: North America Data Exfiltration Industry Revenue (Million), by End-user Vertical 2024 & 2032
- Figure 19: North America Data Exfiltration Industry Revenue Share (%), by End-user Vertical 2024 & 2032
- Figure 20: North America Data Exfiltration Industry Revenue (Million), by Country 2024 & 2032
- Figure 21: North America Data Exfiltration Industry Revenue Share (%), by Country 2024 & 2032
- Figure 22: Europe Data Exfiltration Industry Revenue (Million), by Organization Size 2024 & 2032
- Figure 23: Europe Data Exfiltration Industry Revenue Share (%), by Organization Size 2024 & 2032
- Figure 24: Europe Data Exfiltration Industry Revenue (Million), by Component 2024 & 2032
- Figure 25: Europe Data Exfiltration Industry Revenue Share (%), by Component 2024 & 2032
- Figure 26: Europe Data Exfiltration Industry Revenue (Million), by End-user Vertical 2024 & 2032
- Figure 27: Europe Data Exfiltration Industry Revenue Share (%), by End-user Vertical 2024 & 2032
- Figure 28: Europe Data Exfiltration Industry Revenue (Million), by Country 2024 & 2032
- Figure 29: Europe Data Exfiltration Industry Revenue Share (%), by Country 2024 & 2032
- Figure 30: Asia Pacific Data Exfiltration Industry Revenue (Million), by Organization Size 2024 & 2032
- Figure 31: Asia Pacific Data Exfiltration Industry Revenue Share (%), by Organization Size 2024 & 2032
- Figure 32: Asia Pacific Data Exfiltration Industry Revenue (Million), by Component 2024 & 2032
- Figure 33: Asia Pacific Data Exfiltration Industry Revenue Share (%), by Component 2024 & 2032
- Figure 34: Asia Pacific Data Exfiltration Industry Revenue (Million), by End-user Vertical 2024 & 2032
- Figure 35: Asia Pacific Data Exfiltration Industry Revenue Share (%), by End-user Vertical 2024 & 2032
- Figure 36: Asia Pacific Data Exfiltration Industry Revenue (Million), by Country 2024 & 2032
- Figure 37: Asia Pacific Data Exfiltration Industry Revenue Share (%), by Country 2024 & 2032
- Figure 38: Latin America Data Exfiltration Industry Revenue (Million), by Organization Size 2024 & 2032
- Figure 39: Latin America Data Exfiltration Industry Revenue Share (%), by Organization Size 2024 & 2032
- Figure 40: Latin America Data Exfiltration Industry Revenue (Million), by Component 2024 & 2032
- Figure 41: Latin America Data Exfiltration Industry Revenue Share (%), by Component 2024 & 2032
- Figure 42: Latin America Data Exfiltration Industry Revenue (Million), by End-user Vertical 2024 & 2032
- Figure 43: Latin America Data Exfiltration Industry Revenue Share (%), by End-user Vertical 2024 & 2032
- Figure 44: Latin America Data Exfiltration Industry Revenue (Million), by Country 2024 & 2032
- Figure 45: Latin America Data Exfiltration Industry Revenue Share (%), by Country 2024 & 2032
- Figure 46: Middle East and Africa Data Exfiltration Industry Revenue (Million), by Organization Size 2024 & 2032
- Figure 47: Middle East and Africa Data Exfiltration Industry Revenue Share (%), by Organization Size 2024 & 2032
- Figure 48: Middle East and Africa Data Exfiltration Industry Revenue (Million), by Component 2024 & 2032
- Figure 49: Middle East and Africa Data Exfiltration Industry Revenue Share (%), by Component 2024 & 2032
- Figure 50: Middle East and Africa Data Exfiltration Industry Revenue (Million), by End-user Vertical 2024 & 2032
- Figure 51: Middle East and Africa Data Exfiltration Industry Revenue Share (%), by End-user Vertical 2024 & 2032
- Figure 52: Middle East and Africa Data Exfiltration Industry Revenue (Million), by Country 2024 & 2032
- Figure 53: Middle East and Africa Data Exfiltration Industry Revenue Share (%), by Country 2024 & 2032
List of Tables
- Table 1: Global Data Exfiltration Industry Revenue Million Forecast, by Region 2019 & 2032
- Table 2: Global Data Exfiltration Industry Revenue Million Forecast, by Organization Size 2019 & 2032
- Table 3: Global Data Exfiltration Industry Revenue Million Forecast, by Component 2019 & 2032
- Table 4: Global Data Exfiltration Industry Revenue Million Forecast, by End-user Vertical 2019 & 2032
- Table 5: Global Data Exfiltration Industry Revenue Million Forecast, by Region 2019 & 2032
- Table 6: Global Data Exfiltration Industry Revenue Million Forecast, by Country 2019 & 2032
- Table 7: United States Data Exfiltration Industry Revenue (Million) Forecast, by Application 2019 & 2032
- Table 8: Canada Data Exfiltration Industry Revenue (Million) Forecast, by Application 2019 & 2032
- Table 9: Mexico Data Exfiltration Industry Revenue (Million) Forecast, by Application 2019 & 2032
- Table 10: Global Data Exfiltration Industry Revenue Million Forecast, by Country 2019 & 2032
- Table 11: Germany Data Exfiltration Industry Revenue (Million) Forecast, by Application 2019 & 2032
- Table 12: United Kingdom Data Exfiltration Industry Revenue (Million) Forecast, by Application 2019 & 2032
- Table 13: France Data Exfiltration Industry Revenue (Million) Forecast, by Application 2019 & 2032
- Table 14: Spain Data Exfiltration Industry Revenue (Million) Forecast, by Application 2019 & 2032
- Table 15: Italy Data Exfiltration Industry Revenue (Million) Forecast, by Application 2019 & 2032
- Table 16: Spain Data Exfiltration Industry Revenue (Million) Forecast, by Application 2019 & 2032
- Table 17: Belgium Data Exfiltration Industry Revenue (Million) Forecast, by Application 2019 & 2032
- Table 18: Netherland Data Exfiltration Industry Revenue (Million) Forecast, by Application 2019 & 2032
- Table 19: Nordics Data Exfiltration Industry Revenue (Million) Forecast, by Application 2019 & 2032
- Table 20: Rest of Europe Data Exfiltration Industry Revenue (Million) Forecast, by Application 2019 & 2032
- Table 21: Global Data Exfiltration Industry Revenue Million Forecast, by Country 2019 & 2032
- Table 22: China Data Exfiltration Industry Revenue (Million) Forecast, by Application 2019 & 2032
- Table 23: Japan Data Exfiltration Industry Revenue (Million) Forecast, by Application 2019 & 2032
- Table 24: India Data Exfiltration Industry Revenue (Million) Forecast, by Application 2019 & 2032
- Table 25: South Korea Data Exfiltration Industry Revenue (Million) Forecast, by Application 2019 & 2032
- Table 26: Southeast Asia Data Exfiltration Industry Revenue (Million) Forecast, by Application 2019 & 2032
- Table 27: Australia Data Exfiltration Industry Revenue (Million) Forecast, by Application 2019 & 2032
- Table 28: Indonesia Data Exfiltration Industry Revenue (Million) Forecast, by Application 2019 & 2032
- Table 29: Phillipes Data Exfiltration Industry Revenue (Million) Forecast, by Application 2019 & 2032
- Table 30: Singapore Data Exfiltration Industry Revenue (Million) Forecast, by Application 2019 & 2032
- Table 31: Thailandc Data Exfiltration Industry Revenue (Million) Forecast, by Application 2019 & 2032
- Table 32: Rest of Asia Pacific Data Exfiltration Industry Revenue (Million) Forecast, by Application 2019 & 2032
- Table 33: Global Data Exfiltration Industry Revenue Million Forecast, by Country 2019 & 2032
- Table 34: Brazil Data Exfiltration Industry Revenue (Million) Forecast, by Application 2019 & 2032
- Table 35: Argentina Data Exfiltration Industry Revenue (Million) Forecast, by Application 2019 & 2032
- Table 36: Peru Data Exfiltration Industry Revenue (Million) Forecast, by Application 2019 & 2032
- Table 37: Chile Data Exfiltration Industry Revenue (Million) Forecast, by Application 2019 & 2032
- Table 38: Colombia Data Exfiltration Industry Revenue (Million) Forecast, by Application 2019 & 2032
- Table 39: Ecuador Data Exfiltration Industry Revenue (Million) Forecast, by Application 2019 & 2032
- Table 40: Venezuela Data Exfiltration Industry Revenue (Million) Forecast, by Application 2019 & 2032
- Table 41: Rest of South America Data Exfiltration Industry Revenue (Million) Forecast, by Application 2019 & 2032
- Table 42: Global Data Exfiltration Industry Revenue Million Forecast, by Country 2019 & 2032
- Table 43: United States Data Exfiltration Industry Revenue (Million) Forecast, by Application 2019 & 2032
- Table 44: Canada Data Exfiltration Industry Revenue (Million) Forecast, by Application 2019 & 2032
- Table 45: Mexico Data Exfiltration Industry Revenue (Million) Forecast, by Application 2019 & 2032
- Table 46: Global Data Exfiltration Industry Revenue Million Forecast, by Country 2019 & 2032
- Table 47: United Arab Emirates Data Exfiltration Industry Revenue (Million) Forecast, by Application 2019 & 2032
- Table 48: Saudi Arabia Data Exfiltration Industry Revenue (Million) Forecast, by Application 2019 & 2032
- Table 49: South Africa Data Exfiltration Industry Revenue (Million) Forecast, by Application 2019 & 2032
- Table 50: Rest of Middle East and Africa Data Exfiltration Industry Revenue (Million) Forecast, by Application 2019 & 2032
- Table 51: Global Data Exfiltration Industry Revenue Million Forecast, by Organization Size 2019 & 2032
- Table 52: Global Data Exfiltration Industry Revenue Million Forecast, by Component 2019 & 2032
- Table 53: Global Data Exfiltration Industry Revenue Million Forecast, by End-user Vertical 2019 & 2032
- Table 54: Global Data Exfiltration Industry Revenue Million Forecast, by Country 2019 & 2032
- Table 55: United States Data Exfiltration Industry Revenue (Million) Forecast, by Application 2019 & 2032
- Table 56: Canada Data Exfiltration Industry Revenue (Million) Forecast, by Application 2019 & 2032
- Table 57: Global Data Exfiltration Industry Revenue Million Forecast, by Organization Size 2019 & 2032
- Table 58: Global Data Exfiltration Industry Revenue Million Forecast, by Component 2019 & 2032
- Table 59: Global Data Exfiltration Industry Revenue Million Forecast, by End-user Vertical 2019 & 2032
- Table 60: Global Data Exfiltration Industry Revenue Million Forecast, by Country 2019 & 2032
- Table 61: Germany Data Exfiltration Industry Revenue (Million) Forecast, by Application 2019 & 2032
- Table 62: United Kingdom Data Exfiltration Industry Revenue (Million) Forecast, by Application 2019 & 2032
- Table 63: France Data Exfiltration Industry Revenue (Million) Forecast, by Application 2019 & 2032
- Table 64: Rest of Europe Data Exfiltration Industry Revenue (Million) Forecast, by Application 2019 & 2032
- Table 65: Global Data Exfiltration Industry Revenue Million Forecast, by Organization Size 2019 & 2032
- Table 66: Global Data Exfiltration Industry Revenue Million Forecast, by Component 2019 & 2032
- Table 67: Global Data Exfiltration Industry Revenue Million Forecast, by End-user Vertical 2019 & 2032
- Table 68: Global Data Exfiltration Industry Revenue Million Forecast, by Country 2019 & 2032
- Table 69: India Data Exfiltration Industry Revenue (Million) Forecast, by Application 2019 & 2032
- Table 70: China Data Exfiltration Industry Revenue (Million) Forecast, by Application 2019 & 2032
- Table 71: Japan Data Exfiltration Industry Revenue (Million) Forecast, by Application 2019 & 2032
- Table 72: Rest of Asia Pacific Data Exfiltration Industry Revenue (Million) Forecast, by Application 2019 & 2032
- Table 73: Global Data Exfiltration Industry Revenue Million Forecast, by Organization Size 2019 & 2032
- Table 74: Global Data Exfiltration Industry Revenue Million Forecast, by Component 2019 & 2032
- Table 75: Global Data Exfiltration Industry Revenue Million Forecast, by End-user Vertical 2019 & 2032
- Table 76: Global Data Exfiltration Industry Revenue Million Forecast, by Country 2019 & 2032
- Table 77: Brazil Data Exfiltration Industry Revenue (Million) Forecast, by Application 2019 & 2032
- Table 78: Argentina Data Exfiltration Industry Revenue (Million) Forecast, by Application 2019 & 2032
- Table 79: Rest of Latin America Data Exfiltration Industry Revenue (Million) Forecast, by Application 2019 & 2032
- Table 80: Global Data Exfiltration Industry Revenue Million Forecast, by Organization Size 2019 & 2032
- Table 81: Global Data Exfiltration Industry Revenue Million Forecast, by Component 2019 & 2032
- Table 82: Global Data Exfiltration Industry Revenue Million Forecast, by End-user Vertical 2019 & 2032
- Table 83: Global Data Exfiltration Industry Revenue Million Forecast, by Country 2019 & 2032
- Table 84: United Arab Emirates Data Exfiltration Industry Revenue (Million) Forecast, by Application 2019 & 2032
- Table 85: Saudi Arabia Data Exfiltration Industry Revenue (Million) Forecast, by Application 2019 & 2032
- Table 86: Rest of Middle East and Africa Data Exfiltration Industry Revenue (Million) Forecast, by Application 2019 & 2032
Frequently Asked Questions
1. What is the projected Compound Annual Growth Rate (CAGR) of the Data Exfiltration Industry?
The projected CAGR is approximately 9.38%.
2. Which companies are prominent players in the Data Exfiltration Industry?
Key companies in the market include Check Point Software Technologies, Sophos Group plc, Cisco Systems inc, Google LLC, GTB Technologies, McAfee LLC, Zscaler*List Not Exhaustive 7 2 Investment Analysi, Fortinet, HP Inc, Juniper Networks, NortonLifeLock, Palo Alto Networks, Barracuda Networks, Hackerone Inc.
3. What are the main segments of the Data Exfiltration Industry?
The market segments include Organization Size, Component, End-user Vertical.
4. Can you provide details about the market size?
The market size is estimated to be USD 87.94 Million as of 2022.
5. What are some drivers contributing to market growth?
Exponential Growth in the Volumes of Enterprise Data and the Need for Data Exfiltration Prevention Solutions; Strict Regulatory Requirements for Data Protection; Increasing Incidents of Data Loss in the On-Premises Environment.
6. What are the notable trends driving market growth?
Healthcare and Life Sciences End User Segment is Expected to Hold Significant Market Share.
7. Are there any restraints impacting market growth?
Compatibility Issues Between On-premises Application and the Cloud Environment.
8. Can you provide examples of recent developments in the market?
January 2023: EfficientIP, the DDI security and automation specialist (DNS, DHCP, IPAM), announced the availability of its new DNS-based Data Exfiltration Application to partners and organizations for free. The program is intended to be a hands-on online tool that allows enterprises to conduct their own 'ethical hack' on their DNS system and related security defenses to uncover potential network weaknesses that might lead to a data breach.
9. What pricing options are available for accessing the report?
Pricing options include single-user, multi-user, and enterprise licenses priced at USD 4750, USD 5250, and USD 8750 respectively.
10. Is the market size provided in terms of value or volume?
The market size is provided in terms of value, measured in Million.
11. Are there any specific market keywords associated with the report?
Yes, the market keyword associated with the report is "Data Exfiltration Industry," which aids in identifying and referencing the specific market segment covered.
12. How do I determine which pricing option suits my needs best?
The pricing options vary based on user requirements and access needs. Individual users may opt for single-user licenses, while businesses requiring broader access may choose multi-user or enterprise licenses for cost-effective access to the report.
13. Are there any additional resources or data provided in the Data Exfiltration Industry report?
While the report offers comprehensive insights, it's advisable to review the specific contents or supplementary materials provided to ascertain if additional resources or data are available.
14. How can I stay updated on further developments or reports in the Data Exfiltration Industry?
To stay informed about further developments, trends, and reports in the Data Exfiltration Industry, consider subscribing to industry newsletters, following relevant companies and organizations, or regularly checking reputable industry news sources and publications.
Methodology
Step 1 - Identification of Relevant Samples Size from Population Database


Step 2 - Approaches for Defining Global Market Size (Value, Volume* & Price*)

Note*: In applicable scenarios
Step 3 - Data Sources
Primary Research
- Web Analytics
- Survey Reports
- Research Institute
- Latest Research Reports
- Opinion Leaders
Secondary Research
- Annual Reports
- White Paper
- Latest Press Release
- Industry Association
- Paid Database
- Investor Presentations

Step 4 - Data Triangulation
Involves using different sources of information in order to increase the validity of a study
These sources are likely to be stakeholders in a program - participants, other researchers, program staff, other community members, and so on.
Then we put all data in single framework & apply various statistical tools to find out the dynamic on the market.
During the analysis stage, feedback from the stakeholder groups would be compared to determine areas of agreement as well as areas of divergence


