


Key Insights
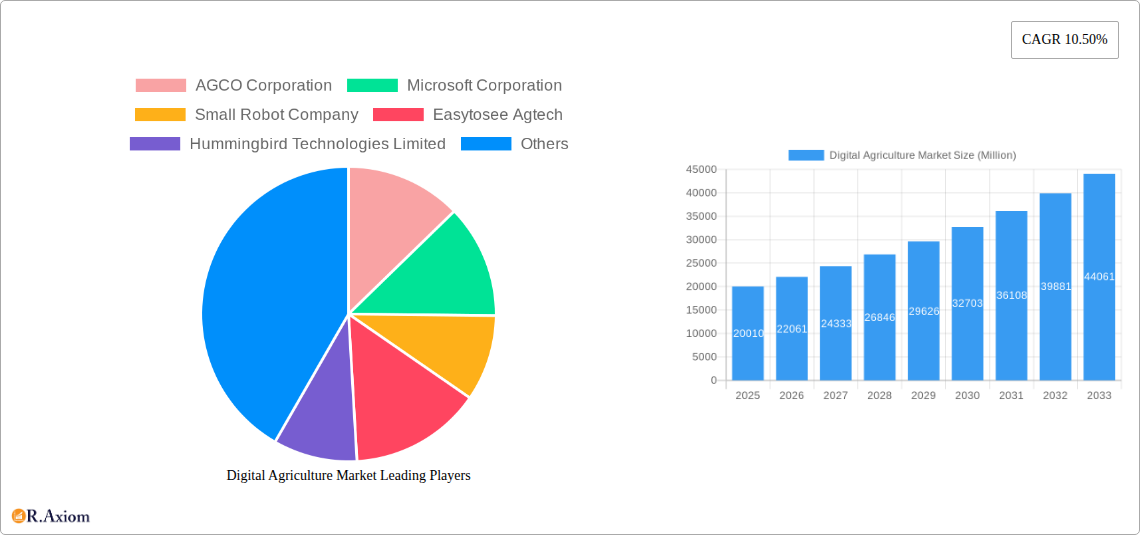
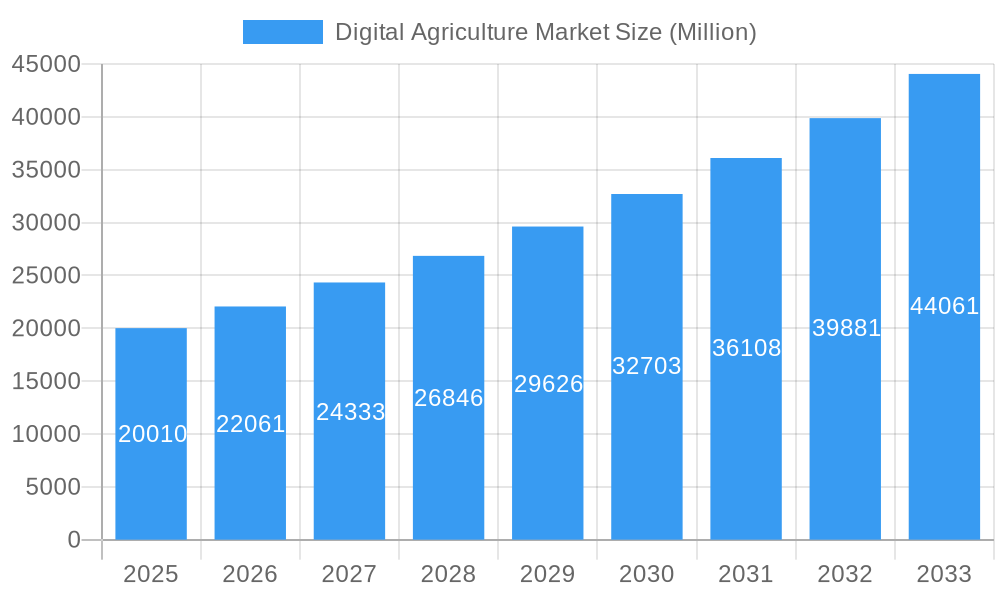
The digital agriculture market is experiencing robust growth, projected to reach \$20.01 million in 2025 and exhibiting a Compound Annual Growth Rate (CAGR) of 10.50% from 2025 to 2033. This expansion is driven by several key factors. Increasing adoption of precision farming techniques, fueled by the need for enhanced crop yields and resource optimization in the face of climate change and growing global population, is a major catalyst. The integration of advanced technologies like Artificial Intelligence (AI), drone analytics, and variable rate technology offers farmers data-driven insights for improved decision-making, leading to optimized resource allocation and reduced operational costs. Furthermore, the increasing availability of high-speed internet and affordable sensor technologies is making digital farming solutions more accessible to a wider range of farmers globally, irrespective of farm size or location. Government initiatives and subsidies promoting the adoption of digital agriculture technologies are also contributing to market expansion. Market segmentation reveals strong growth in areas such as crop monitoring using AI-powered solutions and drone-based analytics for optimizing field management. Key players like AGCO Corporation, Microsoft, and Deere & Company are driving innovation and market penetration through strategic partnerships, acquisitions, and the development of integrated digital agriculture platforms.
Digital Agriculture Market Market Size (In Billion)

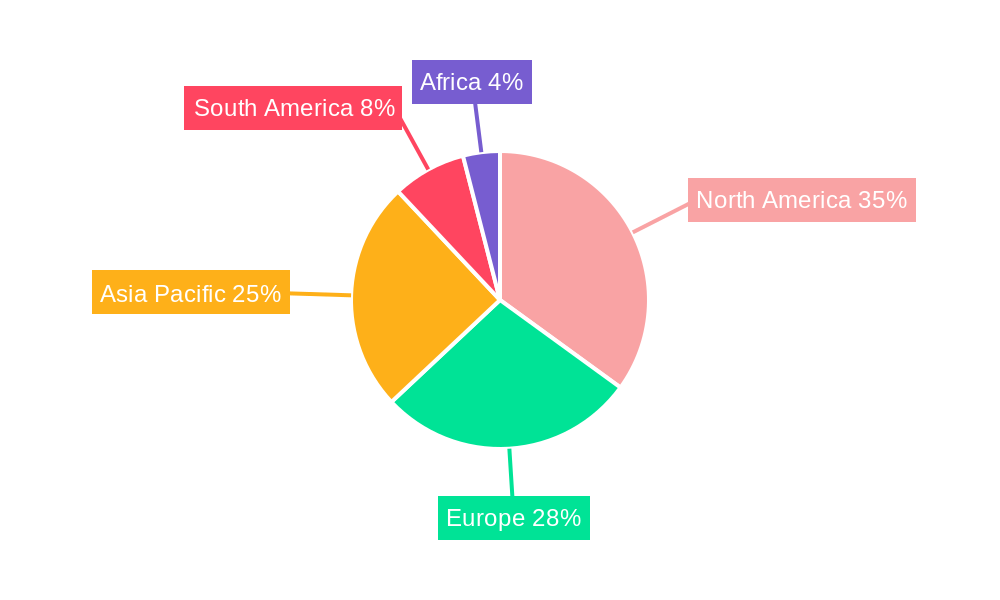
The market's geographical distribution shows significant potential across various regions. North America currently holds a substantial market share due to early adoption and technological advancements. However, the Asia-Pacific region is expected to witness rapid growth in the coming years, driven by rising agricultural activities and increasing government support for technological advancements in agriculture. Europe is also a key market, characterized by a high level of agricultural technology adoption and a strong focus on sustainable farming practices. While challenges remain, such as the need for robust internet infrastructure in some regions and the high initial investment costs associated with digital agriculture technologies, the long-term benefits in terms of increased productivity, efficiency, and sustainability are expected to outweigh these limitations, fostering continued market expansion throughout the forecast period. Competition among established players and new entrants is expected to intensify, leading to further innovation and potentially lower costs for farmers.
Digital Agriculture Market Company Market Share
Digital Agriculture Market: A Comprehensive Report (2019-2033)
This comprehensive report provides an in-depth analysis of the Digital Agriculture Market, offering valuable insights for stakeholders across the agricultural technology landscape. The report covers the period from 2019 to 2033, with a base year of 2025 and a forecast period of 2025-2033. The study utilizes a robust methodology combining extensive primary and secondary research to deliver accurate and actionable data. The market is segmented by key application areas, technologies, and solutions, providing a granular understanding of growth drivers and challenges. The report also profiles leading players, examining their strategies, market share, and competitive dynamics.
Digital Agriculture Market Market Concentration & Innovation
The Digital Agriculture market exhibits a moderately concentrated structure, with a few major players holding significant market share. AGCO Corporation, Deere & Company, and Trimble Inc. are amongst the dominant players, collectively accounting for an estimated xx% of the market in 2025. However, the market is witnessing a surge in innovation driven by the increasing adoption of AI, IoT, and cloud computing. This is attracting both established players and agile startups, fostering a dynamic competitive landscape.
M&A activity has been substantial, with several large acquisitions occurring in recent years, totaling an estimated xx Million in deal value during the historical period (2019-2024). These mergers have predominantly focused on consolidating technology portfolios and expanding geographical reach. Regulatory frameworks, while generally supportive of technological advancement in agriculture, vary across regions, impacting market entry and adoption rates. Product substitutes, such as traditional farming methods, are gradually losing ground as the cost-effectiveness and efficiency of digital solutions become increasingly apparent. End-user trends demonstrate a growing preference for data-driven decision-making, driving demand for sophisticated digital agriculture platforms.
Digital Agriculture Market Industry Trends & Insights
The Digital Agriculture market is experiencing robust growth, projected to achieve a CAGR of xx% during the forecast period (2025-2033). This growth is primarily fueled by several key factors: the increasing adoption of precision farming techniques, rising demand for higher crop yields, and the growing need for efficient resource management. Technological disruptions, such as advancements in AI, machine learning, and drone technology, are significantly impacting market dynamics, enabling the development of more sophisticated and effective agricultural solutions. Consumer preferences are shifting towards sustainable and environmentally friendly farming practices, driving demand for digital tools that optimize resource utilization and minimize environmental impact. Market penetration of digital agriculture solutions is increasing steadily across regions, with significant adoption already observed in North America and Europe, and rapid expansion into developing economies. The competitive landscape is characterized by both intense rivalry amongst established players and the emergence of innovative startups disrupting traditional agricultural practices.
Dominant Markets & Segments in Digital Agriculture Market
Leading Regions/Segments: North America currently holds the largest market share, driven by high technological adoption rates and strong government support. However, Asia-Pacific is expected to exhibit the highest growth rate during the forecast period, propelled by a rapidly expanding agricultural sector and increasing investment in agricultural technology.
- Other Applications: Type: The precision livestock management segment holds a dominant position within this category, driven by the need for efficient livestock monitoring and management.
- Crop Monitoring: Technology: Remote sensing technologies, particularly satellite imagery and drone-based analytics, lead the crop monitoring segment, offering real-time insights into crop health and growth.
- Variable Rate Technology: Solution: Variable rate fertilization solutions are gaining popularity, enhancing efficiency and reducing environmental impact.
- Other Solutions: Application: Farm management software and data analytics platforms are gaining traction due to their comprehensive functionalities.
- Artificial Intelligence: Application: AI-powered solutions for disease and pest detection, and yield prediction are showing significant growth, offering highly efficient solutions.
- Drone Analytics: Deployment: Drone-based solutions are gaining traction across various applications, including crop monitoring, spraying, and mapping.
- Precision Farming: Application: This remains a dominant segment, driving the adoption of several digital solutions including variable rate technology, auto-steering, and yield monitoring systems.
Key Drivers:
- North America: Strong government support for agricultural technology innovation, high adoption rates of advanced technologies, and well-established agricultural infrastructure.
- Asia-Pacific: Rapid expansion of the agricultural sector, increasing investments in agricultural technology, and government initiatives promoting sustainable agriculture.
- Europe: High awareness of precision farming, strong focus on sustainable agriculture, and presence of several leading agricultural technology companies.
Digital Agriculture Market Product Developments
Recent product innovations have focused on integrating AI, IoT, and cloud computing technologies into existing platforms, enhancing data analysis capabilities and decision-making support. The industry is witnessing the launch of integrated solutions that combine diverse functionalities, such as automated machinery, data analytics, and remote sensing, enabling holistic farm management. Competitive advantages are primarily driven by superior data analytics capabilities, user-friendly interfaces, and the ability to integrate seamlessly with existing farm management systems. These advancements cater to the evolving needs of farmers for efficient and sustainable agricultural practices.
Report Scope & Segmentation Analysis
This report provides a comprehensive segmentation of the Digital Agriculture Market by:
- Other Applications: encompassing various non-traditional applications within the agricultural sector. This segment is expected to experience moderate growth driven by the rising demand for automation and data-driven decision-making in diverse areas.
- Crop Monitoring: segmented by technology type, this segment is characterized by rapid innovation, with drone analytics and machine learning leading the advancements. Growth is primarily driven by the increasing need for early disease and pest detection, enabling timely interventions and enhanced crop yields.
- Variable Rate Technology: This segment is segmented by solution type and is experiencing significant growth due to increasing awareness of precision farming techniques. The competitive landscape in this segment is highly dynamic, with both established players and new entrants vying for market share.
- Other Solutions: This broad segment includes farm management software and several other applications that support data-driven decision-making. Growth is fueled by the increasing need for improved farm efficiency and profitability.
- Artificial Intelligence: Rapid growth is anticipated in this segment due to the capabilities of AI in revolutionizing various aspects of agriculture, from crop monitoring to yield prediction.
- Drone Analytics: This segment is experiencing high growth due to the cost-effectiveness, efficiency and versatility offered by drones, resulting in increased market adoption.
- Precision Farming: This segment remains a significant contributor to the overall market growth, encompassing various tools and technologies that improve farming practices through data-driven decision-making.
Key Drivers of Digital Agriculture Market Growth
The growth of the digital agriculture market is driven by several key factors: increasing demand for higher crop yields, the need for efficient resource management, government initiatives promoting sustainable agriculture, technological advancements in AI, IoT and data analytics, and the growing adoption of precision farming techniques. These factors are contributing to a substantial increase in the adoption of digital tools across the agricultural value chain.
Challenges in the Digital Agriculture Market Sector
The digital agriculture market faces challenges including the high initial investment costs associated with adopting new technologies, the need for reliable internet connectivity in rural areas, the lack of digital literacy among farmers in some regions, and the concerns regarding data security and privacy. These challenges need to be addressed to ensure broad adoption of digital solutions within the agricultural sector.
Emerging Opportunities in Digital Agriculture Market
Emerging opportunities include the integration of blockchain technology for supply chain transparency, the development of AI-powered solutions for predictive analysis and automated decision-making, the expansion of digital agriculture solutions into developing economies, and the growing demand for sustainable and environmentally friendly agricultural practices. These opportunities present a significant potential for growth and innovation within the digital agriculture sector.
Leading Players in the Digital Agriculture Market Market
- AGCO Corporation
- Microsoft Corporation
- Small Robot Company
- Easytosee Agtech
- Hummingbird Technologies Limited
- DTN (CLEAR AG SOLUTIONS)
- Conservis Corporation
- Case IH Agriculture (CNH Industrial America LLC )
- Raven Industries
- Deere & Company
- IBM Corporation
- Topcon Positioning Systems
- Trimble Inc
- Gamaya SA
- AgEagle Aerial Systems Inc
- Bayer CropScience AG
Key Developments in Digital Agriculture Market Industry
- January 2023: Deere & Company launched a new precision farming platform integrating AI-powered analytics.
- March 2022: Microsoft partnered with several agricultural companies to expand cloud-based solutions for farm management.
- June 2021: A major merger occurred between two leading agricultural technology companies, resulting in a significant increase in market share for the combined entity. (Specific details redacted for confidentiality).
- (Add further developments with dates as available)
Strategic Outlook for Digital Agriculture Market Market
The future of the Digital Agriculture market is promising, with continued growth driven by technological advancements, increasing demand for sustainable farming practices, and the need for efficient resource management. The market is expected to witness further consolidation through M&A activities, as well as the emergence of new innovative solutions catering to the evolving needs of farmers. This creates significant opportunities for both established players and new entrants to capitalize on the growth potential of this dynamic and rapidly evolving sector.
Digital Agriculture Market Segmentation
- 1. Production Analysis
- 2. Consumption Analysis
- 3. Import Market Analysis (Value & Volume)
- 4. Export Market Analysis (Value & Volume)
- 5. Price Trend Analysis
Digital Agriculture Market Segmentation By Geography
-
1. North America
- 1.1. United States
- 1.2. Canada
- 1.3. Mexico
-
2. South America
- 2.1. Brazil
- 2.2. Argentina
- 2.3. Rest of South America
-
3. Europe
- 3.1. United Kingdom
- 3.2. Germany
- 3.3. France
- 3.4. Italy
- 3.5. Spain
- 3.6. Russia
- 3.7. Benelux
- 3.8. Nordics
- 3.9. Rest of Europe
-
4. Middle East & Africa
- 4.1. Turkey
- 4.2. Israel
- 4.3. GCC
- 4.4. North Africa
- 4.5. South Africa
- 4.6. Rest of Middle East & Africa
-
5. Asia Pacific
- 5.1. China
- 5.2. India
- 5.3. Japan
- 5.4. South Korea
- 5.5. ASEAN
- 5.6. Oceania
- 5.7. Rest of Asia Pacific
Digital Agriculture Market Regional Market Share
Geographic Coverage of Digital Agriculture Market
Digital Agriculture Market REPORT HIGHLIGHTS
| Aspects | Details |
|---|---|
| Study Period | 2020-2034 |
| Base Year | 2025 |
| Estimated Year | 2026 |
| Forecast Period | 2026-2034 |
| Historical Period | 2020-2025 |
| Growth Rate | CAGR of 10.50% from 2020-2034 |
| Segmentation |
|
Table of Contents
- 1. Introduction
- 1.1. Research Scope
- 1.2. Market Segmentation
- 1.3. Research Methodology
- 1.4. Definitions and Assumptions
- 2. Executive Summary
- 2.1. Introduction
- 3. Market Dynamics
- 3.1. Introduction
- 3.2. Market Drivers
- 3.2.1. ; Awareness About Health Benefits Associated With Pecan Consumption; Wide Application of Pecan
- 3.3. Market Restrains
- 3.3.1. ; Volatility in the Prices; Adverse Weather Conditions Affecting Yield
- 3.4. Market Trends
- 3.4.1. Increasing Pressure for Higher Productivity and Improved Crop Health
- 4. Market Factor Analysis
- 4.1. Porters Five Forces
- 4.2. Supply/Value Chain
- 4.3. PESTEL analysis
- 4.4. Market Entropy
- 4.5. Patent/Trademark Analysis
- 5. Global Digital Agriculture Market Analysis, Insights and Forecast, 2020-2032
- 5.1. Market Analysis, Insights and Forecast - by Production Analysis
- 5.2. Market Analysis, Insights and Forecast - by Consumption Analysis
- 5.3. Market Analysis, Insights and Forecast - by Import Market Analysis (Value & Volume)
- 5.4. Market Analysis, Insights and Forecast - by Export Market Analysis (Value & Volume)
- 5.5. Market Analysis, Insights and Forecast - by Price Trend Analysis
- 5.6. Market Analysis, Insights and Forecast - by Region
- 5.6.1. North America
- 5.6.2. South America
- 5.6.3. Europe
- 5.6.4. Middle East & Africa
- 5.6.5. Asia Pacific
- 5.1. Market Analysis, Insights and Forecast - by Production Analysis
- 6. North America Digital Agriculture Market Analysis, Insights and Forecast, 2020-2032
- 6.1. Market Analysis, Insights and Forecast - by Production Analysis
- 6.2. Market Analysis, Insights and Forecast - by Consumption Analysis
- 6.3. Market Analysis, Insights and Forecast - by Import Market Analysis (Value & Volume)
- 6.4. Market Analysis, Insights and Forecast - by Export Market Analysis (Value & Volume)
- 6.5. Market Analysis, Insights and Forecast - by Price Trend Analysis
- 6.1. Market Analysis, Insights and Forecast - by Production Analysis
- 7. South America Digital Agriculture Market Analysis, Insights and Forecast, 2020-2032
- 7.1. Market Analysis, Insights and Forecast - by Production Analysis
- 7.2. Market Analysis, Insights and Forecast - by Consumption Analysis
- 7.3. Market Analysis, Insights and Forecast - by Import Market Analysis (Value & Volume)
- 7.4. Market Analysis, Insights and Forecast - by Export Market Analysis (Value & Volume)
- 7.5. Market Analysis, Insights and Forecast - by Price Trend Analysis
- 7.1. Market Analysis, Insights and Forecast - by Production Analysis
- 8. Europe Digital Agriculture Market Analysis, Insights and Forecast, 2020-2032
- 8.1. Market Analysis, Insights and Forecast - by Production Analysis
- 8.2. Market Analysis, Insights and Forecast - by Consumption Analysis
- 8.3. Market Analysis, Insights and Forecast - by Import Market Analysis (Value & Volume)
- 8.4. Market Analysis, Insights and Forecast - by Export Market Analysis (Value & Volume)
- 8.5. Market Analysis, Insights and Forecast - by Price Trend Analysis
- 8.1. Market Analysis, Insights and Forecast - by Production Analysis
- 9. Middle East & Africa Digital Agriculture Market Analysis, Insights and Forecast, 2020-2032
- 9.1. Market Analysis, Insights and Forecast - by Production Analysis
- 9.2. Market Analysis, Insights and Forecast - by Consumption Analysis
- 9.3. Market Analysis, Insights and Forecast - by Import Market Analysis (Value & Volume)
- 9.4. Market Analysis, Insights and Forecast - by Export Market Analysis (Value & Volume)
- 9.5. Market Analysis, Insights and Forecast - by Price Trend Analysis
- 9.1. Market Analysis, Insights and Forecast - by Production Analysis
- 10. Asia Pacific Digital Agriculture Market Analysis, Insights and Forecast, 2020-2032
- 10.1. Market Analysis, Insights and Forecast - by Production Analysis
- 10.2. Market Analysis, Insights and Forecast - by Consumption Analysis
- 10.3. Market Analysis, Insights and Forecast - by Import Market Analysis (Value & Volume)
- 10.4. Market Analysis, Insights and Forecast - by Export Market Analysis (Value & Volume)
- 10.5. Market Analysis, Insights and Forecast - by Price Trend Analysis
- 10.1. Market Analysis, Insights and Forecast - by Production Analysis
- 11. Competitive Analysis
- 11.1. Global Market Share Analysis 2025
- 11.2. Company Profiles
- 11.2.1 AGCO Corporation
- 11.2.1.1. Overview
- 11.2.1.2. Products
- 11.2.1.3. SWOT Analysis
- 11.2.1.4. Recent Developments
- 11.2.1.5. Financials (Based on Availability)
- 11.2.2 Microsoft Corporation
- 11.2.2.1. Overview
- 11.2.2.2. Products
- 11.2.2.3. SWOT Analysis
- 11.2.2.4. Recent Developments
- 11.2.2.5. Financials (Based on Availability)
- 11.2.3 Small Robot Company
- 11.2.3.1. Overview
- 11.2.3.2. Products
- 11.2.3.3. SWOT Analysis
- 11.2.3.4. Recent Developments
- 11.2.3.5. Financials (Based on Availability)
- 11.2.4 Easytosee Agtech
- 11.2.4.1. Overview
- 11.2.4.2. Products
- 11.2.4.3. SWOT Analysis
- 11.2.4.4. Recent Developments
- 11.2.4.5. Financials (Based on Availability)
- 11.2.5 Hummingbird Technologies Limited
- 11.2.5.1. Overview
- 11.2.5.2. Products
- 11.2.5.3. SWOT Analysis
- 11.2.5.4. Recent Developments
- 11.2.5.5. Financials (Based on Availability)
- 11.2.6 DTN (CLEAR AG SOLUTIONS)
- 11.2.6.1. Overview
- 11.2.6.2. Products
- 11.2.6.3. SWOT Analysis
- 11.2.6.4. Recent Developments
- 11.2.6.5. Financials (Based on Availability)
- 11.2.7 Conservis Corporation
- 11.2.7.1. Overview
- 11.2.7.2. Products
- 11.2.7.3. SWOT Analysis
- 11.2.7.4. Recent Developments
- 11.2.7.5. Financials (Based on Availability)
- 11.2.8 Case IH Agriculture (CNH Industrial America LLC )
- 11.2.8.1. Overview
- 11.2.8.2. Products
- 11.2.8.3. SWOT Analysis
- 11.2.8.4. Recent Developments
- 11.2.8.5. Financials (Based on Availability)
- 11.2.9 Raven Industries
- 11.2.9.1. Overview
- 11.2.9.2. Products
- 11.2.9.3. SWOT Analysis
- 11.2.9.4. Recent Developments
- 11.2.9.5. Financials (Based on Availability)
- 11.2.10 Deere & Company
- 11.2.10.1. Overview
- 11.2.10.2. Products
- 11.2.10.3. SWOT Analysis
- 11.2.10.4. Recent Developments
- 11.2.10.5. Financials (Based on Availability)
- 11.2.11 IBM Corporation
- 11.2.11.1. Overview
- 11.2.11.2. Products
- 11.2.11.3. SWOT Analysis
- 11.2.11.4. Recent Developments
- 11.2.11.5. Financials (Based on Availability)
- 11.2.12 Topcon Positioning Systems
- 11.2.12.1. Overview
- 11.2.12.2. Products
- 11.2.12.3. SWOT Analysis
- 11.2.12.4. Recent Developments
- 11.2.12.5. Financials (Based on Availability)
- 11.2.13 Trimble Inc
- 11.2.13.1. Overview
- 11.2.13.2. Products
- 11.2.13.3. SWOT Analysis
- 11.2.13.4. Recent Developments
- 11.2.13.5. Financials (Based on Availability)
- 11.2.14 Gamaya SA
- 11.2.14.1. Overview
- 11.2.14.2. Products
- 11.2.14.3. SWOT Analysis
- 11.2.14.4. Recent Developments
- 11.2.14.5. Financials (Based on Availability)
- 11.2.15 AgEagle Aerial Systems Inc
- 11.2.15.1. Overview
- 11.2.15.2. Products
- 11.2.15.3. SWOT Analysis
- 11.2.15.4. Recent Developments
- 11.2.15.5. Financials (Based on Availability)
- 11.2.16 Bayer CropScience AG
- 11.2.16.1. Overview
- 11.2.16.2. Products
- 11.2.16.3. SWOT Analysis
- 11.2.16.4. Recent Developments
- 11.2.16.5. Financials (Based on Availability)
- 11.2.1 AGCO Corporation
List of Figures
- Figure 1: Global Digital Agriculture Market Revenue Breakdown (Million, %) by Region 2025 & 2033
- Figure 2: North America Digital Agriculture Market Revenue (Million), by Production Analysis 2025 & 2033
- Figure 3: North America Digital Agriculture Market Revenue Share (%), by Production Analysis 2025 & 2033
- Figure 4: North America Digital Agriculture Market Revenue (Million), by Consumption Analysis 2025 & 2033
- Figure 5: North America Digital Agriculture Market Revenue Share (%), by Consumption Analysis 2025 & 2033
- Figure 6: North America Digital Agriculture Market Revenue (Million), by Import Market Analysis (Value & Volume) 2025 & 2033
- Figure 7: North America Digital Agriculture Market Revenue Share (%), by Import Market Analysis (Value & Volume) 2025 & 2033
- Figure 8: North America Digital Agriculture Market Revenue (Million), by Export Market Analysis (Value & Volume) 2025 & 2033
- Figure 9: North America Digital Agriculture Market Revenue Share (%), by Export Market Analysis (Value & Volume) 2025 & 2033
- Figure 10: North America Digital Agriculture Market Revenue (Million), by Price Trend Analysis 2025 & 2033
- Figure 11: North America Digital Agriculture Market Revenue Share (%), by Price Trend Analysis 2025 & 2033
- Figure 12: North America Digital Agriculture Market Revenue (Million), by Country 2025 & 2033
- Figure 13: North America Digital Agriculture Market Revenue Share (%), by Country 2025 & 2033
- Figure 14: South America Digital Agriculture Market Revenue (Million), by Production Analysis 2025 & 2033
- Figure 15: South America Digital Agriculture Market Revenue Share (%), by Production Analysis 2025 & 2033
- Figure 16: South America Digital Agriculture Market Revenue (Million), by Consumption Analysis 2025 & 2033
- Figure 17: South America Digital Agriculture Market Revenue Share (%), by Consumption Analysis 2025 & 2033
- Figure 18: South America Digital Agriculture Market Revenue (Million), by Import Market Analysis (Value & Volume) 2025 & 2033
- Figure 19: South America Digital Agriculture Market Revenue Share (%), by Import Market Analysis (Value & Volume) 2025 & 2033
- Figure 20: South America Digital Agriculture Market Revenue (Million), by Export Market Analysis (Value & Volume) 2025 & 2033
- Figure 21: South America Digital Agriculture Market Revenue Share (%), by Export Market Analysis (Value & Volume) 2025 & 2033
- Figure 22: South America Digital Agriculture Market Revenue (Million), by Price Trend Analysis 2025 & 2033
- Figure 23: South America Digital Agriculture Market Revenue Share (%), by Price Trend Analysis 2025 & 2033
- Figure 24: South America Digital Agriculture Market Revenue (Million), by Country 2025 & 2033
- Figure 25: South America Digital Agriculture Market Revenue Share (%), by Country 2025 & 2033
- Figure 26: Europe Digital Agriculture Market Revenue (Million), by Production Analysis 2025 & 2033
- Figure 27: Europe Digital Agriculture Market Revenue Share (%), by Production Analysis 2025 & 2033
- Figure 28: Europe Digital Agriculture Market Revenue (Million), by Consumption Analysis 2025 & 2033
- Figure 29: Europe Digital Agriculture Market Revenue Share (%), by Consumption Analysis 2025 & 2033
- Figure 30: Europe Digital Agriculture Market Revenue (Million), by Import Market Analysis (Value & Volume) 2025 & 2033
- Figure 31: Europe Digital Agriculture Market Revenue Share (%), by Import Market Analysis (Value & Volume) 2025 & 2033
- Figure 32: Europe Digital Agriculture Market Revenue (Million), by Export Market Analysis (Value & Volume) 2025 & 2033
- Figure 33: Europe Digital Agriculture Market Revenue Share (%), by Export Market Analysis (Value & Volume) 2025 & 2033
- Figure 34: Europe Digital Agriculture Market Revenue (Million), by Price Trend Analysis 2025 & 2033
- Figure 35: Europe Digital Agriculture Market Revenue Share (%), by Price Trend Analysis 2025 & 2033
- Figure 36: Europe Digital Agriculture Market Revenue (Million), by Country 2025 & 2033
- Figure 37: Europe Digital Agriculture Market Revenue Share (%), by Country 2025 & 2033
- Figure 38: Middle East & Africa Digital Agriculture Market Revenue (Million), by Production Analysis 2025 & 2033
- Figure 39: Middle East & Africa Digital Agriculture Market Revenue Share (%), by Production Analysis 2025 & 2033
- Figure 40: Middle East & Africa Digital Agriculture Market Revenue (Million), by Consumption Analysis 2025 & 2033
- Figure 41: Middle East & Africa Digital Agriculture Market Revenue Share (%), by Consumption Analysis 2025 & 2033
- Figure 42: Middle East & Africa Digital Agriculture Market Revenue (Million), by Import Market Analysis (Value & Volume) 2025 & 2033
- Figure 43: Middle East & Africa Digital Agriculture Market Revenue Share (%), by Import Market Analysis (Value & Volume) 2025 & 2033
- Figure 44: Middle East & Africa Digital Agriculture Market Revenue (Million), by Export Market Analysis (Value & Volume) 2025 & 2033
- Figure 45: Middle East & Africa Digital Agriculture Market Revenue Share (%), by Export Market Analysis (Value & Volume) 2025 & 2033
- Figure 46: Middle East & Africa Digital Agriculture Market Revenue (Million), by Price Trend Analysis 2025 & 2033
- Figure 47: Middle East & Africa Digital Agriculture Market Revenue Share (%), by Price Trend Analysis 2025 & 2033
- Figure 48: Middle East & Africa Digital Agriculture Market Revenue (Million), by Country 2025 & 2033
- Figure 49: Middle East & Africa Digital Agriculture Market Revenue Share (%), by Country 2025 & 2033
- Figure 50: Asia Pacific Digital Agriculture Market Revenue (Million), by Production Analysis 2025 & 2033
- Figure 51: Asia Pacific Digital Agriculture Market Revenue Share (%), by Production Analysis 2025 & 2033
- Figure 52: Asia Pacific Digital Agriculture Market Revenue (Million), by Consumption Analysis 2025 & 2033
- Figure 53: Asia Pacific Digital Agriculture Market Revenue Share (%), by Consumption Analysis 2025 & 2033
- Figure 54: Asia Pacific Digital Agriculture Market Revenue (Million), by Import Market Analysis (Value & Volume) 2025 & 2033
- Figure 55: Asia Pacific Digital Agriculture Market Revenue Share (%), by Import Market Analysis (Value & Volume) 2025 & 2033
- Figure 56: Asia Pacific Digital Agriculture Market Revenue (Million), by Export Market Analysis (Value & Volume) 2025 & 2033
- Figure 57: Asia Pacific Digital Agriculture Market Revenue Share (%), by Export Market Analysis (Value & Volume) 2025 & 2033
- Figure 58: Asia Pacific Digital Agriculture Market Revenue (Million), by Price Trend Analysis 2025 & 2033
- Figure 59: Asia Pacific Digital Agriculture Market Revenue Share (%), by Price Trend Analysis 2025 & 2033
- Figure 60: Asia Pacific Digital Agriculture Market Revenue (Million), by Country 2025 & 2033
- Figure 61: Asia Pacific Digital Agriculture Market Revenue Share (%), by Country 2025 & 2033
List of Tables
- Table 1: Global Digital Agriculture Market Revenue Million Forecast, by Production Analysis 2020 & 2033
- Table 2: Global Digital Agriculture Market Revenue Million Forecast, by Consumption Analysis 2020 & 2033
- Table 3: Global Digital Agriculture Market Revenue Million Forecast, by Import Market Analysis (Value & Volume) 2020 & 2033
- Table 4: Global Digital Agriculture Market Revenue Million Forecast, by Export Market Analysis (Value & Volume) 2020 & 2033
- Table 5: Global Digital Agriculture Market Revenue Million Forecast, by Price Trend Analysis 2020 & 2033
- Table 6: Global Digital Agriculture Market Revenue Million Forecast, by Region 2020 & 2033
- Table 7: Global Digital Agriculture Market Revenue Million Forecast, by Production Analysis 2020 & 2033
- Table 8: Global Digital Agriculture Market Revenue Million Forecast, by Consumption Analysis 2020 & 2033
- Table 9: Global Digital Agriculture Market Revenue Million Forecast, by Import Market Analysis (Value & Volume) 2020 & 2033
- Table 10: Global Digital Agriculture Market Revenue Million Forecast, by Export Market Analysis (Value & Volume) 2020 & 2033
- Table 11: Global Digital Agriculture Market Revenue Million Forecast, by Price Trend Analysis 2020 & 2033
- Table 12: Global Digital Agriculture Market Revenue Million Forecast, by Country 2020 & 2033
- Table 13: United States Digital Agriculture Market Revenue (Million) Forecast, by Application 2020 & 2033
- Table 14: Canada Digital Agriculture Market Revenue (Million) Forecast, by Application 2020 & 2033
- Table 15: Mexico Digital Agriculture Market Revenue (Million) Forecast, by Application 2020 & 2033
- Table 16: Global Digital Agriculture Market Revenue Million Forecast, by Production Analysis 2020 & 2033
- Table 17: Global Digital Agriculture Market Revenue Million Forecast, by Consumption Analysis 2020 & 2033
- Table 18: Global Digital Agriculture Market Revenue Million Forecast, by Import Market Analysis (Value & Volume) 2020 & 2033
- Table 19: Global Digital Agriculture Market Revenue Million Forecast, by Export Market Analysis (Value & Volume) 2020 & 2033
- Table 20: Global Digital Agriculture Market Revenue Million Forecast, by Price Trend Analysis 2020 & 2033
- Table 21: Global Digital Agriculture Market Revenue Million Forecast, by Country 2020 & 2033
- Table 22: Brazil Digital Agriculture Market Revenue (Million) Forecast, by Application 2020 & 2033
- Table 23: Argentina Digital Agriculture Market Revenue (Million) Forecast, by Application 2020 & 2033
- Table 24: Rest of South America Digital Agriculture Market Revenue (Million) Forecast, by Application 2020 & 2033
- Table 25: Global Digital Agriculture Market Revenue Million Forecast, by Production Analysis 2020 & 2033
- Table 26: Global Digital Agriculture Market Revenue Million Forecast, by Consumption Analysis 2020 & 2033
- Table 27: Global Digital Agriculture Market Revenue Million Forecast, by Import Market Analysis (Value & Volume) 2020 & 2033
- Table 28: Global Digital Agriculture Market Revenue Million Forecast, by Export Market Analysis (Value & Volume) 2020 & 2033
- Table 29: Global Digital Agriculture Market Revenue Million Forecast, by Price Trend Analysis 2020 & 2033
- Table 30: Global Digital Agriculture Market Revenue Million Forecast, by Country 2020 & 2033
- Table 31: United Kingdom Digital Agriculture Market Revenue (Million) Forecast, by Application 2020 & 2033
- Table 32: Germany Digital Agriculture Market Revenue (Million) Forecast, by Application 2020 & 2033
- Table 33: France Digital Agriculture Market Revenue (Million) Forecast, by Application 2020 & 2033
- Table 34: Italy Digital Agriculture Market Revenue (Million) Forecast, by Application 2020 & 2033
- Table 35: Spain Digital Agriculture Market Revenue (Million) Forecast, by Application 2020 & 2033
- Table 36: Russia Digital Agriculture Market Revenue (Million) Forecast, by Application 2020 & 2033
- Table 37: Benelux Digital Agriculture Market Revenue (Million) Forecast, by Application 2020 & 2033
- Table 38: Nordics Digital Agriculture Market Revenue (Million) Forecast, by Application 2020 & 2033
- Table 39: Rest of Europe Digital Agriculture Market Revenue (Million) Forecast, by Application 2020 & 2033
- Table 40: Global Digital Agriculture Market Revenue Million Forecast, by Production Analysis 2020 & 2033
- Table 41: Global Digital Agriculture Market Revenue Million Forecast, by Consumption Analysis 2020 & 2033
- Table 42: Global Digital Agriculture Market Revenue Million Forecast, by Import Market Analysis (Value & Volume) 2020 & 2033
- Table 43: Global Digital Agriculture Market Revenue Million Forecast, by Export Market Analysis (Value & Volume) 2020 & 2033
- Table 44: Global Digital Agriculture Market Revenue Million Forecast, by Price Trend Analysis 2020 & 2033
- Table 45: Global Digital Agriculture Market Revenue Million Forecast, by Country 2020 & 2033
- Table 46: Turkey Digital Agriculture Market Revenue (Million) Forecast, by Application 2020 & 2033
- Table 47: Israel Digital Agriculture Market Revenue (Million) Forecast, by Application 2020 & 2033
- Table 48: GCC Digital Agriculture Market Revenue (Million) Forecast, by Application 2020 & 2033
- Table 49: North Africa Digital Agriculture Market Revenue (Million) Forecast, by Application 2020 & 2033
- Table 50: South Africa Digital Agriculture Market Revenue (Million) Forecast, by Application 2020 & 2033
- Table 51: Rest of Middle East & Africa Digital Agriculture Market Revenue (Million) Forecast, by Application 2020 & 2033
- Table 52: Global Digital Agriculture Market Revenue Million Forecast, by Production Analysis 2020 & 2033
- Table 53: Global Digital Agriculture Market Revenue Million Forecast, by Consumption Analysis 2020 & 2033
- Table 54: Global Digital Agriculture Market Revenue Million Forecast, by Import Market Analysis (Value & Volume) 2020 & 2033
- Table 55: Global Digital Agriculture Market Revenue Million Forecast, by Export Market Analysis (Value & Volume) 2020 & 2033
- Table 56: Global Digital Agriculture Market Revenue Million Forecast, by Price Trend Analysis 2020 & 2033
- Table 57: Global Digital Agriculture Market Revenue Million Forecast, by Country 2020 & 2033
- Table 58: China Digital Agriculture Market Revenue (Million) Forecast, by Application 2020 & 2033
- Table 59: India Digital Agriculture Market Revenue (Million) Forecast, by Application 2020 & 2033
- Table 60: Japan Digital Agriculture Market Revenue (Million) Forecast, by Application 2020 & 2033
- Table 61: South Korea Digital Agriculture Market Revenue (Million) Forecast, by Application 2020 & 2033
- Table 62: ASEAN Digital Agriculture Market Revenue (Million) Forecast, by Application 2020 & 2033
- Table 63: Oceania Digital Agriculture Market Revenue (Million) Forecast, by Application 2020 & 2033
- Table 64: Rest of Asia Pacific Digital Agriculture Market Revenue (Million) Forecast, by Application 2020 & 2033
Frequently Asked Questions
1. What is the projected Compound Annual Growth Rate (CAGR) of the Digital Agriculture Market?
The projected CAGR is approximately 10.50%.
2. Which companies are prominent players in the Digital Agriculture Market?
Key companies in the market include AGCO Corporation, Microsoft Corporation, Small Robot Company, Easytosee Agtech, Hummingbird Technologies Limited, DTN (CLEAR AG SOLUTIONS), Conservis Corporation, Case IH Agriculture (CNH Industrial America LLC ), Raven Industries, Deere & Company, IBM Corporation, Topcon Positioning Systems, Trimble Inc, Gamaya SA, AgEagle Aerial Systems Inc, Bayer CropScience AG.
3. What are the main segments of the Digital Agriculture Market?
The market segments include Production Analysis, Consumption Analysis, Import Market Analysis (Value & Volume), Export Market Analysis (Value & Volume), Price Trend Analysis.
4. Can you provide details about the market size?
The market size is estimated to be USD 20.01 Million as of 2022.
5. What are some drivers contributing to market growth?
; Awareness About Health Benefits Associated With Pecan Consumption; Wide Application of Pecan.
6. What are the notable trends driving market growth?
Increasing Pressure for Higher Productivity and Improved Crop Health.
7. Are there any restraints impacting market growth?
; Volatility in the Prices; Adverse Weather Conditions Affecting Yield.
8. Can you provide examples of recent developments in the market?
N/A
9. What pricing options are available for accessing the report?
Pricing options include single-user, multi-user, and enterprise licenses priced at USD 4750, USD 5250, and USD 8750 respectively.
10. Is the market size provided in terms of value or volume?
The market size is provided in terms of value, measured in Million.
11. Are there any specific market keywords associated with the report?
Yes, the market keyword associated with the report is "Digital Agriculture Market," which aids in identifying and referencing the specific market segment covered.
12. How do I determine which pricing option suits my needs best?
The pricing options vary based on user requirements and access needs. Individual users may opt for single-user licenses, while businesses requiring broader access may choose multi-user or enterprise licenses for cost-effective access to the report.
13. Are there any additional resources or data provided in the Digital Agriculture Market report?
While the report offers comprehensive insights, it's advisable to review the specific contents or supplementary materials provided to ascertain if additional resources or data are available.
14. How can I stay updated on further developments or reports in the Digital Agriculture Market?
To stay informed about further developments, trends, and reports in the Digital Agriculture Market, consider subscribing to industry newsletters, following relevant companies and organizations, or regularly checking reputable industry news sources and publications.
Methodology
Step 1 - Identification of Relevant Samples Size from Population Database


Step 2 - Approaches for Defining Global Market Size (Value, Volume* & Price*)

Note*: In applicable scenarios
Step 3 - Data Sources
Primary Research
- Web Analytics
- Survey Reports
- Research Institute
- Latest Research Reports
- Opinion Leaders
Secondary Research
- Annual Reports
- White Paper
- Latest Press Release
- Industry Association
- Paid Database
- Investor Presentations

Step 4 - Data Triangulation
Involves using different sources of information in order to increase the validity of a study
These sources are likely to be stakeholders in a program - participants, other researchers, program staff, other community members, and so on.
Then we put all data in single framework & apply various statistical tools to find out the dynamic on the market.
During the analysis stage, feedback from the stakeholder groups would be compared to determine areas of agreement as well as areas of divergence