

Key Insights
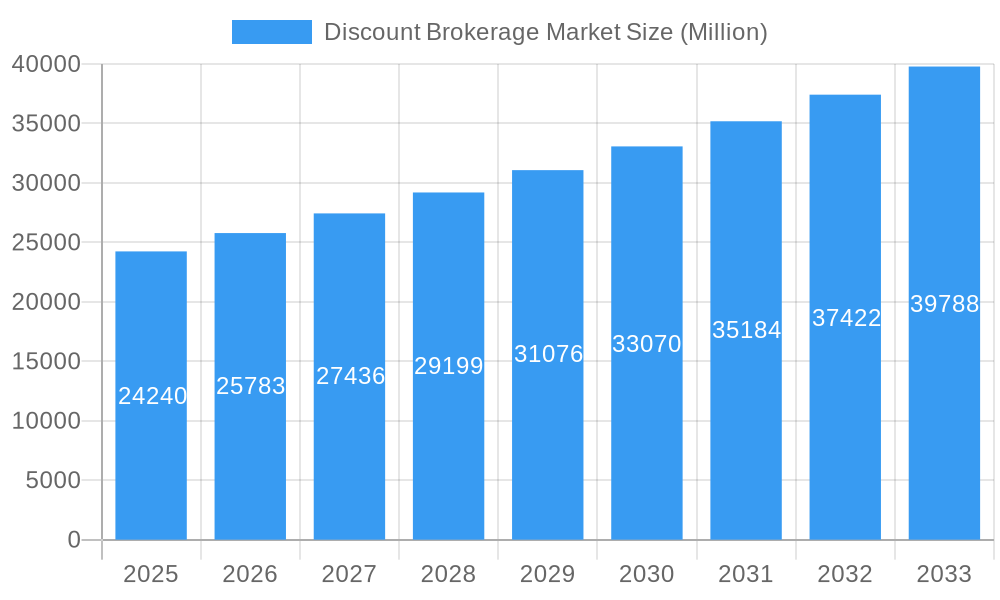
The discount brokerage market, valued at $24.24 billion in 2025, is projected to experience robust growth, driven by several key factors. Increased accessibility of online trading platforms, coupled with the rising popularity of mobile investing apps, has significantly lowered the barrier to entry for retail investors. This democratization of investing is attracting a younger demographic and fueling market expansion. Furthermore, the ongoing trend of zero-commission trading, initially popularized by disruptors like Robinhood, has intensified competition, forcing established players to adapt and offer increasingly competitive pricing and services. This competitive landscape benefits consumers, who enjoy broader access to sophisticated trading tools and resources at lower costs. Technological advancements, such as artificial intelligence-driven investment advice and robo-advisors, are further streamlining the investment process and broadening market appeal.
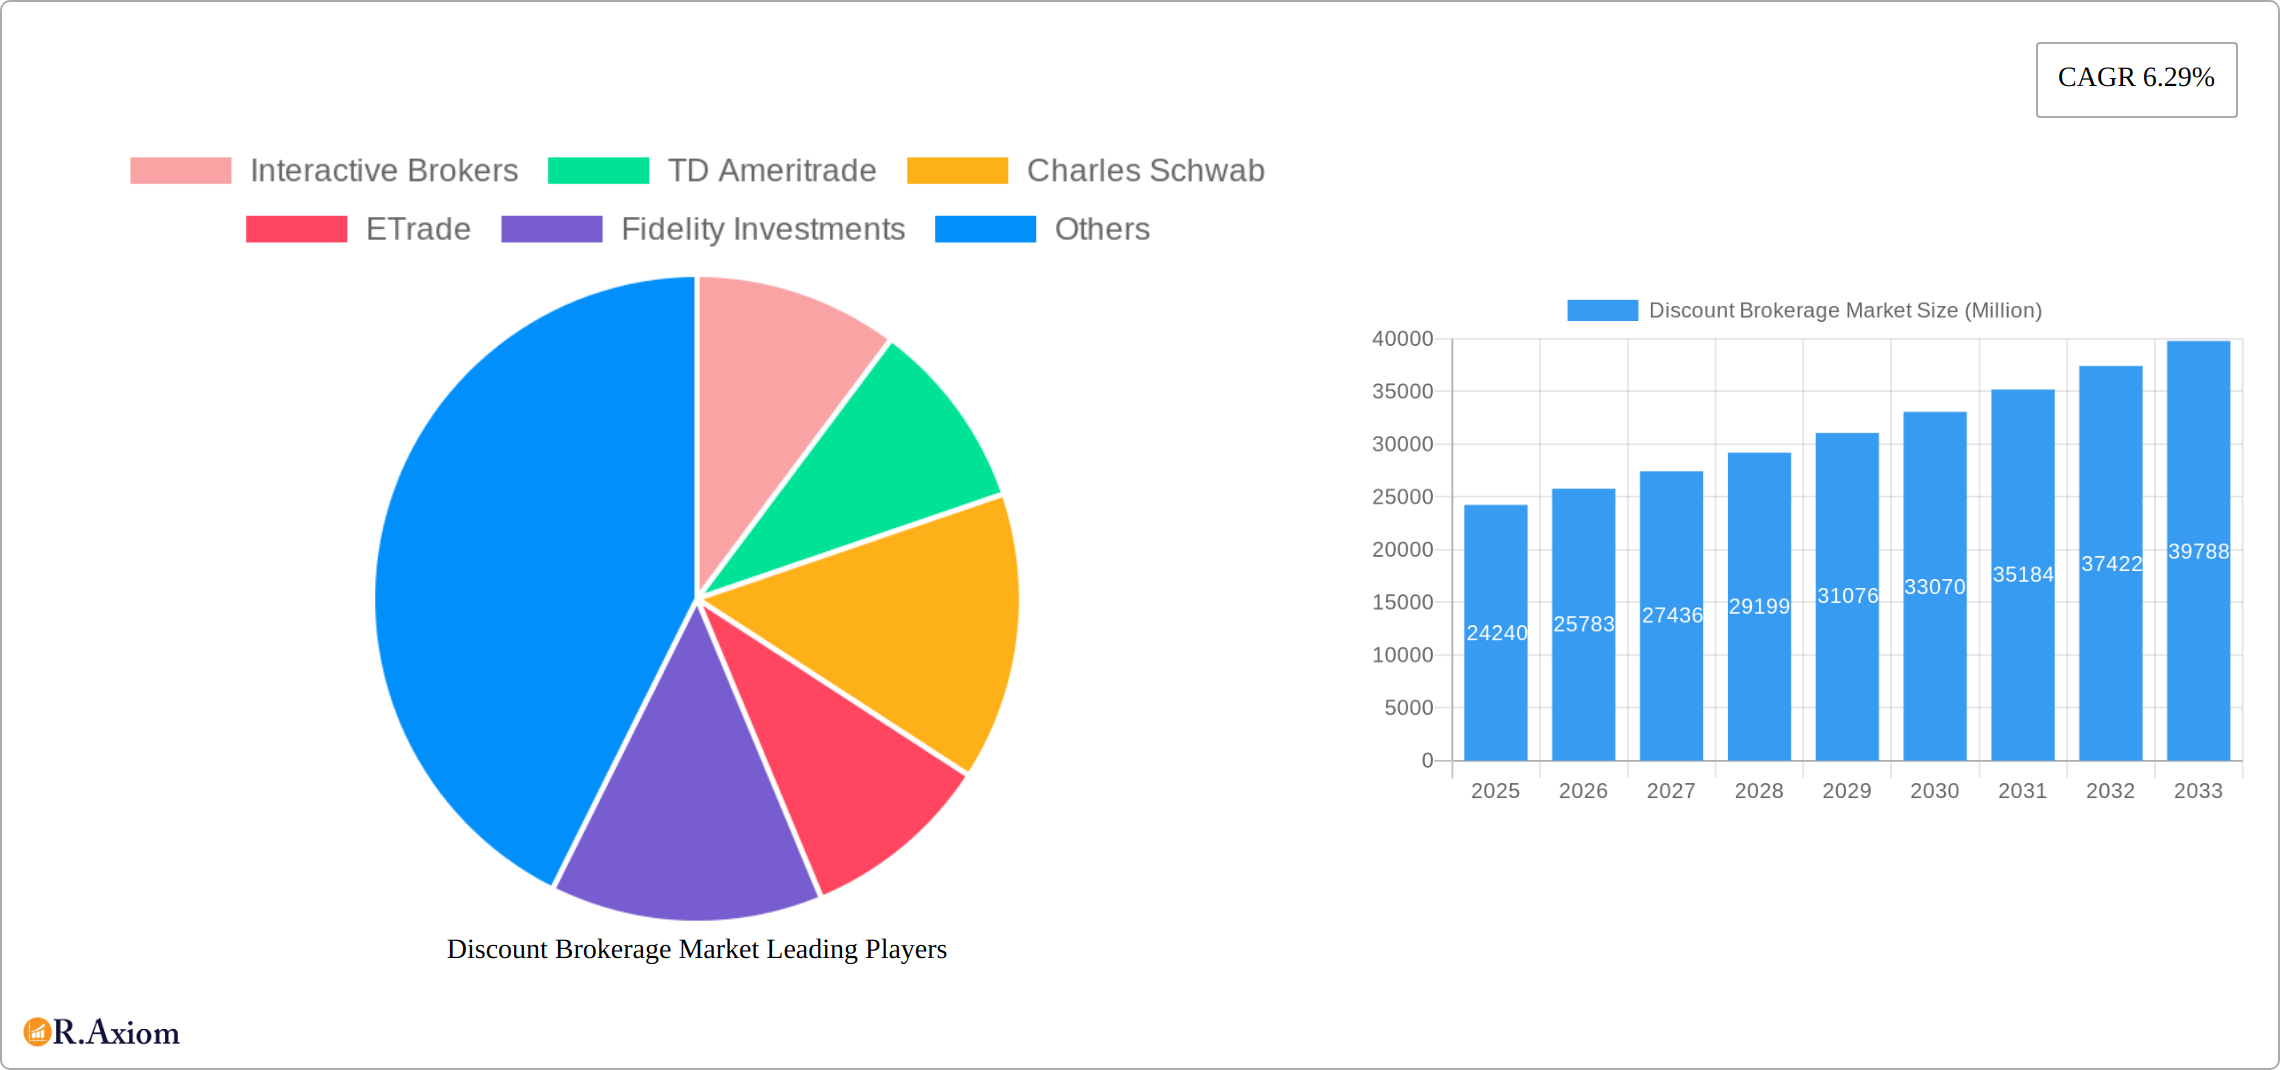
Discount Brokerage Market Market Size (In Billion)
However, the market faces certain headwinds. Regulatory scrutiny and compliance costs represent a significant challenge for brokerage firms, particularly those operating in multiple jurisdictions. Fluctuations in the broader financial markets can impact trading volumes and profitability. Maintaining investor trust and safeguarding against cyber security threats are crucial considerations for the industry's long-term sustainability. The market's future trajectory will depend on continued innovation, effective risk management, and the ability to adapt to evolving regulatory landscapes. The projected CAGR of 6.29% suggests a steady, albeit moderate, expansion over the forecast period (2025-2033), indicating a mature market with sustained growth potential fueled by technological enhancements and increasing retail investor participation.
Discount Brokerage Market Company Market Share
This comprehensive report provides a detailed analysis of the Discount Brokerage Market, covering the period from 2019 to 2033. The report leverages extensive research and data analysis to offer actionable insights for industry stakeholders, investors, and businesses operating within this dynamic sector. With a focus on market trends, competitive dynamics, and emerging opportunities, this report serves as an essential resource for navigating the complexities of the discount brokerage landscape. The report incorporates crucial data points such as market size, CAGR, and market penetration rates to provide a holistic view of the market’s evolution and future trajectory. The base year for the report is 2025, with estimations for 2025 and forecasts extending to 2033, providing a long-term perspective on market growth and potential.
Discount Brokerage Market Market Concentration & Innovation
The Discount Brokerage Market is characterized by a dynamic interplay of established giants and agile disruptors, leading to a moderately concentrated but fiercely competitive landscape. Leading players such as Interactive Brokers, TD Ameritrade, Charles Schwab, E*TRADE, Fidelity Investments, and Robinhood continue to shape market trends and capture substantial market share. However, the ecosystem is continuously enriched by a growing number of innovative smaller firms and new entrants, fostering an environment ripe for technological advancement and novel service offerings. Market share analysis for 2025 indicates that the top 5 players collectively hold approximately [Insert Estimated Market Share % Here, e.g., 75%] of the total market, with Interactive Brokers maintaining a significant lead at an estimated [Insert Interactive Brokers Market Share % Here, e.g., 22%]. Innovation is a paramount driver, fueled by the rapid adoption of cutting-edge technologies including AI-powered trading assistants, sophisticated predictive analytics, hyper-personalized mobile trading platforms, and robust, multi-layered security protocols. The evolving regulatory landscape, with an increasing emphasis on data privacy, algorithmic transparency, and investor protection, profoundly influences the direction of technological innovation and operational practices. Mergers and acquisitions (M&A) remain a strategic imperative, with deal values reaching an estimated [Insert Deal Value Amount Here, e.g., 5,000] Million in 2024, reflecting a sustained trend of consolidation aimed at achieving economies of scale and expanding service portfolios. Furthermore, end-user preferences are increasingly leaning towards intuitively designed interfaces, cost-effective trading solutions, and a broad spectrum of investment opportunities, including the burgeoning adoption of robo-advisors and fractional share trading which democratize access to capital markets.
Discount Brokerage Market Industry Trends & Insights
The Discount Brokerage Market exhibits robust growth, driven by several key factors. Technological disruptions, such as the proliferation of mobile trading apps and the increasing availability of sophisticated trading tools, have significantly lowered the barriers to entry for retail investors. These advancements are also driving down trading costs and increasing accessibility. The market is characterized by high customer churn and intense competition, forcing brokerage firms to constantly innovate to retain clients. The preference for diversified investment portfolios, including ETFs, mutual funds, and international equities, has boosted the demand for comprehensive brokerage services. Consumer preferences are increasingly shifting toward personalized investment solutions and improved customer service. This has led to the emergence of hybrid models that blend self-directed trading with advisor support. The compound annual growth rate (CAGR) for the Discount Brokerage Market is projected to be xx% during the forecast period (2025-2033), with market penetration expected to reach xx% by 2033. Competitive dynamics are characterized by price wars, product differentiation, and strategic partnerships.
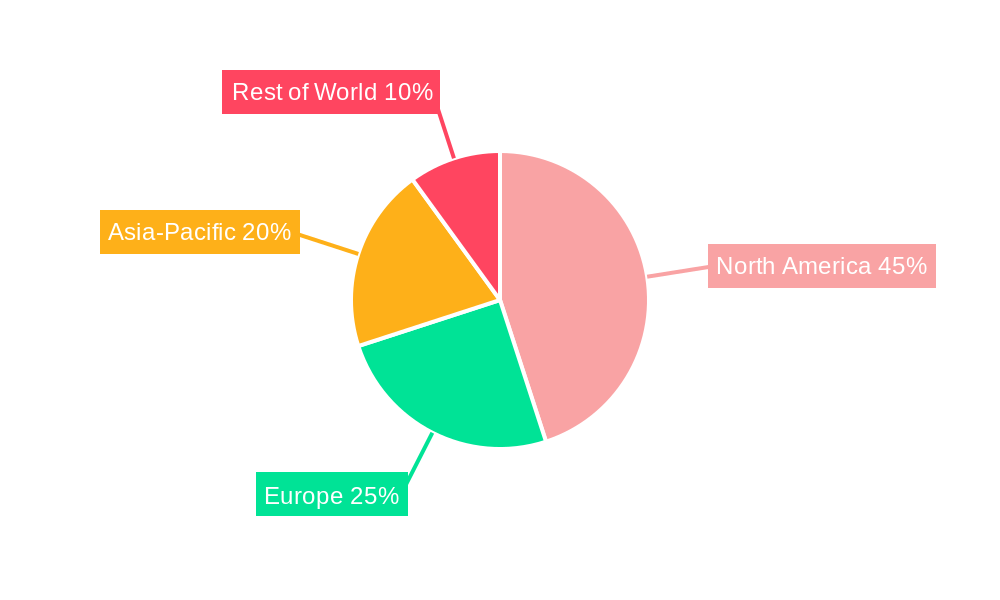
Dominant Markets & Segments in Discount Brokerage Market
The North American market currently dominates the global Discount Brokerage Market, driven by high levels of financial literacy, technological infrastructure, and the presence of established players such as Charles Schwab and Fidelity Investments. Key drivers of this dominance include robust financial regulations, a high degree of investor sophistication, and a substantial middle-class population with disposable income.
- Economic policies: Favorable tax policies and regulations supporting investments play a key role.
- Infrastructure: Well-developed technology infrastructure enables seamless online trading.
- Financial Literacy: A high level of financial literacy among the population drives participation.
However, rapidly growing markets in Asia and Europe show significant potential for expansion. The Asia-Pacific region is witnessing rapid growth, particularly in India and China, due to rising middle-class incomes, increasing internet penetration, and growing awareness of investment opportunities. The European market is driven by increasing regulatory clarity and the rise of fintech companies.
Discount Brokerage Market Product Developments
Product innovation within the discount brokerage sphere is laser-focused on elevating the user journey through the development of exceptionally intuitive interfaces, advanced analytical charting tools that empower informed decision-making, and AI-driven personalized investment recommendations tailored to individual risk appetites and financial goals. The seamless integration of artificial intelligence and machine learning algorithms is significantly refining portfolio management capabilities, enhancing risk assessment accuracy, and enabling more sophisticated predictive analytics. The widespread embrace of fractional share trading has profoundly democratized access to investing, making it attainable for individuals across a broader spectrum of financial means. These forward-thinking product developments are not only crucial for maintaining a competitive edge but also instrumental in attracting a wider, more diverse customer base and fostering enduring customer loyalty.
Report Scope & Segmentation Analysis
This comprehensive report meticulously segments the Discount Brokerage Market across several critical dimensions, offering granular insights into distinct market dynamics:
- By Service Type: The market is dissected into Full-service brokerages, Discount brokerages, and Robo-advisors. Each segment exhibits unique growth trajectories, directly reflecting evolving consumer preferences and the demand for varying levels of advisory and execution services.
- By Client Type: Analysis extends to Retail investors, Institutional investors, and High-net-worth individuals. The retail investor segment is demonstrating the most robust growth, largely propelled by heightened market accessibility and the proliferation of user-friendly digital platforms.
- By Region: A global perspective is provided by segmenting the market into North America, Europe, Asia-Pacific, and the Rest of the World. Growth projections reveal considerable regional variances, with the Asia-Pacific region anticipated to experience the most accelerated expansion, driven by emerging economies and a burgeoning investor class.
Key Drivers of Discount Brokerage Market Growth
The ascent of the Discount Brokerage Market is propelled by a confluence of powerful growth catalysts. Foremost among these are transformative technological advancements, such as the ubiquitous adoption of intuitive mobile trading applications and sophisticated AI-powered investment tools, which have dramatically enhanced market accessibility and operational convenience. Favorable macroeconomic conditions, particularly the steady rise in disposable incomes observed in many developing economies, are significantly contributing to increased participation in financial markets. Complementing these are supportive regulatory frameworks that actively promote investment activities while simultaneously safeguarding investor interests through enhanced transparency and security measures. The relentless drive towards decreasing trading costs, largely a byproduct of technological efficiencies and increased competition, further incentivizes broader market participation and investment engagement.
Challenges in the Discount Brokerage Market Sector
The Discount Brokerage Market faces several challenges. Intense competition leads to price wars, squeezing profit margins. Regulatory hurdles, including compliance costs and stringent data privacy requirements, increase operational complexity. Cybersecurity threats and data breaches pose significant risks to consumer trust and operations. Maintaining profitability with declining commission fees is a major challenge for many players.
Emerging Opportunities in Discount Brokerage Market
Emerging opportunities include the expansion into underserved markets, such as developing economies and underbanked populations. The adoption of blockchain technology for secure and transparent transactions presents significant potential. The integration of AI and machine learning for personalized financial advice further expands market possibilities. The growth of ESG investing and sustainable finance offers new avenues for specialized services.
Leading Players in the Discount Brokerage Market Market
Key Developments in Discount Brokerage Market Industry
- September 2023: HDFC Securities launched the discount brokerage platform Sky, offering a wide range of trading and investment options. This enhances competition and expands the product offerings.
- September 2023: Ujjivan SFB partnered with SMC Global Securities to extend online trading services, broadening market accessibility. This indicates a trend towards partnerships to access a wider customer base.
Strategic Outlook for Discount Brokerage Market Market
The Discount Brokerage Market is on a trajectory of sustained and robust growth, underpinned by the relentless march of technological innovation, the expanding imperative of financial inclusion, and the increasing dominance of the digitally native investor. Significant opportunities lie in the development and deployment of highly personalized investment solutions, the continuous enhancement of robust security features to build and maintain client trust, and strategic expansion into untapped or underserved geographic markets. Ultimately, a steadfast commitment to refining the customer experience and consistently introducing groundbreaking trading tools will be indispensable for navigating and thriving within this intensely competitive and rapidly evolving landscape.
Discount Brokerage Market Segmentation
-
1. Mode
- 1.1. Online Discount Brokerage Service
- 1.2. Offline Discount Brokerage Service
-
2. Application
- 2.1. Individual
- 2.2. Enterprise
- 2.3. Government Agencies
-
3. Services
- 3.1. Order Execution and Advisory
- 3.2. Discretionary
- 3.3. Online Trading Platforms
- 3.4. Education and Investor Resources
-
4. Commission
- 4.1. Commission-free Brokers
- 4.2. Fixed Commission Brokers
Discount Brokerage Market Segmentation By Geography
-
1. North America
- 1.1. United States
- 1.2. Canada
- 1.3. Mexico
- 1.4. Rest of North America
-
2. Europe
- 2.1. Germany
- 2.2. United Kingdom
- 2.3. France
- 2.4. Russia
- 2.5. Spain
- 2.6. Rest of Europe
-
3. Asia Pacific
- 3.1. India
- 3.2. China
- 3.3. Japan
- 3.4. Rest of Asia Pacific
-
4. South America
- 4.1. Brazil
- 4.2. Argentina
- 4.3. Rest of South America
-
5. Middle East
- 5.1. United Arab Emirates
- 5.2. Saudi Arabia
- 5.3. Rest of Middle East
Discount Brokerage Market Regional Market Share
Geographic Coverage of Discount Brokerage Market
Discount Brokerage Market REPORT HIGHLIGHTS
| Aspects | Details |
|---|---|
| Study Period | 2020-2034 |
| Base Year | 2025 |
| Estimated Year | 2026 |
| Forecast Period | 2026-2034 |
| Historical Period | 2020-2025 |
| Growth Rate | CAGR of 6.29% from 2020-2034 |
| Segmentation |
|
Table of Contents
- 1. Introduction
- 1.1. Research Scope
- 1.2. Market Segmentation
- 1.3. Research Objective
- 1.4. Definitions and Assumptions
- 2. Executive Summary
- 2.1. Market Snapshot
- 3. Market Dynamics
- 3.1. Market Drivers
- 3.2. Market Restrains
- 3.3. Market Trends
- 3.4. Market Opportunities
- 4. Market Factor Analysis
- 4.1. Porters Five Forces
- 4.1.1. Bargaining Power of Suppliers
- 4.1.2. Bargaining Power of Buyers
- 4.1.3. Threat of New Entrants
- 4.1.4. Threat of Substitutes
- 4.1.5. Competitive Rivalry
- 4.2. PESTEL analysis
- 4.3. BCG Analysis
- 4.3.1. Stars (High Growth, High Market Share)
- 4.3.2. Cash Cows (Low Growth, High Market Share)
- 4.3.3. Question Mark (High Growth, Low Market Share)
- 4.3.4. Dogs (Low Growth, Low Market Share)
- 4.4. Ansoff Matrix Analysis
- 4.5. Supply Chain Analysis
- 4.6. Regulatory Landscape
- 4.7. Current Market Potential and Opportunity Assessment (TAM–SAM–SOM Framework)
- 4.8. RAX Analyst Note
- 4.1. Porters Five Forces
- 5. Market Analysis, Insights and Forecast 2021-2033
- 5.1. Market Analysis, Insights and Forecast - by Mode
- 5.1.1. Online Discount Brokerage Service
- 5.1.2. Offline Discount Brokerage Service
- 5.2. Market Analysis, Insights and Forecast - by Application
- 5.2.1. Individual
- 5.2.2. Enterprise
- 5.2.3. Government Agencies
- 5.3. Market Analysis, Insights and Forecast - by Services
- 5.3.1. Order Execution and Advisory
- 5.3.2. Discretionary
- 5.3.3. Online Trading Platforms
- 5.3.4. Education and Investor Resources
- 5.4. Market Analysis, Insights and Forecast - by Commission
- 5.4.1. Commission-free Brokers
- 5.4.2. Fixed Commission Brokers
- 5.5. Market Analysis, Insights and Forecast - by Region
- 5.5.1. North America
- 5.5.2. Europe
- 5.5.3. Asia Pacific
- 5.5.4. South America
- 5.5.5. Middle East
- 5.1. Market Analysis, Insights and Forecast - by Mode
- 6. Global Discount Brokerage Market Analysis, Insights and Forecast, 2021-2033
- 6.1. Market Analysis, Insights and Forecast - by Mode
- 6.1.1. Online Discount Brokerage Service
- 6.1.2. Offline Discount Brokerage Service
- 6.2. Market Analysis, Insights and Forecast - by Application
- 6.2.1. Individual
- 6.2.2. Enterprise
- 6.2.3. Government Agencies
- 6.3. Market Analysis, Insights and Forecast - by Services
- 6.3.1. Order Execution and Advisory
- 6.3.2. Discretionary
- 6.3.3. Online Trading Platforms
- 6.3.4. Education and Investor Resources
- 6.4. Market Analysis, Insights and Forecast - by Commission
- 6.4.1. Commission-free Brokers
- 6.4.2. Fixed Commission Brokers
- 6.1. Market Analysis, Insights and Forecast - by Mode
- 7. North America Discount Brokerage Market Analysis, Insights and Forecast, 2020-2032
- 7.1. Market Analysis, Insights and Forecast - by Mode
- 7.1.1. Online Discount Brokerage Service
- 7.1.2. Offline Discount Brokerage Service
- 7.2. Market Analysis, Insights and Forecast - by Application
- 7.2.1. Individual
- 7.2.2. Enterprise
- 7.2.3. Government Agencies
- 7.3. Market Analysis, Insights and Forecast - by Services
- 7.3.1. Order Execution and Advisory
- 7.3.2. Discretionary
- 7.3.3. Online Trading Platforms
- 7.3.4. Education and Investor Resources
- 7.4. Market Analysis, Insights and Forecast - by Commission
- 7.4.1. Commission-free Brokers
- 7.4.2. Fixed Commission Brokers
- 7.1. Market Analysis, Insights and Forecast - by Mode
- 8. Europe Discount Brokerage Market Analysis, Insights and Forecast, 2020-2032
- 8.1. Market Analysis, Insights and Forecast - by Mode
- 8.1.1. Online Discount Brokerage Service
- 8.1.2. Offline Discount Brokerage Service
- 8.2. Market Analysis, Insights and Forecast - by Application
- 8.2.1. Individual
- 8.2.2. Enterprise
- 8.2.3. Government Agencies
- 8.3. Market Analysis, Insights and Forecast - by Services
- 8.3.1. Order Execution and Advisory
- 8.3.2. Discretionary
- 8.3.3. Online Trading Platforms
- 8.3.4. Education and Investor Resources
- 8.4. Market Analysis, Insights and Forecast - by Commission
- 8.4.1. Commission-free Brokers
- 8.4.2. Fixed Commission Brokers
- 8.1. Market Analysis, Insights and Forecast - by Mode
- 9. Asia Pacific Discount Brokerage Market Analysis, Insights and Forecast, 2020-2032
- 9.1. Market Analysis, Insights and Forecast - by Mode
- 9.1.1. Online Discount Brokerage Service
- 9.1.2. Offline Discount Brokerage Service
- 9.2. Market Analysis, Insights and Forecast - by Application
- 9.2.1. Individual
- 9.2.2. Enterprise
- 9.2.3. Government Agencies
- 9.3. Market Analysis, Insights and Forecast - by Services
- 9.3.1. Order Execution and Advisory
- 9.3.2. Discretionary
- 9.3.3. Online Trading Platforms
- 9.3.4. Education and Investor Resources
- 9.4. Market Analysis, Insights and Forecast - by Commission
- 9.4.1. Commission-free Brokers
- 9.4.2. Fixed Commission Brokers
- 9.1. Market Analysis, Insights and Forecast - by Mode
- 10. South America Discount Brokerage Market Analysis, Insights and Forecast, 2020-2032
- 10.1. Market Analysis, Insights and Forecast - by Mode
- 10.1.1. Online Discount Brokerage Service
- 10.1.2. Offline Discount Brokerage Service
- 10.2. Market Analysis, Insights and Forecast - by Application
- 10.2.1. Individual
- 10.2.2. Enterprise
- 10.2.3. Government Agencies
- 10.3. Market Analysis, Insights and Forecast - by Services
- 10.3.1. Order Execution and Advisory
- 10.3.2. Discretionary
- 10.3.3. Online Trading Platforms
- 10.3.4. Education and Investor Resources
- 10.4. Market Analysis, Insights and Forecast - by Commission
- 10.4.1. Commission-free Brokers
- 10.4.2. Fixed Commission Brokers
- 10.1. Market Analysis, Insights and Forecast - by Mode
- 11. Middle East Discount Brokerage Market Analysis, Insights and Forecast, 2020-2032
- 11.1. Market Analysis, Insights and Forecast - by Mode
- 11.1.1. Online Discount Brokerage Service
- 11.1.2. Offline Discount Brokerage Service
- 11.2. Market Analysis, Insights and Forecast - by Application
- 11.2.1. Individual
- 11.2.2. Enterprise
- 11.2.3. Government Agencies
- 11.3. Market Analysis, Insights and Forecast - by Services
- 11.3.1. Order Execution and Advisory
- 11.3.2. Discretionary
- 11.3.3. Online Trading Platforms
- 11.3.4. Education and Investor Resources
- 11.4. Market Analysis, Insights and Forecast - by Commission
- 11.4.1. Commission-free Brokers
- 11.4.2. Fixed Commission Brokers
- 11.1. Market Analysis, Insights and Forecast - by Mode
- 12. Competitive Analysis
- 12.1. Company Profiles
- 12.1.1 Interactive Brokers
- 12.1.1.1. Company Overview
- 12.1.1.2. Products
- 12.1.1.3. Company Financials
- 12.1.1.4. SWOT Analysis
- 12.1.2 TD Ameritrade
- 12.1.2.1. Company Overview
- 12.1.2.2. Products
- 12.1.2.3. Company Financials
- 12.1.2.4. SWOT Analysis
- 12.1.3 Charles Schwab
- 12.1.3.1. Company Overview
- 12.1.3.2. Products
- 12.1.3.3. Company Financials
- 12.1.3.4. SWOT Analysis
- 12.1.4 ETrade
- 12.1.4.1. Company Overview
- 12.1.4.2. Products
- 12.1.4.3. Company Financials
- 12.1.4.4. SWOT Analysis
- 12.1.5 Fidelity Investments
- 12.1.5.1. Company Overview
- 12.1.5.2. Products
- 12.1.5.3. Company Financials
- 12.1.5.4. SWOT Analysis
- 12.1.6 Robinhood
- 12.1.6.1. Company Overview
- 12.1.6.2. Products
- 12.1.6.3. Company Financials
- 12.1.6.4. SWOT Analysis
- 12.1.7 Vanguard
- 12.1.7.1. Company Overview
- 12.1.7.2. Products
- 12.1.7.3. Company Financials
- 12.1.7.4. SWOT Analysis
- 12.1.8 Ally Invest
- 12.1.8.1. Company Overview
- 12.1.8.2. Products
- 12.1.8.3. Company Financials
- 12.1.8.4. SWOT Analysis
- 12.1.9 Firstrade
- 12.1.9.1. Company Overview
- 12.1.9.2. Products
- 12.1.9.3. Company Financials
- 12.1.9.4. SWOT Analysis
- 12.1.10 DEGIRO**List Not Exhaustive
- 12.1.10.1. Company Overview
- 12.1.10.2. Products
- 12.1.10.3. Company Financials
- 12.1.10.4. SWOT Analysis
- 12.1.1 Interactive Brokers
- 12.2. Market Entropy
- 12.2.1 Company's Key Areas Served
- 12.2.2 Recent Developments
- 12.3. Company Market Share Analysis 2025
- 12.3.1 Top 5 Companies Market Share Analysis
- 12.3.2 Top 3 Companies Market Share Analysis
- 12.4. List of Potential Customers
- 13. Research Methodology
List of Figures
- Figure 1: Global Discount Brokerage Market Revenue Breakdown (Million, %) by Region 2025 & 2033
- Figure 2: Global Discount Brokerage Market Volume Breakdown (Billion, %) by Region 2025 & 2033
- Figure 3: North America Discount Brokerage Market Revenue (Million), by Mode 2025 & 2033
- Figure 4: North America Discount Brokerage Market Volume (Billion), by Mode 2025 & 2033
- Figure 5: North America Discount Brokerage Market Revenue Share (%), by Mode 2025 & 2033
- Figure 6: North America Discount Brokerage Market Volume Share (%), by Mode 2025 & 2033
- Figure 7: North America Discount Brokerage Market Revenue (Million), by Application 2025 & 2033
- Figure 8: North America Discount Brokerage Market Volume (Billion), by Application 2025 & 2033
- Figure 9: North America Discount Brokerage Market Revenue Share (%), by Application 2025 & 2033
- Figure 10: North America Discount Brokerage Market Volume Share (%), by Application 2025 & 2033
- Figure 11: North America Discount Brokerage Market Revenue (Million), by Services 2025 & 2033
- Figure 12: North America Discount Brokerage Market Volume (Billion), by Services 2025 & 2033
- Figure 13: North America Discount Brokerage Market Revenue Share (%), by Services 2025 & 2033
- Figure 14: North America Discount Brokerage Market Volume Share (%), by Services 2025 & 2033
- Figure 15: North America Discount Brokerage Market Revenue (Million), by Commission 2025 & 2033
- Figure 16: North America Discount Brokerage Market Volume (Billion), by Commission 2025 & 2033
- Figure 17: North America Discount Brokerage Market Revenue Share (%), by Commission 2025 & 2033
- Figure 18: North America Discount Brokerage Market Volume Share (%), by Commission 2025 & 2033
- Figure 19: North America Discount Brokerage Market Revenue (Million), by Country 2025 & 2033
- Figure 20: North America Discount Brokerage Market Volume (Billion), by Country 2025 & 2033
- Figure 21: North America Discount Brokerage Market Revenue Share (%), by Country 2025 & 2033
- Figure 22: North America Discount Brokerage Market Volume Share (%), by Country 2025 & 2033
- Figure 23: Europe Discount Brokerage Market Revenue (Million), by Mode 2025 & 2033
- Figure 24: Europe Discount Brokerage Market Volume (Billion), by Mode 2025 & 2033
- Figure 25: Europe Discount Brokerage Market Revenue Share (%), by Mode 2025 & 2033
- Figure 26: Europe Discount Brokerage Market Volume Share (%), by Mode 2025 & 2033
- Figure 27: Europe Discount Brokerage Market Revenue (Million), by Application 2025 & 2033
- Figure 28: Europe Discount Brokerage Market Volume (Billion), by Application 2025 & 2033
- Figure 29: Europe Discount Brokerage Market Revenue Share (%), by Application 2025 & 2033
- Figure 30: Europe Discount Brokerage Market Volume Share (%), by Application 2025 & 2033
- Figure 31: Europe Discount Brokerage Market Revenue (Million), by Services 2025 & 2033
- Figure 32: Europe Discount Brokerage Market Volume (Billion), by Services 2025 & 2033
- Figure 33: Europe Discount Brokerage Market Revenue Share (%), by Services 2025 & 2033
- Figure 34: Europe Discount Brokerage Market Volume Share (%), by Services 2025 & 2033
- Figure 35: Europe Discount Brokerage Market Revenue (Million), by Commission 2025 & 2033
- Figure 36: Europe Discount Brokerage Market Volume (Billion), by Commission 2025 & 2033
- Figure 37: Europe Discount Brokerage Market Revenue Share (%), by Commission 2025 & 2033
- Figure 38: Europe Discount Brokerage Market Volume Share (%), by Commission 2025 & 2033
- Figure 39: Europe Discount Brokerage Market Revenue (Million), by Country 2025 & 2033
- Figure 40: Europe Discount Brokerage Market Volume (Billion), by Country 2025 & 2033
- Figure 41: Europe Discount Brokerage Market Revenue Share (%), by Country 2025 & 2033
- Figure 42: Europe Discount Brokerage Market Volume Share (%), by Country 2025 & 2033
- Figure 43: Asia Pacific Discount Brokerage Market Revenue (Million), by Mode 2025 & 2033
- Figure 44: Asia Pacific Discount Brokerage Market Volume (Billion), by Mode 2025 & 2033
- Figure 45: Asia Pacific Discount Brokerage Market Revenue Share (%), by Mode 2025 & 2033
- Figure 46: Asia Pacific Discount Brokerage Market Volume Share (%), by Mode 2025 & 2033
- Figure 47: Asia Pacific Discount Brokerage Market Revenue (Million), by Application 2025 & 2033
- Figure 48: Asia Pacific Discount Brokerage Market Volume (Billion), by Application 2025 & 2033
- Figure 49: Asia Pacific Discount Brokerage Market Revenue Share (%), by Application 2025 & 2033
- Figure 50: Asia Pacific Discount Brokerage Market Volume Share (%), by Application 2025 & 2033
- Figure 51: Asia Pacific Discount Brokerage Market Revenue (Million), by Services 2025 & 2033
- Figure 52: Asia Pacific Discount Brokerage Market Volume (Billion), by Services 2025 & 2033
- Figure 53: Asia Pacific Discount Brokerage Market Revenue Share (%), by Services 2025 & 2033
- Figure 54: Asia Pacific Discount Brokerage Market Volume Share (%), by Services 2025 & 2033
- Figure 55: Asia Pacific Discount Brokerage Market Revenue (Million), by Commission 2025 & 2033
- Figure 56: Asia Pacific Discount Brokerage Market Volume (Billion), by Commission 2025 & 2033
- Figure 57: Asia Pacific Discount Brokerage Market Revenue Share (%), by Commission 2025 & 2033
- Figure 58: Asia Pacific Discount Brokerage Market Volume Share (%), by Commission 2025 & 2033
- Figure 59: Asia Pacific Discount Brokerage Market Revenue (Million), by Country 2025 & 2033
- Figure 60: Asia Pacific Discount Brokerage Market Volume (Billion), by Country 2025 & 2033
- Figure 61: Asia Pacific Discount Brokerage Market Revenue Share (%), by Country 2025 & 2033
- Figure 62: Asia Pacific Discount Brokerage Market Volume Share (%), by Country 2025 & 2033
- Figure 63: South America Discount Brokerage Market Revenue (Million), by Mode 2025 & 2033
- Figure 64: South America Discount Brokerage Market Volume (Billion), by Mode 2025 & 2033
- Figure 65: South America Discount Brokerage Market Revenue Share (%), by Mode 2025 & 2033
- Figure 66: South America Discount Brokerage Market Volume Share (%), by Mode 2025 & 2033
- Figure 67: South America Discount Brokerage Market Revenue (Million), by Application 2025 & 2033
- Figure 68: South America Discount Brokerage Market Volume (Billion), by Application 2025 & 2033
- Figure 69: South America Discount Brokerage Market Revenue Share (%), by Application 2025 & 2033
- Figure 70: South America Discount Brokerage Market Volume Share (%), by Application 2025 & 2033
- Figure 71: South America Discount Brokerage Market Revenue (Million), by Services 2025 & 2033
- Figure 72: South America Discount Brokerage Market Volume (Billion), by Services 2025 & 2033
- Figure 73: South America Discount Brokerage Market Revenue Share (%), by Services 2025 & 2033
- Figure 74: South America Discount Brokerage Market Volume Share (%), by Services 2025 & 2033
- Figure 75: South America Discount Brokerage Market Revenue (Million), by Commission 2025 & 2033
- Figure 76: South America Discount Brokerage Market Volume (Billion), by Commission 2025 & 2033
- Figure 77: South America Discount Brokerage Market Revenue Share (%), by Commission 2025 & 2033
- Figure 78: South America Discount Brokerage Market Volume Share (%), by Commission 2025 & 2033
- Figure 79: South America Discount Brokerage Market Revenue (Million), by Country 2025 & 2033
- Figure 80: South America Discount Brokerage Market Volume (Billion), by Country 2025 & 2033
- Figure 81: South America Discount Brokerage Market Revenue Share (%), by Country 2025 & 2033
- Figure 82: South America Discount Brokerage Market Volume Share (%), by Country 2025 & 2033
- Figure 83: Middle East Discount Brokerage Market Revenue (Million), by Mode 2025 & 2033
- Figure 84: Middle East Discount Brokerage Market Volume (Billion), by Mode 2025 & 2033
- Figure 85: Middle East Discount Brokerage Market Revenue Share (%), by Mode 2025 & 2033
- Figure 86: Middle East Discount Brokerage Market Volume Share (%), by Mode 2025 & 2033
- Figure 87: Middle East Discount Brokerage Market Revenue (Million), by Application 2025 & 2033
- Figure 88: Middle East Discount Brokerage Market Volume (Billion), by Application 2025 & 2033
- Figure 89: Middle East Discount Brokerage Market Revenue Share (%), by Application 2025 & 2033
- Figure 90: Middle East Discount Brokerage Market Volume Share (%), by Application 2025 & 2033
- Figure 91: Middle East Discount Brokerage Market Revenue (Million), by Services 2025 & 2033
- Figure 92: Middle East Discount Brokerage Market Volume (Billion), by Services 2025 & 2033
- Figure 93: Middle East Discount Brokerage Market Revenue Share (%), by Services 2025 & 2033
- Figure 94: Middle East Discount Brokerage Market Volume Share (%), by Services 2025 & 2033
- Figure 95: Middle East Discount Brokerage Market Revenue (Million), by Commission 2025 & 2033
- Figure 96: Middle East Discount Brokerage Market Volume (Billion), by Commission 2025 & 2033
- Figure 97: Middle East Discount Brokerage Market Revenue Share (%), by Commission 2025 & 2033
- Figure 98: Middle East Discount Brokerage Market Volume Share (%), by Commission 2025 & 2033
- Figure 99: Middle East Discount Brokerage Market Revenue (Million), by Country 2025 & 2033
- Figure 100: Middle East Discount Brokerage Market Volume (Billion), by Country 2025 & 2033
- Figure 101: Middle East Discount Brokerage Market Revenue Share (%), by Country 2025 & 2033
- Figure 102: Middle East Discount Brokerage Market Volume Share (%), by Country 2025 & 2033
List of Tables
- Table 1: Global Discount Brokerage Market Revenue Million Forecast, by Mode 2020 & 2033
- Table 2: Global Discount Brokerage Market Volume Billion Forecast, by Mode 2020 & 2033
- Table 3: Global Discount Brokerage Market Revenue Million Forecast, by Application 2020 & 2033
- Table 4: Global Discount Brokerage Market Volume Billion Forecast, by Application 2020 & 2033
- Table 5: Global Discount Brokerage Market Revenue Million Forecast, by Services 2020 & 2033
- Table 6: Global Discount Brokerage Market Volume Billion Forecast, by Services 2020 & 2033
- Table 7: Global Discount Brokerage Market Revenue Million Forecast, by Commission 2020 & 2033
- Table 8: Global Discount Brokerage Market Volume Billion Forecast, by Commission 2020 & 2033
- Table 9: Global Discount Brokerage Market Revenue Million Forecast, by Region 2020 & 2033
- Table 10: Global Discount Brokerage Market Volume Billion Forecast, by Region 2020 & 2033
- Table 11: Global Discount Brokerage Market Revenue Million Forecast, by Mode 2020 & 2033
- Table 12: Global Discount Brokerage Market Volume Billion Forecast, by Mode 2020 & 2033
- Table 13: Global Discount Brokerage Market Revenue Million Forecast, by Application 2020 & 2033
- Table 14: Global Discount Brokerage Market Volume Billion Forecast, by Application 2020 & 2033
- Table 15: Global Discount Brokerage Market Revenue Million Forecast, by Services 2020 & 2033
- Table 16: Global Discount Brokerage Market Volume Billion Forecast, by Services 2020 & 2033
- Table 17: Global Discount Brokerage Market Revenue Million Forecast, by Commission 2020 & 2033
- Table 18: Global Discount Brokerage Market Volume Billion Forecast, by Commission 2020 & 2033
- Table 19: Global Discount Brokerage Market Revenue Million Forecast, by Country 2020 & 2033
- Table 20: Global Discount Brokerage Market Volume Billion Forecast, by Country 2020 & 2033
- Table 21: United States Discount Brokerage Market Revenue (Million) Forecast, by Application 2020 & 2033
- Table 22: United States Discount Brokerage Market Volume (Billion) Forecast, by Application 2020 & 2033
- Table 23: Canada Discount Brokerage Market Revenue (Million) Forecast, by Application 2020 & 2033
- Table 24: Canada Discount Brokerage Market Volume (Billion) Forecast, by Application 2020 & 2033
- Table 25: Mexico Discount Brokerage Market Revenue (Million) Forecast, by Application 2020 & 2033
- Table 26: Mexico Discount Brokerage Market Volume (Billion) Forecast, by Application 2020 & 2033
- Table 27: Rest of North America Discount Brokerage Market Revenue (Million) Forecast, by Application 2020 & 2033
- Table 28: Rest of North America Discount Brokerage Market Volume (Billion) Forecast, by Application 2020 & 2033
- Table 29: Global Discount Brokerage Market Revenue Million Forecast, by Mode 2020 & 2033
- Table 30: Global Discount Brokerage Market Volume Billion Forecast, by Mode 2020 & 2033
- Table 31: Global Discount Brokerage Market Revenue Million Forecast, by Application 2020 & 2033
- Table 32: Global Discount Brokerage Market Volume Billion Forecast, by Application 2020 & 2033
- Table 33: Global Discount Brokerage Market Revenue Million Forecast, by Services 2020 & 2033
- Table 34: Global Discount Brokerage Market Volume Billion Forecast, by Services 2020 & 2033
- Table 35: Global Discount Brokerage Market Revenue Million Forecast, by Commission 2020 & 2033
- Table 36: Global Discount Brokerage Market Volume Billion Forecast, by Commission 2020 & 2033
- Table 37: Global Discount Brokerage Market Revenue Million Forecast, by Country 2020 & 2033
- Table 38: Global Discount Brokerage Market Volume Billion Forecast, by Country 2020 & 2033
- Table 39: Germany Discount Brokerage Market Revenue (Million) Forecast, by Application 2020 & 2033
- Table 40: Germany Discount Brokerage Market Volume (Billion) Forecast, by Application 2020 & 2033
- Table 41: United Kingdom Discount Brokerage Market Revenue (Million) Forecast, by Application 2020 & 2033
- Table 42: United Kingdom Discount Brokerage Market Volume (Billion) Forecast, by Application 2020 & 2033
- Table 43: France Discount Brokerage Market Revenue (Million) Forecast, by Application 2020 & 2033
- Table 44: France Discount Brokerage Market Volume (Billion) Forecast, by Application 2020 & 2033
- Table 45: Russia Discount Brokerage Market Revenue (Million) Forecast, by Application 2020 & 2033
- Table 46: Russia Discount Brokerage Market Volume (Billion) Forecast, by Application 2020 & 2033
- Table 47: Spain Discount Brokerage Market Revenue (Million) Forecast, by Application 2020 & 2033
- Table 48: Spain Discount Brokerage Market Volume (Billion) Forecast, by Application 2020 & 2033
- Table 49: Rest of Europe Discount Brokerage Market Revenue (Million) Forecast, by Application 2020 & 2033
- Table 50: Rest of Europe Discount Brokerage Market Volume (Billion) Forecast, by Application 2020 & 2033
- Table 51: Global Discount Brokerage Market Revenue Million Forecast, by Mode 2020 & 2033
- Table 52: Global Discount Brokerage Market Volume Billion Forecast, by Mode 2020 & 2033
- Table 53: Global Discount Brokerage Market Revenue Million Forecast, by Application 2020 & 2033
- Table 54: Global Discount Brokerage Market Volume Billion Forecast, by Application 2020 & 2033
- Table 55: Global Discount Brokerage Market Revenue Million Forecast, by Services 2020 & 2033
- Table 56: Global Discount Brokerage Market Volume Billion Forecast, by Services 2020 & 2033
- Table 57: Global Discount Brokerage Market Revenue Million Forecast, by Commission 2020 & 2033
- Table 58: Global Discount Brokerage Market Volume Billion Forecast, by Commission 2020 & 2033
- Table 59: Global Discount Brokerage Market Revenue Million Forecast, by Country 2020 & 2033
- Table 60: Global Discount Brokerage Market Volume Billion Forecast, by Country 2020 & 2033
- Table 61: India Discount Brokerage Market Revenue (Million) Forecast, by Application 2020 & 2033
- Table 62: India Discount Brokerage Market Volume (Billion) Forecast, by Application 2020 & 2033
- Table 63: China Discount Brokerage Market Revenue (Million) Forecast, by Application 2020 & 2033
- Table 64: China Discount Brokerage Market Volume (Billion) Forecast, by Application 2020 & 2033
- Table 65: Japan Discount Brokerage Market Revenue (Million) Forecast, by Application 2020 & 2033
- Table 66: Japan Discount Brokerage Market Volume (Billion) Forecast, by Application 2020 & 2033
- Table 67: Rest of Asia Pacific Discount Brokerage Market Revenue (Million) Forecast, by Application 2020 & 2033
- Table 68: Rest of Asia Pacific Discount Brokerage Market Volume (Billion) Forecast, by Application 2020 & 2033
- Table 69: Global Discount Brokerage Market Revenue Million Forecast, by Mode 2020 & 2033
- Table 70: Global Discount Brokerage Market Volume Billion Forecast, by Mode 2020 & 2033
- Table 71: Global Discount Brokerage Market Revenue Million Forecast, by Application 2020 & 2033
- Table 72: Global Discount Brokerage Market Volume Billion Forecast, by Application 2020 & 2033
- Table 73: Global Discount Brokerage Market Revenue Million Forecast, by Services 2020 & 2033
- Table 74: Global Discount Brokerage Market Volume Billion Forecast, by Services 2020 & 2033
- Table 75: Global Discount Brokerage Market Revenue Million Forecast, by Commission 2020 & 2033
- Table 76: Global Discount Brokerage Market Volume Billion Forecast, by Commission 2020 & 2033
- Table 77: Global Discount Brokerage Market Revenue Million Forecast, by Country 2020 & 2033
- Table 78: Global Discount Brokerage Market Volume Billion Forecast, by Country 2020 & 2033
- Table 79: Brazil Discount Brokerage Market Revenue (Million) Forecast, by Application 2020 & 2033
- Table 80: Brazil Discount Brokerage Market Volume (Billion) Forecast, by Application 2020 & 2033
- Table 81: Argentina Discount Brokerage Market Revenue (Million) Forecast, by Application 2020 & 2033
- Table 82: Argentina Discount Brokerage Market Volume (Billion) Forecast, by Application 2020 & 2033
- Table 83: Rest of South America Discount Brokerage Market Revenue (Million) Forecast, by Application 2020 & 2033
- Table 84: Rest of South America Discount Brokerage Market Volume (Billion) Forecast, by Application 2020 & 2033
- Table 85: Global Discount Brokerage Market Revenue Million Forecast, by Mode 2020 & 2033
- Table 86: Global Discount Brokerage Market Volume Billion Forecast, by Mode 2020 & 2033
- Table 87: Global Discount Brokerage Market Revenue Million Forecast, by Application 2020 & 2033
- Table 88: Global Discount Brokerage Market Volume Billion Forecast, by Application 2020 & 2033
- Table 89: Global Discount Brokerage Market Revenue Million Forecast, by Services 2020 & 2033
- Table 90: Global Discount Brokerage Market Volume Billion Forecast, by Services 2020 & 2033
- Table 91: Global Discount Brokerage Market Revenue Million Forecast, by Commission 2020 & 2033
- Table 92: Global Discount Brokerage Market Volume Billion Forecast, by Commission 2020 & 2033
- Table 93: Global Discount Brokerage Market Revenue Million Forecast, by Country 2020 & 2033
- Table 94: Global Discount Brokerage Market Volume Billion Forecast, by Country 2020 & 2033
- Table 95: United Arab Emirates Discount Brokerage Market Revenue (Million) Forecast, by Application 2020 & 2033
- Table 96: United Arab Emirates Discount Brokerage Market Volume (Billion) Forecast, by Application 2020 & 2033
- Table 97: Saudi Arabia Discount Brokerage Market Revenue (Million) Forecast, by Application 2020 & 2033
- Table 98: Saudi Arabia Discount Brokerage Market Volume (Billion) Forecast, by Application 2020 & 2033
- Table 99: Rest of Middle East Discount Brokerage Market Revenue (Million) Forecast, by Application 2020 & 2033
- Table 100: Rest of Middle East Discount Brokerage Market Volume (Billion) Forecast, by Application 2020 & 2033
Frequently Asked Questions
1. What is the projected Compound Annual Growth Rate (CAGR) of the Discount Brokerage Market?
The projected CAGR is approximately 6.29%.
2. Which companies are prominent players in the Discount Brokerage Market?
Key companies in the market include Interactive Brokers, TD Ameritrade, Charles Schwab, ETrade, Fidelity Investments, Robinhood, Vanguard, Ally Invest, Firstrade, DEGIRO**List Not Exhaustive.
3. What are the main segments of the Discount Brokerage Market?
The market segments include Mode, Application, Services , Commission.
4. Can you provide details about the market size?
The market size is estimated to be USD 24.24 Million as of 2022.
5. What are some drivers contributing to market growth?
Low-cost Trading Fee is Driving the Market; Increasing Popularity of Self-directed Investing.
6. What are the notable trends driving market growth?
Increase in Enterprise Market is Fuelling the Market.
7. Are there any restraints impacting market growth?
Low-cost Trading Fee is Driving the Market; Increasing Popularity of Self-directed Investing.
8. Can you provide examples of recent developments in the market?
September 2023: HDFC Securities launched the discount brokerage platform Sky. Through a single fintech platform, the app provides users with a wide range of trading and investment possibilities, including global equities, IPOs, Indian stocks, ETFs, mutual funds, futures and options, currencies, and commodities.
9. What pricing options are available for accessing the report?
Pricing options include single-user, multi-user, and enterprise licenses priced at USD 4750, USD 5250, and USD 8750 respectively.
10. Is the market size provided in terms of value or volume?
The market size is provided in terms of value, measured in Million and volume, measured in Billion.
11. Are there any specific market keywords associated with the report?
Yes, the market keyword associated with the report is "Discount Brokerage Market," which aids in identifying and referencing the specific market segment covered.
12. How do I determine which pricing option suits my needs best?
The pricing options vary based on user requirements and access needs. Individual users may opt for single-user licenses, while businesses requiring broader access may choose multi-user or enterprise licenses for cost-effective access to the report.
13. Are there any additional resources or data provided in the Discount Brokerage Market report?
While the report offers comprehensive insights, it's advisable to review the specific contents or supplementary materials provided to ascertain if additional resources or data are available.
14. How can I stay updated on further developments or reports in the Discount Brokerage Market?
To stay informed about further developments, trends, and reports in the Discount Brokerage Market, consider subscribing to industry newsletters, following relevant companies and organizations, or regularly checking reputable industry news sources and publications.
Methodology
Step 1 - Identification of Relevant Samples Size from Population Database


Step 2 - Approaches for Defining Global Market Size (Value, Volume* & Price*)

Note*: In applicable scenarios
Step 3 - Data Sources
Primary Research
- Web Analytics
- Survey Reports
- Research Institute
- Latest Research Reports
- Opinion Leaders
Secondary Research
- Annual Reports
- White Paper
- Latest Press Release
- Industry Association
- Paid Database
- Investor Presentations

Step 4 - Data Triangulation
Involves using different sources of information in order to increase the validity of a study
These sources are likely to be stakeholders in a program - participants, other researchers, program staff, other community members, and so on.
Then we put all data in single framework & apply various statistical tools to find out the dynamic on the market.
During the analysis stage, feedback from the stakeholder groups would be compared to determine areas of agreement as well as areas of divergence