
Key Insights
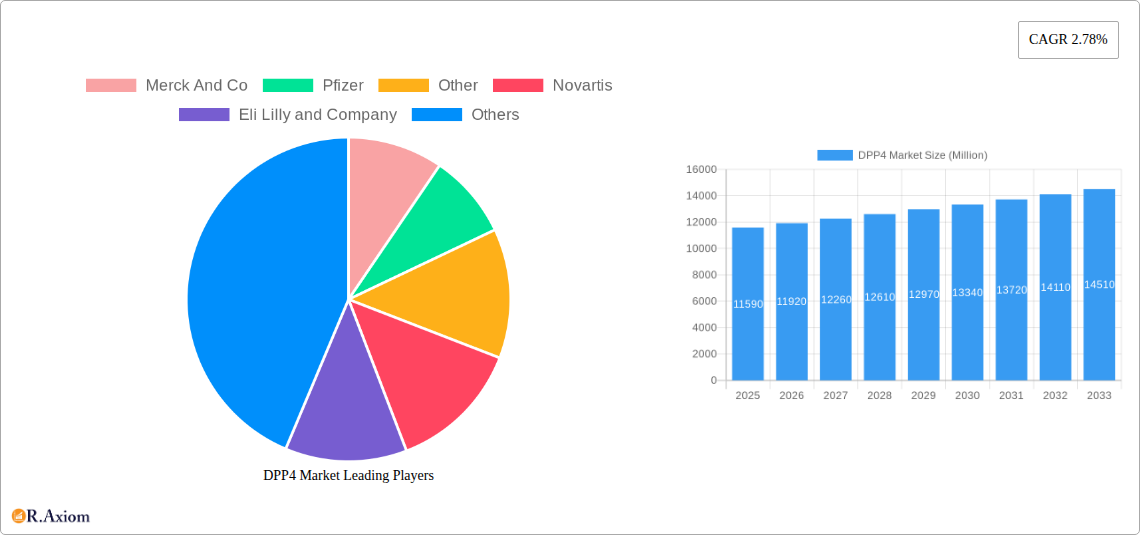
The global DPP4 inhibitor market, valued at $11.59 billion in 2025, is projected to experience steady growth, driven by the increasing prevalence of type 2 diabetes mellitus (T2DM) globally and a rising geriatric population. The market's Compound Annual Growth Rate (CAGR) of 2.78% from 2025 to 2033 reflects a consistent, albeit moderate, expansion. Key drivers include the efficacy and safety profile of DPP4 inhibitors in managing T2DM, along with their convenience of once-daily oral administration. However, the market faces certain restraints, primarily the emergence of newer, potentially more effective anti-diabetic medications, such as SGLT2 inhibitors and GLP-1 receptor agonists, which offer broader cardiovascular benefits. Furthermore, the cost of these treatments and potential side effects, such as upper respiratory tract infections, can limit market penetration. Segment analysis reveals Januvia (Sitagliptin), Onglyza (Saxagliptin), Tradjenta (Linagliptin), Vipidia (Alogliptin), and Galvus (Vildagliptin) as leading drugs driving market growth. The competitive landscape is dominated by major pharmaceutical companies including Merck & Co, Pfizer, Novartis, Eli Lilly and Company, AstraZeneca, Takeda Pharmaceuticals, Bristol Myers Squibb, Boehringer Ingelheim, and GlaxoSmithKline, each vying for market share through research and development efforts and strategic partnerships.
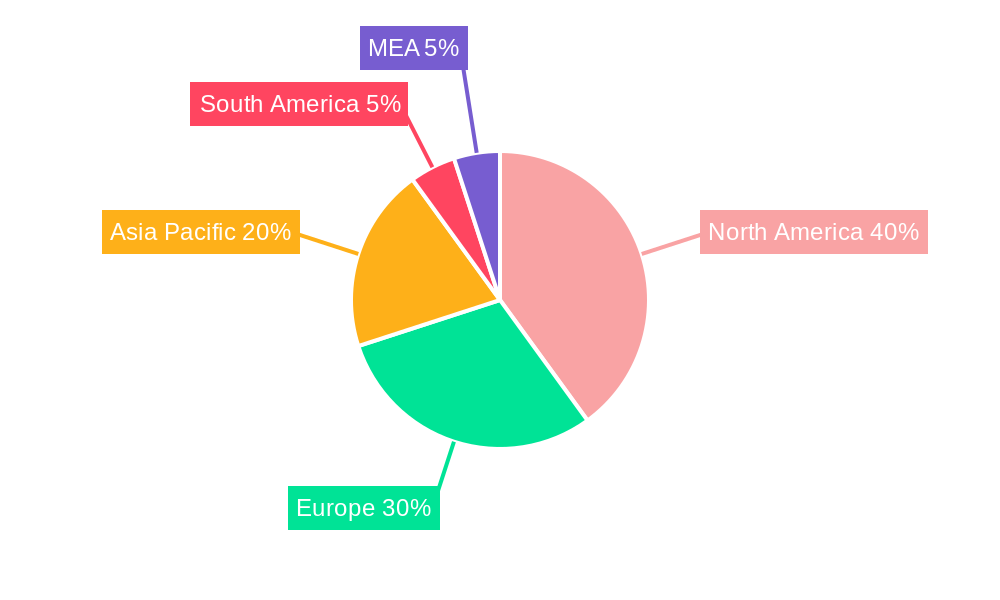
Regional market performance reveals a significant contribution from North America and Europe, driven by high healthcare expenditure and established healthcare infrastructure. The Asia-Pacific region is expected to witness substantial growth, fueled by increasing diabetes prevalence and improved healthcare access. While South America and the Middle East & Africa exhibit promising potential, their market shares remain relatively lower due to factors such as limited access to healthcare and lower per capita income. Future market dynamics will be shaped by ongoing clinical trials evaluating new DPP4 inhibitors and their combinations with other anti-diabetic therapies, focusing on improved efficacy and reduced side effect profiles. The long-term outlook suggests that the DPP4 inhibitor market will remain a significant component of the diabetes treatment landscape, albeit with a moderate growth trajectory influenced by competition from emerging therapeutic options.
DPP4 Market: A Comprehensive Report (2019-2033)
This comprehensive report provides an in-depth analysis of the global DPP4 Market, offering invaluable insights for industry stakeholders, investors, and researchers. Covering the period from 2019 to 2033, with a base year of 2025 and a forecast period of 2025-2033, this report meticulously examines market dynamics, growth drivers, challenges, and opportunities. The report leverages extensive data analysis and expert insights to provide a 360-degree view of this crucial pharmaceutical market segment. Key segments analyzed include Januvia (Sitagliptin), Onglyza (Saxagliptin), Tradjenta (Linagliptin), Vipidia (Alogliptin), Galvus (Vildagliptin), and Others, with a focus on leading players such as Merck & Co, Pfizer, Novartis, Eli Lilly and Company, AstraZeneca, Takeda Pharmaceuticals, Bristol Myers Squibb, Boehringer Ingelheim, and GlaxoSmithKline.
DPP4 Market Concentration & Innovation
The DPP4 inhibitor market exhibits a moderately concentrated landscape, with a few major pharmaceutical companies holding significant market share. The market share of each company is constantly evolving due to new product launches, generic competition, and strategic alliances. For example, Merck & Co and Pfizer, historically major players, may experience shifts in their market share owing to the increasing introduction of biosimilars and the emergence of novel therapeutic approaches. We estimate Merck & Co's market share in 2025 to be around xx% and Pfizer's to be around xx%. Innovation is a key driver, with ongoing research focusing on improving drug efficacy, reducing side effects, and developing fixed-dose combinations. Regulatory frameworks, such as those concerning pricing and approvals, significantly impact market access and growth. The market faces competition from alternative diabetes treatments, such as insulin and SGLT2 inhibitors. Mergers and acquisitions (M&A) activities play a crucial role in shaping the competitive landscape. Recent years have witnessed several M&A deals in the pharmaceutical industry, though specific deal values for DPP4-focused acquisitions are not publicly available for every case in this report. However, we estimate that the total value of M&A deals in the DPP4 market during the historical period (2019-2024) to be around xx Million.
- Market Concentration: Moderate, with a few dominant players.
- Innovation Drivers: Improved efficacy, reduced side effects, fixed-dose combinations.
- Regulatory Impact: Significant influence on market access and pricing.
- Product Substitutes: Insulin, SGLT2 inhibitors.
- M&A Activity: Significant influence on market consolidation, total value approximately xx Million during 2019-2024.
DPP4 Market Industry Trends & Insights
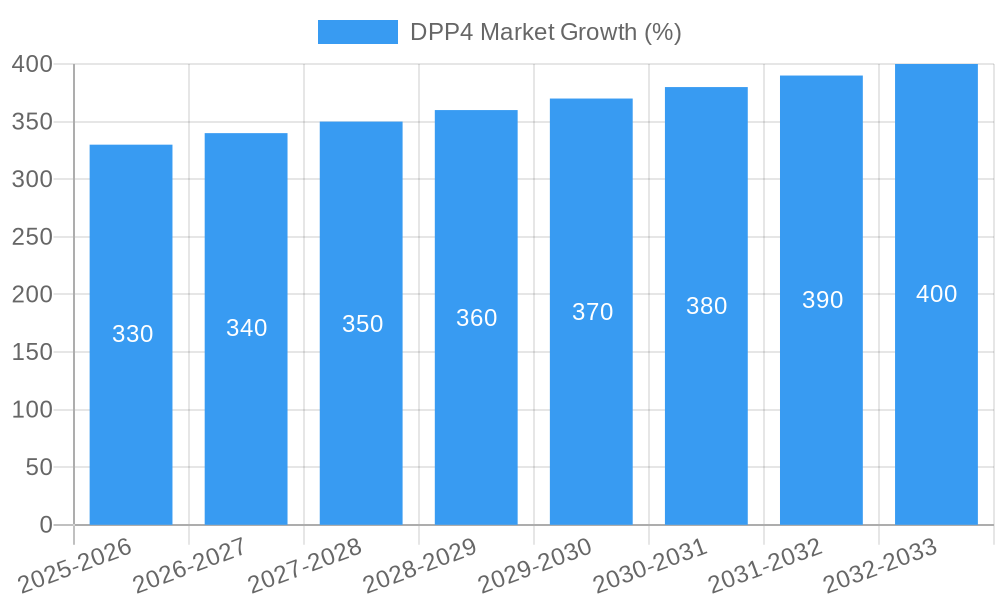
The global DPP4 market experienced significant growth during the historical period (2019-2024), driven by the rising prevalence of type 2 diabetes and an expanding elderly population. The market is expected to continue its growth trajectory during the forecast period (2025-2033), with a projected Compound Annual Growth Rate (CAGR) of xx%. Technological advancements in drug delivery systems, such as improved formulations and combination therapies, are enhancing patient compliance and treatment outcomes. Consumer preferences are shifting towards convenient and effective treatments with minimal side effects, driving innovation in the DPP4 inhibitor market. The competitive landscape is dynamic, characterized by the launch of new drugs, generic competition, and strategic alliances among leading pharmaceutical companies. Market penetration of DPP4 inhibitors remains substantial in developed countries, and growing in emerging markets. However, pricing pressures and the entry of generic drugs pose challenges to market growth. The increasing awareness of diabetes and improved healthcare infrastructure contribute to market expansion, particularly in developing economies.
Dominant Markets & Segments in DPP4 Market
The North American market dominates the global DPP4 market, driven by high diabetes prevalence, robust healthcare infrastructure, and greater access to advanced treatments. The European market holds a significant share. However, the Asia-Pacific region is experiencing the fastest growth, fueled by increasing diabetes diagnoses and rising healthcare expenditure. Among the drug segments, Januvia (Sitagliptin) and Onglyza (Saxagliptin) hold substantial market shares, while the "Others" segment showcases growing potential from innovative DPP4 inhibitors.
- Key Drivers of North American Dominance: High diabetes prevalence, advanced healthcare infrastructure, high per capita healthcare spending.
- Key Drivers of Asia-Pacific Growth: Rapid rise in diabetes cases, improving healthcare access, increasing disposable incomes.
- Januvia (Sitagliptin) and Onglyza (Saxagliptin): Established market presence, strong brand recognition.
- Others Segment: Potential for growth with emerging novel DPP4 inhibitors.
DPP4 Market Product Developments
Recent advancements in DPP4 inhibitors include the development of fixed-dose combinations with other antidiabetic agents, improving treatment efficacy and convenience for patients. These combinations aim to simplify treatment regimens and optimize glycemic control. Technological advancements, such as novel drug delivery systems, improve patient compliance and minimize side effects. The focus is on developing products that better cater to the specific needs of various patient subpopulations, offering improved safety and efficacy profiles. Competition amongst manufacturers centers on efficacy, tolerability, and cost-effectiveness, influencing market acceptance.
Report Scope & Segmentation Analysis
This report segments the DPP4 market based on drug type: Januvia (Sitagliptin), Onglyza (Saxagliptin), Tradjenta (Linagliptin), Vipidia (Alogliptin), Galvus (Vildagliptin), and Others. Each segment's market size, growth projections, and competitive landscape are analyzed in detail. The "Others" segment incorporates newer and emerging DPP4 inhibitors entering the market. Growth projections for each segment vary depending on factors such as patent expiry, generic competition, and clinical efficacy. Competitive dynamics vary across segments, with some characterized by intense competition among established players and others showcasing opportunities for new entrants.
Key Drivers of DPP4 Market Growth
The growth of the DPP4 market is propelled by several key factors: the escalating prevalence of type 2 diabetes globally; the expanding geriatric population, which is more susceptible to diabetes; increasing healthcare expenditure; and continuous advancements in drug development leading to more effective and safer treatments. Favorable regulatory frameworks supporting the approval of novel drugs are also contributing to market expansion. Government initiatives aimed at raising diabetes awareness and improving healthcare infrastructure further augment market growth.
Challenges in the DPP4 Market Sector
The DPP4 market faces challenges including the rising costs of healthcare, increasing generic competition, stringent regulatory requirements impacting drug approvals and pricing, and potential side effects associated with some DPP4 inhibitors. Supply chain disruptions can affect the availability and affordability of medications. The development of newer anti-diabetic drugs also presents competition to established DPP4 inhibitors, affecting market shares. The overall impact of these challenges is estimated to reduce market growth by approximately xx% over the forecast period.
Emerging Opportunities in DPP4 Market
Emerging opportunities include the development of innovative drug delivery systems to enhance patient adherence, expansion into untapped markets in developing countries, exploration of combination therapies to improve treatment efficacy, and personalized medicine approaches targeting specific patient subpopulations. The discovery of novel DPP4 inhibitors with improved efficacy and safety profiles also presents a significant opportunity for market expansion. Focus on affordable and accessible treatments in low- and middle-income countries presents substantial potential.
Leading Players in the DPP4 Market Market
- Merck And Co
- Pfizer
- Other
- Novartis
- Eli Lilly and Company
- AstraZeneca
- Takeda Pharmaceuticals
- Bristol Myers Squibb
- Boehringer Ingelheim
- GlaxoSmithKline
Key Developments in DPP4 Market Industry
- July 2022: Glenmark Pharmaceuticals Limited launched sitagliptin and its Fixed Dose Combinations for adults with Type 2 diabetes in India, introducing 8 different combinations under the brand name SITAZIT at affordable prices. This significantly impacted market access and affordability in India.
- February 2023: The Indian government's NPPA fixed the retail prices of 74 medicines, including diabetes medications. The cost of one tablet of Dapagliflozin Sitagliptin and Metformin Hydrochloride (Extended-Release Tablet) was fixed at INR 27.75 (USD 0.34), influencing pricing strategies across the region.
Strategic Outlook for DPP4 Market Market
The future of the DPP4 market appears promising, driven by continued growth in diabetes prevalence, advancements in drug development, and expansion into emerging markets. Strategic partnerships, collaborations, and M&A activities will likely reshape the competitive landscape. Companies focusing on innovative formulations, combination therapies, and personalized medicine approaches are poised for success. Continued research into improving efficacy and reducing side effects will be crucial for maintaining market growth and competitiveness. The market’s overall trajectory indicates considerable potential for growth and expansion in the coming years.
DPP4 Market Segmentation
-
1. Drugs
- 1.1. Januvia (Sitagliptin)
- 1.2. Onglyza (Saxagliptin)
- 1.3. Tradjenta (Linagliptin)
- 1.4. Vipidia (Alogliptin)
- 1.5. Galvus (Vildagliptin)
- 1.6. Others
-
2. End-users
- 2.1. Hospitals
- 2.2. Clinics
- 2.3. Retail Pharmacies
-
3. Distribution Channel
- 3.1. Direct Sales
- 3.2. Indirect Sales
-
4. Region
- 4.1. North America
- 4.2. Europe
- 4.3. Asia-Pacific
- 4.4. Latin America
- 4.5. Middle East & Africa
DPP4 Market Segmentation By Geography
-
1. North America
- 1.1. United States
- 1.2. Canada
- 1.3. Rest of North America
-
2. Europe
- 2.1. France
- 2.2. Germany
- 2.3. Italy
- 2.4. Spain
- 2.5. United Kingdom
- 2.6. Russia
- 2.7. Rest of Europe
-
3. Latin America
- 3.1. Mexico
- 3.2. Brazil
- 3.3. Rest of Latin America
-
4. Asia Pacific
- 4.1. Japan
- 4.2. South Korea
- 4.3. China
- 4.4. India
- 4.5. Australia
- 4.6. Vietnam
- 4.7. Malaysia
- 4.8. Indonesia
- 4.9. Philippines
- 4.10. Thailand
- 4.11. Rest of Asia Pacific
-
5. Middle East and Africa
- 5.1. Saudi Arabia
- 5.2. Iran
- 5.3. Egypt
- 5.4. Oman
- 5.5. South Africa
- 5.6. Rest of Middle East and Africa
DPP4 Market REPORT HIGHLIGHTS
| Aspects | Details |
|---|---|
| Study Period | 2019-2033 |
| Base Year | 2024 |
| Estimated Year | 2025 |
| Forecast Period | 2025-2033 |
| Historical Period | 2019-2024 |
| Growth Rate | CAGR of 2.78% from 2019-2033 |
| Segmentation |
|
Table of Contents
- 1. Introduction
- 1.1. Research Scope
- 1.2. Market Segmentation
- 1.3. Research Methodology
- 1.4. Definitions and Assumptions
- 2. Executive Summary
- 2.1. Introduction
- 3. Market Dynamics
- 3.1. Introduction
- 3.2. Market Drivers
- 3.2.1. Increasing Prevalence of Respiratory Disease; Growing Demand for OTC Medications
- 3.3. Market Restrains
- 3.3.1. Governments and Regulatory Bodies Impose Strict Guidelines
- 3.4. Market Trends
- 3.4.1. The Tradjenta segment is expected to witness the highest CAGR in the dipeptide peptidase 4 (DDP-4) inhibitors market over the forecast period
- 4. Market Factor Analysis
- 4.1. Porters Five Forces
- 4.2. Supply/Value Chain
- 4.3. PESTEL analysis
- 4.4. Market Entropy
- 4.5. Patent/Trademark Analysis
- 5. Global DPP4 Market Analysis, Insights and Forecast, 2019-2031
- 5.1. Market Analysis, Insights and Forecast - by Drugs
- 5.1.1. Januvia (Sitagliptin)
- 5.1.2. Onglyza (Saxagliptin)
- 5.1.3. Tradjenta (Linagliptin)
- 5.1.4. Vipidia (Alogliptin)
- 5.1.5. Galvus (Vildagliptin)
- 5.1.6. Others
- 5.2. Market Analysis, Insights and Forecast - by End-users
- 5.2.1. Hospitals
- 5.2.2. Clinics
- 5.2.3. Retail Pharmacies
- 5.3. Market Analysis, Insights and Forecast - by Distribution Channel
- 5.3.1. Direct Sales
- 5.3.2. Indirect Sales
- 5.4. Market Analysis, Insights and Forecast - by Region
- 5.4.1. North America
- 5.4.2. Europe
- 5.4.3. Asia-Pacific
- 5.4.4. Latin America
- 5.4.5. Middle East & Africa
- 5.5. Market Analysis, Insights and Forecast - by Region
- 5.5.1. North America
- 5.5.2. Europe
- 5.5.3. Latin America
- 5.5.4. Asia Pacific
- 5.5.5. Middle East and Africa
- 5.1. Market Analysis, Insights and Forecast - by Drugs
- 6. North America DPP4 Market Analysis, Insights and Forecast, 2019-2031
- 6.1. Market Analysis, Insights and Forecast - by Drugs
- 6.1.1. Januvia (Sitagliptin)
- 6.1.2. Onglyza (Saxagliptin)
- 6.1.3. Tradjenta (Linagliptin)
- 6.1.4. Vipidia (Alogliptin)
- 6.1.5. Galvus (Vildagliptin)
- 6.1.6. Others
- 6.2. Market Analysis, Insights and Forecast - by End-users
- 6.2.1. Hospitals
- 6.2.2. Clinics
- 6.2.3. Retail Pharmacies
- 6.3. Market Analysis, Insights and Forecast - by Distribution Channel
- 6.3.1. Direct Sales
- 6.3.2. Indirect Sales
- 6.4. Market Analysis, Insights and Forecast - by Region
- 6.4.1. North America
- 6.4.2. Europe
- 6.4.3. Asia-Pacific
- 6.4.4. Latin America
- 6.4.5. Middle East & Africa
- 6.1. Market Analysis, Insights and Forecast - by Drugs
- 7. Europe DPP4 Market Analysis, Insights and Forecast, 2019-2031
- 7.1. Market Analysis, Insights and Forecast - by Drugs
- 7.1.1. Januvia (Sitagliptin)
- 7.1.2. Onglyza (Saxagliptin)
- 7.1.3. Tradjenta (Linagliptin)
- 7.1.4. Vipidia (Alogliptin)
- 7.1.5. Galvus (Vildagliptin)
- 7.1.6. Others
- 7.2. Market Analysis, Insights and Forecast - by End-users
- 7.2.1. Hospitals
- 7.2.2. Clinics
- 7.2.3. Retail Pharmacies
- 7.3. Market Analysis, Insights and Forecast - by Distribution Channel
- 7.3.1. Direct Sales
- 7.3.2. Indirect Sales
- 7.4. Market Analysis, Insights and Forecast - by Region
- 7.4.1. North America
- 7.4.2. Europe
- 7.4.3. Asia-Pacific
- 7.4.4. Latin America
- 7.4.5. Middle East & Africa
- 7.1. Market Analysis, Insights and Forecast - by Drugs
- 8. Latin America DPP4 Market Analysis, Insights and Forecast, 2019-2031
- 8.1. Market Analysis, Insights and Forecast - by Drugs
- 8.1.1. Januvia (Sitagliptin)
- 8.1.2. Onglyza (Saxagliptin)
- 8.1.3. Tradjenta (Linagliptin)
- 8.1.4. Vipidia (Alogliptin)
- 8.1.5. Galvus (Vildagliptin)
- 8.1.6. Others
- 8.2. Market Analysis, Insights and Forecast - by End-users
- 8.2.1. Hospitals
- 8.2.2. Clinics
- 8.2.3. Retail Pharmacies
- 8.3. Market Analysis, Insights and Forecast - by Distribution Channel
- 8.3.1. Direct Sales
- 8.3.2. Indirect Sales
- 8.4. Market Analysis, Insights and Forecast - by Region
- 8.4.1. North America
- 8.4.2. Europe
- 8.4.3. Asia-Pacific
- 8.4.4. Latin America
- 8.4.5. Middle East & Africa
- 8.1. Market Analysis, Insights and Forecast - by Drugs
- 9. Asia Pacific DPP4 Market Analysis, Insights and Forecast, 2019-2031
- 9.1. Market Analysis, Insights and Forecast - by Drugs
- 9.1.1. Januvia (Sitagliptin)
- 9.1.2. Onglyza (Saxagliptin)
- 9.1.3. Tradjenta (Linagliptin)
- 9.1.4. Vipidia (Alogliptin)
- 9.1.5. Galvus (Vildagliptin)
- 9.1.6. Others
- 9.2. Market Analysis, Insights and Forecast - by End-users
- 9.2.1. Hospitals
- 9.2.2. Clinics
- 9.2.3. Retail Pharmacies
- 9.3. Market Analysis, Insights and Forecast - by Distribution Channel
- 9.3.1. Direct Sales
- 9.3.2. Indirect Sales
- 9.4. Market Analysis, Insights and Forecast - by Region
- 9.4.1. North America
- 9.4.2. Europe
- 9.4.3. Asia-Pacific
- 9.4.4. Latin America
- 9.4.5. Middle East & Africa
- 9.1. Market Analysis, Insights and Forecast - by Drugs
- 10. Middle East and Africa DPP4 Market Analysis, Insights and Forecast, 2019-2031
- 10.1. Market Analysis, Insights and Forecast - by Drugs
- 10.1.1. Januvia (Sitagliptin)
- 10.1.2. Onglyza (Saxagliptin)
- 10.1.3. Tradjenta (Linagliptin)
- 10.1.4. Vipidia (Alogliptin)
- 10.1.5. Galvus (Vildagliptin)
- 10.1.6. Others
- 10.2. Market Analysis, Insights and Forecast - by End-users
- 10.2.1. Hospitals
- 10.2.2. Clinics
- 10.2.3. Retail Pharmacies
- 10.3. Market Analysis, Insights and Forecast - by Distribution Channel
- 10.3.1. Direct Sales
- 10.3.2. Indirect Sales
- 10.4. Market Analysis, Insights and Forecast - by Region
- 10.4.1. North America
- 10.4.2. Europe
- 10.4.3. Asia-Pacific
- 10.4.4. Latin America
- 10.4.5. Middle East & Africa
- 10.1. Market Analysis, Insights and Forecast - by Drugs
- 11. North America DPP4 Market Analysis, Insights and Forecast, 2019-2031
- 11.1. Market Analysis, Insights and Forecast - By Country/Sub-region
- 11.1.1 United States
- 11.1.2 Canada
- 11.1.3 Mexico
- 12. Europe DPP4 Market Analysis, Insights and Forecast, 2019-2031
- 12.1. Market Analysis, Insights and Forecast - By Country/Sub-region
- 12.1.1 Germany
- 12.1.2 United Kingdom
- 12.1.3 France
- 12.1.4 Spain
- 12.1.5 Italy
- 12.1.6 Spain
- 12.1.7 Belgium
- 12.1.8 Netherland
- 12.1.9 Nordics
- 12.1.10 Rest of Europe
- 13. Asia Pacific DPP4 Market Analysis, Insights and Forecast, 2019-2031
- 13.1. Market Analysis, Insights and Forecast - By Country/Sub-region
- 13.1.1 China
- 13.1.2 Japan
- 13.1.3 India
- 13.1.4 South Korea
- 13.1.5 Southeast Asia
- 13.1.6 Australia
- 13.1.7 Indonesia
- 13.1.8 Phillipes
- 13.1.9 Singapore
- 13.1.10 Thailandc
- 13.1.11 Rest of Asia Pacific
- 14. South America DPP4 Market Analysis, Insights and Forecast, 2019-2031
- 14.1. Market Analysis, Insights and Forecast - By Country/Sub-region
- 14.1.1 Brazil
- 14.1.2 Argentina
- 14.1.3 Peru
- 14.1.4 Chile
- 14.1.5 Colombia
- 14.1.6 Ecuador
- 14.1.7 Venezuela
- 14.1.8 Rest of South America
- 15. North America DPP4 Market Analysis, Insights and Forecast, 2019-2031
- 15.1. Market Analysis, Insights and Forecast - By Country/Sub-region
- 15.1.1 United States
- 15.1.2 Canada
- 15.1.3 Mexico
- 16. MEA DPP4 Market Analysis, Insights and Forecast, 2019-2031
- 16.1. Market Analysis, Insights and Forecast - By Country/Sub-region
- 16.1.1 United Arab Emirates
- 16.1.2 Saudi Arabia
- 16.1.3 South Africa
- 16.1.4 Rest of Middle East and Africa
- 17. Competitive Analysis
- 17.1. Global Market Share Analysis 2024
- 17.2. Company Profiles
- 17.2.1 Merck And Co
- 17.2.1.1. Overview
- 17.2.1.2. Products
- 17.2.1.3. SWOT Analysis
- 17.2.1.4. Recent Developments
- 17.2.1.5. Financials (Based on Availability)
- 17.2.2 Pfizer
- 17.2.2.1. Overview
- 17.2.2.2. Products
- 17.2.2.3. SWOT Analysis
- 17.2.2.4. Recent Developments
- 17.2.2.5. Financials (Based on Availability)
- 17.2.3 Other
- 17.2.3.1. Overview
- 17.2.3.2. Products
- 17.2.3.3. SWOT Analysis
- 17.2.3.4. Recent Developments
- 17.2.3.5. Financials (Based on Availability)
- 17.2.4 Novartis
- 17.2.4.1. Overview
- 17.2.4.2. Products
- 17.2.4.3. SWOT Analysis
- 17.2.4.4. Recent Developments
- 17.2.4.5. Financials (Based on Availability)
- 17.2.5 Eli Lilly and Company
- 17.2.5.1. Overview
- 17.2.5.2. Products
- 17.2.5.3. SWOT Analysis
- 17.2.5.4. Recent Developments
- 17.2.5.5. Financials (Based on Availability)
- 17.2.6 AstraZeneca
- 17.2.6.1. Overview
- 17.2.6.2. Products
- 17.2.6.3. SWOT Analysis
- 17.2.6.4. Recent Developments
- 17.2.6.5. Financials (Based on Availability)
- 17.2.7 Takeda Pharmaceuticals
- 17.2.7.1. Overview
- 17.2.7.2. Products
- 17.2.7.3. SWOT Analysis
- 17.2.7.4. Recent Developments
- 17.2.7.5. Financials (Based on Availability)
- 17.2.8 Bristol Myers Squibb
- 17.2.8.1. Overview
- 17.2.8.2. Products
- 17.2.8.3. SWOT Analysis
- 17.2.8.4. Recent Developments
- 17.2.8.5. Financials (Based on Availability)
- 17.2.9 Boehringer Ingelheim
- 17.2.9.1. Overview
- 17.2.9.2. Products
- 17.2.9.3. SWOT Analysis
- 17.2.9.4. Recent Developments
- 17.2.9.5. Financials (Based on Availability)
- 17.2.10 GlaxoSmithKline
- 17.2.10.1. Overview
- 17.2.10.2. Products
- 17.2.10.3. SWOT Analysis
- 17.2.10.4. Recent Developments
- 17.2.10.5. Financials (Based on Availability)
- 17.2.1 Merck And Co
List of Figures
- Figure 1: Global DPP4 Market Revenue Breakdown (Million, %) by Region 2024 & 2032
- Figure 2: Global DPP4 Market Volume Breakdown (K Unit, %) by Region 2024 & 2032
- Figure 3: North America DPP4 Market Revenue (Million), by Country 2024 & 2032
- Figure 4: North America DPP4 Market Volume (K Unit), by Country 2024 & 2032
- Figure 5: North America DPP4 Market Revenue Share (%), by Country 2024 & 2032
- Figure 6: North America DPP4 Market Volume Share (%), by Country 2024 & 2032
- Figure 7: Europe DPP4 Market Revenue (Million), by Country 2024 & 2032
- Figure 8: Europe DPP4 Market Volume (K Unit), by Country 2024 & 2032
- Figure 9: Europe DPP4 Market Revenue Share (%), by Country 2024 & 2032
- Figure 10: Europe DPP4 Market Volume Share (%), by Country 2024 & 2032
- Figure 11: Asia Pacific DPP4 Market Revenue (Million), by Country 2024 & 2032
- Figure 12: Asia Pacific DPP4 Market Volume (K Unit), by Country 2024 & 2032
- Figure 13: Asia Pacific DPP4 Market Revenue Share (%), by Country 2024 & 2032
- Figure 14: Asia Pacific DPP4 Market Volume Share (%), by Country 2024 & 2032
- Figure 15: South America DPP4 Market Revenue (Million), by Country 2024 & 2032
- Figure 16: South America DPP4 Market Volume (K Unit), by Country 2024 & 2032
- Figure 17: South America DPP4 Market Revenue Share (%), by Country 2024 & 2032
- Figure 18: South America DPP4 Market Volume Share (%), by Country 2024 & 2032
- Figure 19: North America DPP4 Market Revenue (Million), by Country 2024 & 2032
- Figure 20: North America DPP4 Market Volume (K Unit), by Country 2024 & 2032
- Figure 21: North America DPP4 Market Revenue Share (%), by Country 2024 & 2032
- Figure 22: North America DPP4 Market Volume Share (%), by Country 2024 & 2032
- Figure 23: MEA DPP4 Market Revenue (Million), by Country 2024 & 2032
- Figure 24: MEA DPP4 Market Volume (K Unit), by Country 2024 & 2032
- Figure 25: MEA DPP4 Market Revenue Share (%), by Country 2024 & 2032
- Figure 26: MEA DPP4 Market Volume Share (%), by Country 2024 & 2032
- Figure 27: North America DPP4 Market Revenue (Million), by Drugs 2024 & 2032
- Figure 28: North America DPP4 Market Volume (K Unit), by Drugs 2024 & 2032
- Figure 29: North America DPP4 Market Revenue Share (%), by Drugs 2024 & 2032
- Figure 30: North America DPP4 Market Volume Share (%), by Drugs 2024 & 2032
- Figure 31: North America DPP4 Market Revenue (Million), by End-users 2024 & 2032
- Figure 32: North America DPP4 Market Volume (K Unit), by End-users 2024 & 2032
- Figure 33: North America DPP4 Market Revenue Share (%), by End-users 2024 & 2032
- Figure 34: North America DPP4 Market Volume Share (%), by End-users 2024 & 2032
- Figure 35: North America DPP4 Market Revenue (Million), by Distribution Channel 2024 & 2032
- Figure 36: North America DPP4 Market Volume (K Unit), by Distribution Channel 2024 & 2032
- Figure 37: North America DPP4 Market Revenue Share (%), by Distribution Channel 2024 & 2032
- Figure 38: North America DPP4 Market Volume Share (%), by Distribution Channel 2024 & 2032
- Figure 39: North America DPP4 Market Revenue (Million), by Region 2024 & 2032
- Figure 40: North America DPP4 Market Volume (K Unit), by Region 2024 & 2032
- Figure 41: North America DPP4 Market Revenue Share (%), by Region 2024 & 2032
- Figure 42: North America DPP4 Market Volume Share (%), by Region 2024 & 2032
- Figure 43: North America DPP4 Market Revenue (Million), by Country 2024 & 2032
- Figure 44: North America DPP4 Market Volume (K Unit), by Country 2024 & 2032
- Figure 45: North America DPP4 Market Revenue Share (%), by Country 2024 & 2032
- Figure 46: North America DPP4 Market Volume Share (%), by Country 2024 & 2032
- Figure 47: Europe DPP4 Market Revenue (Million), by Drugs 2024 & 2032
- Figure 48: Europe DPP4 Market Volume (K Unit), by Drugs 2024 & 2032
- Figure 49: Europe DPP4 Market Revenue Share (%), by Drugs 2024 & 2032
- Figure 50: Europe DPP4 Market Volume Share (%), by Drugs 2024 & 2032
- Figure 51: Europe DPP4 Market Revenue (Million), by End-users 2024 & 2032
- Figure 52: Europe DPP4 Market Volume (K Unit), by End-users 2024 & 2032
- Figure 53: Europe DPP4 Market Revenue Share (%), by End-users 2024 & 2032
- Figure 54: Europe DPP4 Market Volume Share (%), by End-users 2024 & 2032
- Figure 55: Europe DPP4 Market Revenue (Million), by Distribution Channel 2024 & 2032
- Figure 56: Europe DPP4 Market Volume (K Unit), by Distribution Channel 2024 & 2032
- Figure 57: Europe DPP4 Market Revenue Share (%), by Distribution Channel 2024 & 2032
- Figure 58: Europe DPP4 Market Volume Share (%), by Distribution Channel 2024 & 2032
- Figure 59: Europe DPP4 Market Revenue (Million), by Region 2024 & 2032
- Figure 60: Europe DPP4 Market Volume (K Unit), by Region 2024 & 2032
- Figure 61: Europe DPP4 Market Revenue Share (%), by Region 2024 & 2032
- Figure 62: Europe DPP4 Market Volume Share (%), by Region 2024 & 2032
- Figure 63: Europe DPP4 Market Revenue (Million), by Country 2024 & 2032
- Figure 64: Europe DPP4 Market Volume (K Unit), by Country 2024 & 2032
- Figure 65: Europe DPP4 Market Revenue Share (%), by Country 2024 & 2032
- Figure 66: Europe DPP4 Market Volume Share (%), by Country 2024 & 2032
- Figure 67: Latin America DPP4 Market Revenue (Million), by Drugs 2024 & 2032
- Figure 68: Latin America DPP4 Market Volume (K Unit), by Drugs 2024 & 2032
- Figure 69: Latin America DPP4 Market Revenue Share (%), by Drugs 2024 & 2032
- Figure 70: Latin America DPP4 Market Volume Share (%), by Drugs 2024 & 2032
- Figure 71: Latin America DPP4 Market Revenue (Million), by End-users 2024 & 2032
- Figure 72: Latin America DPP4 Market Volume (K Unit), by End-users 2024 & 2032
- Figure 73: Latin America DPP4 Market Revenue Share (%), by End-users 2024 & 2032
- Figure 74: Latin America DPP4 Market Volume Share (%), by End-users 2024 & 2032
- Figure 75: Latin America DPP4 Market Revenue (Million), by Distribution Channel 2024 & 2032
- Figure 76: Latin America DPP4 Market Volume (K Unit), by Distribution Channel 2024 & 2032
- Figure 77: Latin America DPP4 Market Revenue Share (%), by Distribution Channel 2024 & 2032
- Figure 78: Latin America DPP4 Market Volume Share (%), by Distribution Channel 2024 & 2032
- Figure 79: Latin America DPP4 Market Revenue (Million), by Region 2024 & 2032
- Figure 80: Latin America DPP4 Market Volume (K Unit), by Region 2024 & 2032
- Figure 81: Latin America DPP4 Market Revenue Share (%), by Region 2024 & 2032
- Figure 82: Latin America DPP4 Market Volume Share (%), by Region 2024 & 2032
- Figure 83: Latin America DPP4 Market Revenue (Million), by Country 2024 & 2032
- Figure 84: Latin America DPP4 Market Volume (K Unit), by Country 2024 & 2032
- Figure 85: Latin America DPP4 Market Revenue Share (%), by Country 2024 & 2032
- Figure 86: Latin America DPP4 Market Volume Share (%), by Country 2024 & 2032
- Figure 87: Asia Pacific DPP4 Market Revenue (Million), by Drugs 2024 & 2032
- Figure 88: Asia Pacific DPP4 Market Volume (K Unit), by Drugs 2024 & 2032
- Figure 89: Asia Pacific DPP4 Market Revenue Share (%), by Drugs 2024 & 2032
- Figure 90: Asia Pacific DPP4 Market Volume Share (%), by Drugs 2024 & 2032
- Figure 91: Asia Pacific DPP4 Market Revenue (Million), by End-users 2024 & 2032
- Figure 92: Asia Pacific DPP4 Market Volume (K Unit), by End-users 2024 & 2032
- Figure 93: Asia Pacific DPP4 Market Revenue Share (%), by End-users 2024 & 2032
- Figure 94: Asia Pacific DPP4 Market Volume Share (%), by End-users 2024 & 2032
- Figure 95: Asia Pacific DPP4 Market Revenue (Million), by Distribution Channel 2024 & 2032
- Figure 96: Asia Pacific DPP4 Market Volume (K Unit), by Distribution Channel 2024 & 2032
- Figure 97: Asia Pacific DPP4 Market Revenue Share (%), by Distribution Channel 2024 & 2032
- Figure 98: Asia Pacific DPP4 Market Volume Share (%), by Distribution Channel 2024 & 2032
- Figure 99: Asia Pacific DPP4 Market Revenue (Million), by Region 2024 & 2032
- Figure 100: Asia Pacific DPP4 Market Volume (K Unit), by Region 2024 & 2032
- Figure 101: Asia Pacific DPP4 Market Revenue Share (%), by Region 2024 & 2032
- Figure 102: Asia Pacific DPP4 Market Volume Share (%), by Region 2024 & 2032
- Figure 103: Asia Pacific DPP4 Market Revenue (Million), by Country 2024 & 2032
- Figure 104: Asia Pacific DPP4 Market Volume (K Unit), by Country 2024 & 2032
- Figure 105: Asia Pacific DPP4 Market Revenue Share (%), by Country 2024 & 2032
- Figure 106: Asia Pacific DPP4 Market Volume Share (%), by Country 2024 & 2032
- Figure 107: Middle East and Africa DPP4 Market Revenue (Million), by Drugs 2024 & 2032
- Figure 108: Middle East and Africa DPP4 Market Volume (K Unit), by Drugs 2024 & 2032
- Figure 109: Middle East and Africa DPP4 Market Revenue Share (%), by Drugs 2024 & 2032
- Figure 110: Middle East and Africa DPP4 Market Volume Share (%), by Drugs 2024 & 2032
- Figure 111: Middle East and Africa DPP4 Market Revenue (Million), by End-users 2024 & 2032
- Figure 112: Middle East and Africa DPP4 Market Volume (K Unit), by End-users 2024 & 2032
- Figure 113: Middle East and Africa DPP4 Market Revenue Share (%), by End-users 2024 & 2032
- Figure 114: Middle East and Africa DPP4 Market Volume Share (%), by End-users 2024 & 2032
- Figure 115: Middle East and Africa DPP4 Market Revenue (Million), by Distribution Channel 2024 & 2032
- Figure 116: Middle East and Africa DPP4 Market Volume (K Unit), by Distribution Channel 2024 & 2032
- Figure 117: Middle East and Africa DPP4 Market Revenue Share (%), by Distribution Channel 2024 & 2032
- Figure 118: Middle East and Africa DPP4 Market Volume Share (%), by Distribution Channel 2024 & 2032
- Figure 119: Middle East and Africa DPP4 Market Revenue (Million), by Region 2024 & 2032
- Figure 120: Middle East and Africa DPP4 Market Volume (K Unit), by Region 2024 & 2032
- Figure 121: Middle East and Africa DPP4 Market Revenue Share (%), by Region 2024 & 2032
- Figure 122: Middle East and Africa DPP4 Market Volume Share (%), by Region 2024 & 2032
- Figure 123: Middle East and Africa DPP4 Market Revenue (Million), by Country 2024 & 2032
- Figure 124: Middle East and Africa DPP4 Market Volume (K Unit), by Country 2024 & 2032
- Figure 125: Middle East and Africa DPP4 Market Revenue Share (%), by Country 2024 & 2032
- Figure 126: Middle East and Africa DPP4 Market Volume Share (%), by Country 2024 & 2032
List of Tables
- Table 1: Global DPP4 Market Revenue Million Forecast, by Region 2019 & 2032
- Table 2: Global DPP4 Market Volume K Unit Forecast, by Region 2019 & 2032
- Table 3: Global DPP4 Market Revenue Million Forecast, by Drugs 2019 & 2032
- Table 4: Global DPP4 Market Volume K Unit Forecast, by Drugs 2019 & 2032
- Table 5: Global DPP4 Market Revenue Million Forecast, by End-users 2019 & 2032
- Table 6: Global DPP4 Market Volume K Unit Forecast, by End-users 2019 & 2032
- Table 7: Global DPP4 Market Revenue Million Forecast, by Distribution Channel 2019 & 2032
- Table 8: Global DPP4 Market Volume K Unit Forecast, by Distribution Channel 2019 & 2032
- Table 9: Global DPP4 Market Revenue Million Forecast, by Region 2019 & 2032
- Table 10: Global DPP4 Market Volume K Unit Forecast, by Region 2019 & 2032
- Table 11: Global DPP4 Market Revenue Million Forecast, by Region 2019 & 2032
- Table 12: Global DPP4 Market Volume K Unit Forecast, by Region 2019 & 2032
- Table 13: Global DPP4 Market Revenue Million Forecast, by Country 2019 & 2032
- Table 14: Global DPP4 Market Volume K Unit Forecast, by Country 2019 & 2032
- Table 15: United States DPP4 Market Revenue (Million) Forecast, by Application 2019 & 2032
- Table 16: United States DPP4 Market Volume (K Unit) Forecast, by Application 2019 & 2032
- Table 17: Canada DPP4 Market Revenue (Million) Forecast, by Application 2019 & 2032
- Table 18: Canada DPP4 Market Volume (K Unit) Forecast, by Application 2019 & 2032
- Table 19: Mexico DPP4 Market Revenue (Million) Forecast, by Application 2019 & 2032
- Table 20: Mexico DPP4 Market Volume (K Unit) Forecast, by Application 2019 & 2032
- Table 21: Global DPP4 Market Revenue Million Forecast, by Country 2019 & 2032
- Table 22: Global DPP4 Market Volume K Unit Forecast, by Country 2019 & 2032
- Table 23: Germany DPP4 Market Revenue (Million) Forecast, by Application 2019 & 2032
- Table 24: Germany DPP4 Market Volume (K Unit) Forecast, by Application 2019 & 2032
- Table 25: United Kingdom DPP4 Market Revenue (Million) Forecast, by Application 2019 & 2032
- Table 26: United Kingdom DPP4 Market Volume (K Unit) Forecast, by Application 2019 & 2032
- Table 27: France DPP4 Market Revenue (Million) Forecast, by Application 2019 & 2032
- Table 28: France DPP4 Market Volume (K Unit) Forecast, by Application 2019 & 2032
- Table 29: Spain DPP4 Market Revenue (Million) Forecast, by Application 2019 & 2032
- Table 30: Spain DPP4 Market Volume (K Unit) Forecast, by Application 2019 & 2032
- Table 31: Italy DPP4 Market Revenue (Million) Forecast, by Application 2019 & 2032
- Table 32: Italy DPP4 Market Volume (K Unit) Forecast, by Application 2019 & 2032
- Table 33: Spain DPP4 Market Revenue (Million) Forecast, by Application 2019 & 2032
- Table 34: Spain DPP4 Market Volume (K Unit) Forecast, by Application 2019 & 2032
- Table 35: Belgium DPP4 Market Revenue (Million) Forecast, by Application 2019 & 2032
- Table 36: Belgium DPP4 Market Volume (K Unit) Forecast, by Application 2019 & 2032
- Table 37: Netherland DPP4 Market Revenue (Million) Forecast, by Application 2019 & 2032
- Table 38: Netherland DPP4 Market Volume (K Unit) Forecast, by Application 2019 & 2032
- Table 39: Nordics DPP4 Market Revenue (Million) Forecast, by Application 2019 & 2032
- Table 40: Nordics DPP4 Market Volume (K Unit) Forecast, by Application 2019 & 2032
- Table 41: Rest of Europe DPP4 Market Revenue (Million) Forecast, by Application 2019 & 2032
- Table 42: Rest of Europe DPP4 Market Volume (K Unit) Forecast, by Application 2019 & 2032
- Table 43: Global DPP4 Market Revenue Million Forecast, by Country 2019 & 2032
- Table 44: Global DPP4 Market Volume K Unit Forecast, by Country 2019 & 2032
- Table 45: China DPP4 Market Revenue (Million) Forecast, by Application 2019 & 2032
- Table 46: China DPP4 Market Volume (K Unit) Forecast, by Application 2019 & 2032
- Table 47: Japan DPP4 Market Revenue (Million) Forecast, by Application 2019 & 2032
- Table 48: Japan DPP4 Market Volume (K Unit) Forecast, by Application 2019 & 2032
- Table 49: India DPP4 Market Revenue (Million) Forecast, by Application 2019 & 2032
- Table 50: India DPP4 Market Volume (K Unit) Forecast, by Application 2019 & 2032
- Table 51: South Korea DPP4 Market Revenue (Million) Forecast, by Application 2019 & 2032
- Table 52: South Korea DPP4 Market Volume (K Unit) Forecast, by Application 2019 & 2032
- Table 53: Southeast Asia DPP4 Market Revenue (Million) Forecast, by Application 2019 & 2032
- Table 54: Southeast Asia DPP4 Market Volume (K Unit) Forecast, by Application 2019 & 2032
- Table 55: Australia DPP4 Market Revenue (Million) Forecast, by Application 2019 & 2032
- Table 56: Australia DPP4 Market Volume (K Unit) Forecast, by Application 2019 & 2032
- Table 57: Indonesia DPP4 Market Revenue (Million) Forecast, by Application 2019 & 2032
- Table 58: Indonesia DPP4 Market Volume (K Unit) Forecast, by Application 2019 & 2032
- Table 59: Phillipes DPP4 Market Revenue (Million) Forecast, by Application 2019 & 2032
- Table 60: Phillipes DPP4 Market Volume (K Unit) Forecast, by Application 2019 & 2032
- Table 61: Singapore DPP4 Market Revenue (Million) Forecast, by Application 2019 & 2032
- Table 62: Singapore DPP4 Market Volume (K Unit) Forecast, by Application 2019 & 2032
- Table 63: Thailandc DPP4 Market Revenue (Million) Forecast, by Application 2019 & 2032
- Table 64: Thailandc DPP4 Market Volume (K Unit) Forecast, by Application 2019 & 2032
- Table 65: Rest of Asia Pacific DPP4 Market Revenue (Million) Forecast, by Application 2019 & 2032
- Table 66: Rest of Asia Pacific DPP4 Market Volume (K Unit) Forecast, by Application 2019 & 2032
- Table 67: Global DPP4 Market Revenue Million Forecast, by Country 2019 & 2032
- Table 68: Global DPP4 Market Volume K Unit Forecast, by Country 2019 & 2032
- Table 69: Brazil DPP4 Market Revenue (Million) Forecast, by Application 2019 & 2032
- Table 70: Brazil DPP4 Market Volume (K Unit) Forecast, by Application 2019 & 2032
- Table 71: Argentina DPP4 Market Revenue (Million) Forecast, by Application 2019 & 2032
- Table 72: Argentina DPP4 Market Volume (K Unit) Forecast, by Application 2019 & 2032
- Table 73: Peru DPP4 Market Revenue (Million) Forecast, by Application 2019 & 2032
- Table 74: Peru DPP4 Market Volume (K Unit) Forecast, by Application 2019 & 2032
- Table 75: Chile DPP4 Market Revenue (Million) Forecast, by Application 2019 & 2032
- Table 76: Chile DPP4 Market Volume (K Unit) Forecast, by Application 2019 & 2032
- Table 77: Colombia DPP4 Market Revenue (Million) Forecast, by Application 2019 & 2032
- Table 78: Colombia DPP4 Market Volume (K Unit) Forecast, by Application 2019 & 2032
- Table 79: Ecuador DPP4 Market Revenue (Million) Forecast, by Application 2019 & 2032
- Table 80: Ecuador DPP4 Market Volume (K Unit) Forecast, by Application 2019 & 2032
- Table 81: Venezuela DPP4 Market Revenue (Million) Forecast, by Application 2019 & 2032
- Table 82: Venezuela DPP4 Market Volume (K Unit) Forecast, by Application 2019 & 2032
- Table 83: Rest of South America DPP4 Market Revenue (Million) Forecast, by Application 2019 & 2032
- Table 84: Rest of South America DPP4 Market Volume (K Unit) Forecast, by Application 2019 & 2032
- Table 85: Global DPP4 Market Revenue Million Forecast, by Country 2019 & 2032
- Table 86: Global DPP4 Market Volume K Unit Forecast, by Country 2019 & 2032
- Table 87: United States DPP4 Market Revenue (Million) Forecast, by Application 2019 & 2032
- Table 88: United States DPP4 Market Volume (K Unit) Forecast, by Application 2019 & 2032
- Table 89: Canada DPP4 Market Revenue (Million) Forecast, by Application 2019 & 2032
- Table 90: Canada DPP4 Market Volume (K Unit) Forecast, by Application 2019 & 2032
- Table 91: Mexico DPP4 Market Revenue (Million) Forecast, by Application 2019 & 2032
- Table 92: Mexico DPP4 Market Volume (K Unit) Forecast, by Application 2019 & 2032
- Table 93: Global DPP4 Market Revenue Million Forecast, by Country 2019 & 2032
- Table 94: Global DPP4 Market Volume K Unit Forecast, by Country 2019 & 2032
- Table 95: United Arab Emirates DPP4 Market Revenue (Million) Forecast, by Application 2019 & 2032
- Table 96: United Arab Emirates DPP4 Market Volume (K Unit) Forecast, by Application 2019 & 2032
- Table 97: Saudi Arabia DPP4 Market Revenue (Million) Forecast, by Application 2019 & 2032
- Table 98: Saudi Arabia DPP4 Market Volume (K Unit) Forecast, by Application 2019 & 2032
- Table 99: South Africa DPP4 Market Revenue (Million) Forecast, by Application 2019 & 2032
- Table 100: South Africa DPP4 Market Volume (K Unit) Forecast, by Application 2019 & 2032
- Table 101: Rest of Middle East and Africa DPP4 Market Revenue (Million) Forecast, by Application 2019 & 2032
- Table 102: Rest of Middle East and Africa DPP4 Market Volume (K Unit) Forecast, by Application 2019 & 2032
- Table 103: Global DPP4 Market Revenue Million Forecast, by Drugs 2019 & 2032
- Table 104: Global DPP4 Market Volume K Unit Forecast, by Drugs 2019 & 2032
- Table 105: Global DPP4 Market Revenue Million Forecast, by End-users 2019 & 2032
- Table 106: Global DPP4 Market Volume K Unit Forecast, by End-users 2019 & 2032
- Table 107: Global DPP4 Market Revenue Million Forecast, by Distribution Channel 2019 & 2032
- Table 108: Global DPP4 Market Volume K Unit Forecast, by Distribution Channel 2019 & 2032
- Table 109: Global DPP4 Market Revenue Million Forecast, by Region 2019 & 2032
- Table 110: Global DPP4 Market Volume K Unit Forecast, by Region 2019 & 2032
- Table 111: Global DPP4 Market Revenue Million Forecast, by Country 2019 & 2032
- Table 112: Global DPP4 Market Volume K Unit Forecast, by Country 2019 & 2032
- Table 113: United States DPP4 Market Revenue (Million) Forecast, by Application 2019 & 2032
- Table 114: United States DPP4 Market Volume (K Unit) Forecast, by Application 2019 & 2032
- Table 115: Canada DPP4 Market Revenue (Million) Forecast, by Application 2019 & 2032
- Table 116: Canada DPP4 Market Volume (K Unit) Forecast, by Application 2019 & 2032
- Table 117: Rest of North America DPP4 Market Revenue (Million) Forecast, by Application 2019 & 2032
- Table 118: Rest of North America DPP4 Market Volume (K Unit) Forecast, by Application 2019 & 2032
- Table 119: Global DPP4 Market Revenue Million Forecast, by Drugs 2019 & 2032
- Table 120: Global DPP4 Market Volume K Unit Forecast, by Drugs 2019 & 2032
- Table 121: Global DPP4 Market Revenue Million Forecast, by End-users 2019 & 2032
- Table 122: Global DPP4 Market Volume K Unit Forecast, by End-users 2019 & 2032
- Table 123: Global DPP4 Market Revenue Million Forecast, by Distribution Channel 2019 & 2032
- Table 124: Global DPP4 Market Volume K Unit Forecast, by Distribution Channel 2019 & 2032
- Table 125: Global DPP4 Market Revenue Million Forecast, by Region 2019 & 2032
- Table 126: Global DPP4 Market Volume K Unit Forecast, by Region 2019 & 2032
- Table 127: Global DPP4 Market Revenue Million Forecast, by Country 2019 & 2032
- Table 128: Global DPP4 Market Volume K Unit Forecast, by Country 2019 & 2032
- Table 129: France DPP4 Market Revenue (Million) Forecast, by Application 2019 & 2032
- Table 130: France DPP4 Market Volume (K Unit) Forecast, by Application 2019 & 2032
- Table 131: Germany DPP4 Market Revenue (Million) Forecast, by Application 2019 & 2032
- Table 132: Germany DPP4 Market Volume (K Unit) Forecast, by Application 2019 & 2032
- Table 133: Italy DPP4 Market Revenue (Million) Forecast, by Application 2019 & 2032
- Table 134: Italy DPP4 Market Volume (K Unit) Forecast, by Application 2019 & 2032
- Table 135: Spain DPP4 Market Revenue (Million) Forecast, by Application 2019 & 2032
- Table 136: Spain DPP4 Market Volume (K Unit) Forecast, by Application 2019 & 2032
- Table 137: United Kingdom DPP4 Market Revenue (Million) Forecast, by Application 2019 & 2032
- Table 138: United Kingdom DPP4 Market Volume (K Unit) Forecast, by Application 2019 & 2032
- Table 139: Russia DPP4 Market Revenue (Million) Forecast, by Application 2019 & 2032
- Table 140: Russia DPP4 Market Volume (K Unit) Forecast, by Application 2019 & 2032
- Table 141: Rest of Europe DPP4 Market Revenue (Million) Forecast, by Application 2019 & 2032
- Table 142: Rest of Europe DPP4 Market Volume (K Unit) Forecast, by Application 2019 & 2032
- Table 143: Global DPP4 Market Revenue Million Forecast, by Drugs 2019 & 2032
- Table 144: Global DPP4 Market Volume K Unit Forecast, by Drugs 2019 & 2032
- Table 145: Global DPP4 Market Revenue Million Forecast, by End-users 2019 & 2032
- Table 146: Global DPP4 Market Volume K Unit Forecast, by End-users 2019 & 2032
- Table 147: Global DPP4 Market Revenue Million Forecast, by Distribution Channel 2019 & 2032
- Table 148: Global DPP4 Market Volume K Unit Forecast, by Distribution Channel 2019 & 2032
- Table 149: Global DPP4 Market Revenue Million Forecast, by Region 2019 & 2032
- Table 150: Global DPP4 Market Volume K Unit Forecast, by Region 2019 & 2032
- Table 151: Global DPP4 Market Revenue Million Forecast, by Country 2019 & 2032
- Table 152: Global DPP4 Market Volume K Unit Forecast, by Country 2019 & 2032
- Table 153: Mexico DPP4 Market Revenue (Million) Forecast, by Application 2019 & 2032
- Table 154: Mexico DPP4 Market Volume (K Unit) Forecast, by Application 2019 & 2032
- Table 155: Brazil DPP4 Market Revenue (Million) Forecast, by Application 2019 & 2032
- Table 156: Brazil DPP4 Market Volume (K Unit) Forecast, by Application 2019 & 2032
- Table 157: Rest of Latin America DPP4 Market Revenue (Million) Forecast, by Application 2019 & 2032
- Table 158: Rest of Latin America DPP4 Market Volume (K Unit) Forecast, by Application 2019 & 2032
- Table 159: Global DPP4 Market Revenue Million Forecast, by Drugs 2019 & 2032
- Table 160: Global DPP4 Market Volume K Unit Forecast, by Drugs 2019 & 2032
- Table 161: Global DPP4 Market Revenue Million Forecast, by End-users 2019 & 2032
- Table 162: Global DPP4 Market Volume K Unit Forecast, by End-users 2019 & 2032
- Table 163: Global DPP4 Market Revenue Million Forecast, by Distribution Channel 2019 & 2032
- Table 164: Global DPP4 Market Volume K Unit Forecast, by Distribution Channel 2019 & 2032
- Table 165: Global DPP4 Market Revenue Million Forecast, by Region 2019 & 2032
- Table 166: Global DPP4 Market Volume K Unit Forecast, by Region 2019 & 2032
- Table 167: Global DPP4 Market Revenue Million Forecast, by Country 2019 & 2032
- Table 168: Global DPP4 Market Volume K Unit Forecast, by Country 2019 & 2032
- Table 169: Japan DPP4 Market Revenue (Million) Forecast, by Application 2019 & 2032
- Table 170: Japan DPP4 Market Volume (K Unit) Forecast, by Application 2019 & 2032
- Table 171: South Korea DPP4 Market Revenue (Million) Forecast, by Application 2019 & 2032
- Table 172: South Korea DPP4 Market Volume (K Unit) Forecast, by Application 2019 & 2032
- Table 173: China DPP4 Market Revenue (Million) Forecast, by Application 2019 & 2032
- Table 174: China DPP4 Market Volume (K Unit) Forecast, by Application 2019 & 2032
- Table 175: India DPP4 Market Revenue (Million) Forecast, by Application 2019 & 2032
- Table 176: India DPP4 Market Volume (K Unit) Forecast, by Application 2019 & 2032
- Table 177: Australia DPP4 Market Revenue (Million) Forecast, by Application 2019 & 2032
- Table 178: Australia DPP4 Market Volume (K Unit) Forecast, by Application 2019 & 2032
- Table 179: Vietnam DPP4 Market Revenue (Million) Forecast, by Application 2019 & 2032
- Table 180: Vietnam DPP4 Market Volume (K Unit) Forecast, by Application 2019 & 2032
- Table 181: Malaysia DPP4 Market Revenue (Million) Forecast, by Application 2019 & 2032
- Table 182: Malaysia DPP4 Market Volume (K Unit) Forecast, by Application 2019 & 2032
- Table 183: Indonesia DPP4 Market Revenue (Million) Forecast, by Application 2019 & 2032
- Table 184: Indonesia DPP4 Market Volume (K Unit) Forecast, by Application 2019 & 2032
- Table 185: Philippines DPP4 Market Revenue (Million) Forecast, by Application 2019 & 2032
- Table 186: Philippines DPP4 Market Volume (K Unit) Forecast, by Application 2019 & 2032
- Table 187: Thailand DPP4 Market Revenue (Million) Forecast, by Application 2019 & 2032
- Table 188: Thailand DPP4 Market Volume (K Unit) Forecast, by Application 2019 & 2032
- Table 189: Rest of Asia Pacific DPP4 Market Revenue (Million) Forecast, by Application 2019 & 2032
- Table 190: Rest of Asia Pacific DPP4 Market Volume (K Unit) Forecast, by Application 2019 & 2032
- Table 191: Global DPP4 Market Revenue Million Forecast, by Drugs 2019 & 2032
- Table 192: Global DPP4 Market Volume K Unit Forecast, by Drugs 2019 & 2032
- Table 193: Global DPP4 Market Revenue Million Forecast, by End-users 2019 & 2032
- Table 194: Global DPP4 Market Volume K Unit Forecast, by End-users 2019 & 2032
- Table 195: Global DPP4 Market Revenue Million Forecast, by Distribution Channel 2019 & 2032
- Table 196: Global DPP4 Market Volume K Unit Forecast, by Distribution Channel 2019 & 2032
- Table 197: Global DPP4 Market Revenue Million Forecast, by Region 2019 & 2032
- Table 198: Global DPP4 Market Volume K Unit Forecast, by Region 2019 & 2032
- Table 199: Global DPP4 Market Revenue Million Forecast, by Country 2019 & 2032
- Table 200: Global DPP4 Market Volume K Unit Forecast, by Country 2019 & 2032
- Table 201: Saudi Arabia DPP4 Market Revenue (Million) Forecast, by Application 2019 & 2032
- Table 202: Saudi Arabia DPP4 Market Volume (K Unit) Forecast, by Application 2019 & 2032
- Table 203: Iran DPP4 Market Revenue (Million) Forecast, by Application 2019 & 2032
- Table 204: Iran DPP4 Market Volume (K Unit) Forecast, by Application 2019 & 2032
- Table 205: Egypt DPP4 Market Revenue (Million) Forecast, by Application 2019 & 2032
- Table 206: Egypt DPP4 Market Volume (K Unit) Forecast, by Application 2019 & 2032
- Table 207: Oman DPP4 Market Revenue (Million) Forecast, by Application 2019 & 2032
- Table 208: Oman DPP4 Market Volume (K Unit) Forecast, by Application 2019 & 2032
- Table 209: South Africa DPP4 Market Revenue (Million) Forecast, by Application 2019 & 2032
- Table 210: South Africa DPP4 Market Volume (K Unit) Forecast, by Application 2019 & 2032
- Table 211: Rest of Middle East and Africa DPP4 Market Revenue (Million) Forecast, by Application 2019 & 2032
- Table 212: Rest of Middle East and Africa DPP4 Market Volume (K Unit) Forecast, by Application 2019 & 2032
Frequently Asked Questions
1. What is the projected Compound Annual Growth Rate (CAGR) of the DPP4 Market?
The projected CAGR is approximately 2.78%.
2. Which companies are prominent players in the DPP4 Market?
Key companies in the market include Merck And Co, Pfizer, Other, Novartis, Eli Lilly and Company, AstraZeneca, Takeda Pharmaceuticals, Bristol Myers Squibb, Boehringer Ingelheim, GlaxoSmithKline.
3. What are the main segments of the DPP4 Market?
The market segments include Drugs, End-users , Distribution Channel, Region.
4. Can you provide details about the market size?
The market size is estimated to be USD 11.59 Million as of 2022.
5. What are some drivers contributing to market growth?
Increasing Prevalence of Respiratory Disease; Growing Demand for OTC Medications.
6. What are the notable trends driving market growth?
The Tradjenta segment is expected to witness the highest CAGR in the dipeptide peptidase 4 (DDP-4) inhibitors market over the forecast period.
7. Are there any restraints impacting market growth?
Governments and Regulatory Bodies Impose Strict Guidelines.
8. Can you provide examples of recent developments in the market?
February 2023: The Indian government's National Pharmaceutical Pricing Authority (NPPA) fixed the retail prices of 74 medicines, including diabetes, high blood pressure, etc. As per the notification by the NPPA, the cost of one tablet of Dapagliflozin Sitagliptin and Metformin Hydrochloride (Extended-Release Tablet) is fixed at INR 27.75 (USD 0.34).
9. What pricing options are available for accessing the report?
Pricing options include single-user, multi-user, and enterprise licenses priced at USD 4750, USD 5250, and USD 8750 respectively.
10. Is the market size provided in terms of value or volume?
The market size is provided in terms of value, measured in Million and volume, measured in K Unit.
11. Are there any specific market keywords associated with the report?
Yes, the market keyword associated with the report is "DPP4 Market," which aids in identifying and referencing the specific market segment covered.
12. How do I determine which pricing option suits my needs best?
The pricing options vary based on user requirements and access needs. Individual users may opt for single-user licenses, while businesses requiring broader access may choose multi-user or enterprise licenses for cost-effective access to the report.
13. Are there any additional resources or data provided in the DPP4 Market report?
While the report offers comprehensive insights, it's advisable to review the specific contents or supplementary materials provided to ascertain if additional resources or data are available.
14. How can I stay updated on further developments or reports in the DPP4 Market?
To stay informed about further developments, trends, and reports in the DPP4 Market, consider subscribing to industry newsletters, following relevant companies and organizations, or regularly checking reputable industry news sources and publications.
Methodology
Step 1 - Identification of Relevant Samples Size from Population Database


Step 2 - Approaches for Defining Global Market Size (Value, Volume* & Price*)

Note*: In applicable scenarios
Step 3 - Data Sources
Primary Research
- Web Analytics
- Survey Reports
- Research Institute
- Latest Research Reports
- Opinion Leaders
Secondary Research
- Annual Reports
- White Paper
- Latest Press Release
- Industry Association
- Paid Database
- Investor Presentations

Step 4 - Data Triangulation
Involves using different sources of information in order to increase the validity of a study
These sources are likely to be stakeholders in a program - participants, other researchers, program staff, other community members, and so on.
Then we put all data in single framework & apply various statistical tools to find out the dynamic on the market.
During the analysis stage, feedback from the stakeholder groups would be compared to determine areas of agreement as well as areas of divergence


