

Key Insights
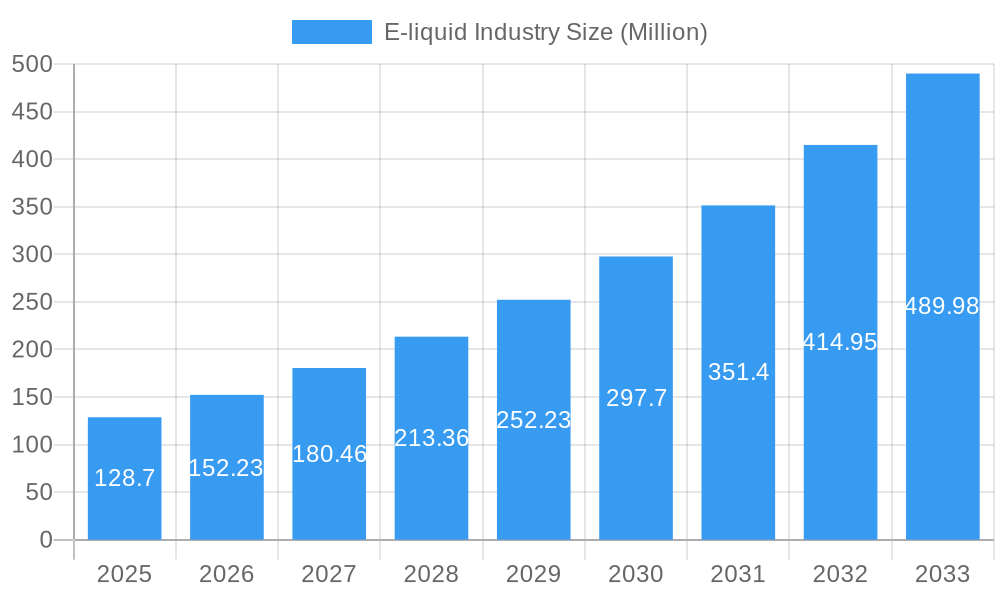
The e-liquid industry, valued at $128.70 million in 2025, is projected to experience robust growth, exhibiting a Compound Annual Growth Rate (CAGR) of 18.20% from 2025 to 2033. This expansion is driven by several factors. Increasing popularity of vaping as an alternative to traditional smoking, coupled with continuous innovation in e-cigarette and e-liquid device technology, fuels market demand. The diversification of e-liquid flavors and nicotine strengths caters to a wide range of consumer preferences, further bolstering growth. The rise of online sales channels provides convenient access to a global customer base, contributing significantly to market expansion. However, the industry faces challenges, including stringent regulations on vaping products in various regions and growing concerns about the potential long-term health effects of e-cigarette use. These regulatory hurdles and health concerns represent key restraints to market growth, particularly in regions with proactive public health policies. The market is segmented by product type (e-cigarette devices and e-liquid devices) and distribution channel (offline and online). Leading companies like RITCHY GROUP, Innokin Technology, and Philip Morris International are actively involved in shaping the market landscape through product development and strategic partnerships. Geographic distribution shows strong performance in North America and Europe, with Asia-Pacific demonstrating significant growth potential due to its large population and rising vaping adoption rates. Future growth will depend on navigating regulatory landscapes, addressing public health concerns, and continuing to innovate in product offerings and marketing strategies.
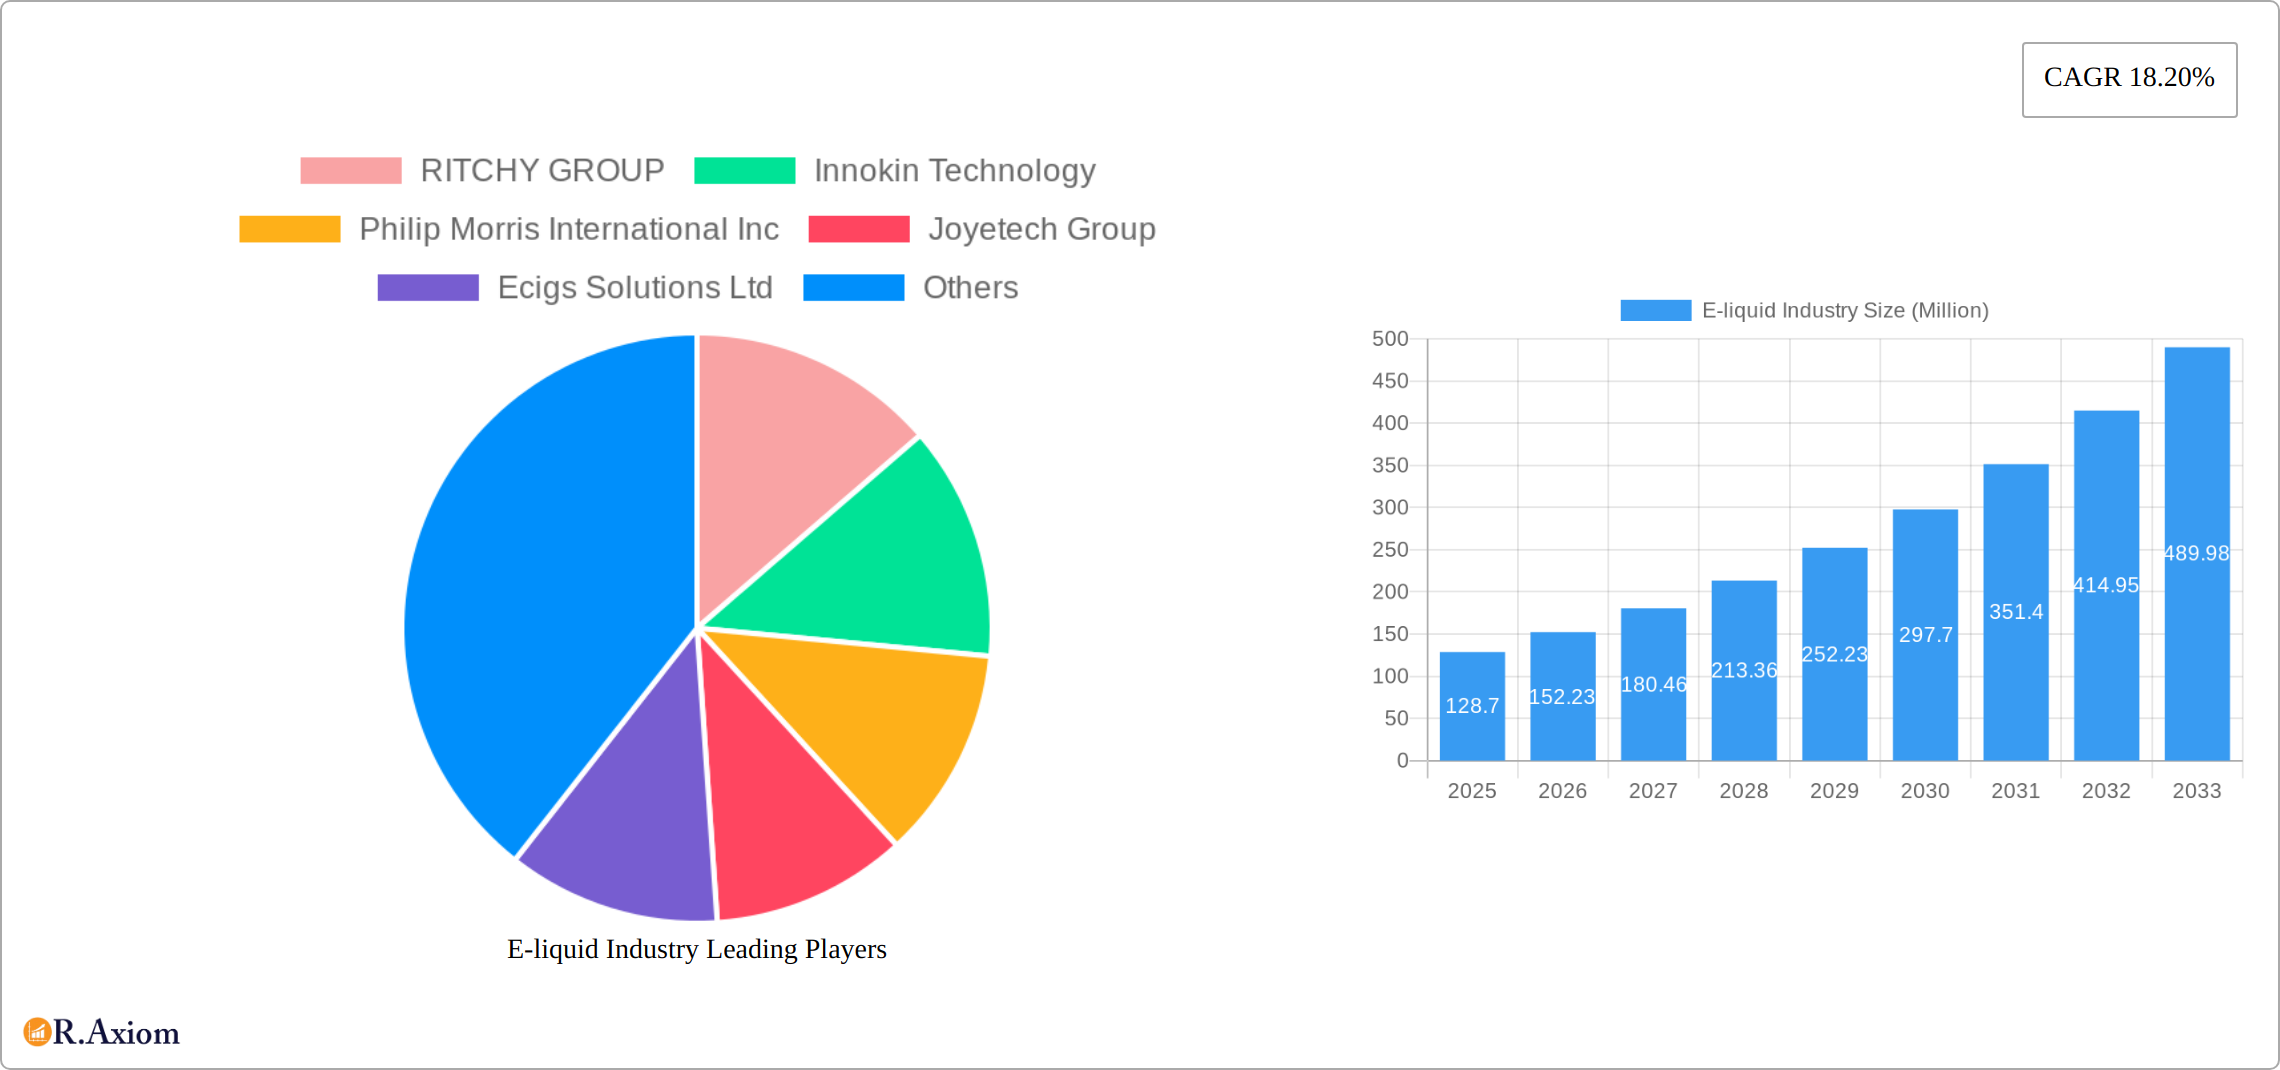
E-liquid Industry Market Size (In Million)
The competitive landscape is dynamic, with both established players and emerging companies vying for market share. Successful strategies will require a blend of product innovation, effective marketing, and a keen understanding of evolving consumer preferences and regulatory environments. Regional variations in regulations and consumer behavior will necessitate tailored approaches for market penetration and growth. The forecast period (2025-2033) presents a window of opportunity for significant expansion, yet success hinges on the ability of companies to mitigate risks associated with regulatory changes and maintain consumer trust amidst ongoing public health discussions surrounding vaping. A focus on responsible marketing and product development, emphasizing transparency and safety, will be critical for long-term sustainability within this rapidly evolving market.
E-liquid Industry Company Market Share
E-liquid Industry Market Report: 2019-2033
This comprehensive report provides a detailed analysis of the global e-liquid industry, offering invaluable insights for industry stakeholders, investors, and businesses seeking to navigate this dynamic market. The report covers the period from 2019 to 2033, with a focus on the 2025-2033 forecast period. It analyzes market size, segmentation, key players, growth drivers, challenges, and emerging opportunities, providing actionable insights for strategic decision-making. The global e-liquid market is projected to reach xx Million by 2033, exhibiting a CAGR of xx% during the forecast period.
E-liquid Industry Market Concentration & Innovation
The e-liquid market exhibits a moderately concentrated structure, with several major players holding significant market share. RITCHY GROUP, Innokin Technology, Philip Morris International Inc, Joyetech Group, and Aspire are among the leading companies, collectively accounting for an estimated xx% of the global market in 2025. However, the market also features numerous smaller players and emerging brands, indicating a dynamic competitive landscape.
Innovation Drivers:
- Technological advancements in e-cigarette device design and e-liquid formulation (e.g., improved battery technology, flavor innovation).
- Growing consumer demand for diverse flavors and nicotine strengths.
- Increased focus on product safety and regulatory compliance.
Regulatory Frameworks:
The e-liquid industry is subject to evolving and often differing regulations across various jurisdictions, impacting market access and product development. Recent regulatory changes, such as those in Egypt and Dubai (detailed in the "Key Developments" section), illustrate the dynamic nature of this aspect.
Product Substitutes:
Traditional cigarettes remain the primary substitute for e-liquids. However, other nicotine delivery systems, like heated tobacco products, are also posing increasing competition.
End-User Trends:
Consumer preferences are shifting toward healthier alternatives to traditional cigarettes, driving growth in the e-liquid market. This trend is further fueled by growing awareness of the potential health risks associated with smoking.
M&A Activities:
The e-liquid industry has witnessed several mergers and acquisitions in recent years, primarily driven by consolidation and expansion efforts among major players. The total value of M&A deals in the industry during the historical period (2019-2024) is estimated at xx Million.
E-liquid Industry Industry Trends & Insights
The global e-liquid market is experiencing substantial growth, fueled by several key factors. The rising prevalence of smoking cessation initiatives and increasing consumer awareness of the health risks associated with traditional cigarettes are significantly contributing to market expansion. Technological advancements have spurred the development of innovative e-cigarette devices and e-liquids, offering enhanced user experiences and a diverse range of product options, from sleek, modern designs to customizable flavor profiles. Market penetration is currently estimated at [Insert Updated Percentage]% and is projected to reach [Insert Updated Percentage]% by 2033, representing a Compound Annual Growth Rate (CAGR) of [Insert Updated Percentage]% during the forecast period (2025-2033). Consumer preferences are dynamically evolving, with a marked increase in demand for personalized flavor profiles and nicotine strengths, driving innovation in product development and marketing strategies. The competitive landscape is fiercely contested, with established players vying for market share alongside the emergence of agile new entrants. This dynamic environment presents both challenges and lucrative opportunities for innovation and market expansion.
Dominant Markets & Segments in E-liquid Industry
Leading Regions/Countries: North America and Europe remain the largest e-liquid consumer markets, driven by high smoking prevalence and established regulatory frameworks. However, the Asia-Pacific region is exhibiting rapid growth, fueled by rising disposable incomes and an expanding consumer base. Emerging markets in [mention specific regions/countries showing significant growth] also present substantial untapped potential.
Dominant Segments:
- By Product Type: While e-cigarette devices currently hold a dominant market share (estimated at [Insert Updated Market Share]% in 2025) due to the high demand for diverse designs and functionalities, the e-liquid segment is poised for accelerated growth, propelled by the increasing demand for a wider variety of flavors and nicotine strengths, including nicotine salts and other innovative formulations.
- By Distribution Channel: Online channels are experiencing significant expansion ([Insert Updated Market Share]% market share in 2025) due to increased e-commerce penetration and consumer preference for convenience. However, offline channels continue to hold a substantial share, especially in regions with limited online access or where face-to-face interaction is preferred.
Key Drivers for Dominant Segments:
- Economic Policies: Favorable tax policies and supportive regulations are crucial for stimulating market growth and encouraging responsible consumption.
- Infrastructure: Robust e-commerce infrastructure and efficient logistics networks are essential for supporting seamless online sales and distribution.
- Consumer Preferences: Evolving consumer preferences regarding flavors, nicotine strengths, device features (e.g., portability, battery life, design aesthetics), and health concerns directly influence product innovation and market trends.
- Technological Advancements: Continuous innovation in battery technology, coil design, and e-liquid formulations drives product differentiation and improved user experience.
E-liquid Industry Product Developments
The e-liquid industry is characterized by continuous product innovation, with a strong focus on enhanced user experience, improved safety profiles, and broader appeal. Key areas of development include extended battery life, superior flavor delivery systems (e.g., improved coil technology and wicking materials), and the utilization of safer and more sustainable materials. Technological advancements, such as advanced coil technology and innovative nicotine salt formulations, are driving the creation of superior products. The market shows a growing preference for disposable e-cigarettes and pod-based systems, highlighting the increasing demand for convenience and ease of use. These innovations are designed not only to enhance the user experience but also to directly address consumer safety and health concerns through improved quality control and transparent labeling.
Report Scope & Segmentation Analysis
By Product Type:
E-cigarette Devices: This segment includes various device types such as vape pens, mods, and pod systems, with sales projected to reach xx Million by 2033, driven by increasing demand for user-friendly devices and technological advancements. The segment is characterized by intense competition among established players.
E-liquid Devices: This segment includes pre-filled pods and bottles of e-liquid, with sales expected to reach xx Million by 2033, fueled by rising demand for a wider array of flavors, nicotine strengths, and customizable options. Competitive dynamics are primarily driven by flavor innovation and branding.
By Distribution Channel:
Offline Channel: This includes traditional retail stores and specialty vape shops, projected to maintain a significant market share with sales of xx Million in 2033, although online sales are expected to outpace growth in the long term. The segment faces challenges from increasing online competition and changing consumer preferences.
Online Channel: This encompasses e-commerce platforms and direct-to-consumer websites, with sales expected to reach xx Million by 2033, primarily driven by the convenience and wider product selection offered to consumers. This segment faces regulatory challenges and increasing competition.
Key Drivers of E-liquid Industry Growth
Several factors are driving the growth of the e-liquid industry. These include:
- Technological advancements: Innovation in device design, battery technology, and e-liquid formulations are enhancing user experience and product appeal.
- Consumer preferences: A growing number of smokers are seeking alternatives to traditional cigarettes, driving demand for e-liquids.
- Favorable regulatory environments: In some regions, regulations are becoming more favorable to the e-liquid industry, facilitating market expansion.
Challenges in the E-liquid Industry Sector
Despite significant growth potential, the e-liquid industry faces several challenges:
- Stringent regulations: Varying and often changing regulations across different jurisdictions pose significant barriers to market entry and expansion.
- Supply chain disruptions: Global supply chain issues can impact the availability of raw materials and components, affecting production and sales.
- Health concerns: Concerns regarding the long-term health effects of e-cigarettes continue to create negative publicity and regulatory scrutiny. This impacts consumer perception and adoption rates.
Emerging Opportunities in E-liquid Industry
The e-liquid industry presents several emerging opportunities:
- Expansion into new markets: Untapped markets in developing countries present significant growth potential.
- Development of innovative products: New product features, flavors, and nicotine delivery systems can attract new customers and increase market share.
- Focus on personalized experiences: Tailoring e-liquids and devices to individual consumer preferences can improve brand loyalty.
Leading Players in the E-liquid Industry Market
- RITCHY GROUP
- Innokin Technology (Innokin Technology)
- Philip Morris International Inc (Philip Morris International Inc)
- Joyetech Group
- Ecigs Solutions Ltd
- Intellicig Inc
- Aspire (Aspire)
- KangerTech
- British American Tobacco (British American Tobacco)
- VIP Electronic Cigarettes
Key Developments in E-liquid Industry Industry
April 2022: RELX International's success in Egypt signifies the growing acceptance and legalization of e-cigarettes in new markets.
November 2019: Dubai's legalization of e-cigarette trading demonstrates a shift towards regulated markets.
September 2019: The UAE's new regulations for electronic cigarettes set standards for product safety and labeling, improving consumer protection and market credibility.
Strategic Outlook for E-liquid Industry Market
The e-liquid industry is poised for sustained growth, driven by a confluence of factors including technological innovation, evolving consumer preferences, and the dynamic evolution of regulatory landscapes. Future market potential is substantial, particularly in developing economies and market segments that cater to personalized vaping experiences. Key opportunities lie in developing innovative products that meet diverse consumer needs, building robust and resilient supply chains, and proactively addressing emerging consumer health and safety concerns through responsible marketing and transparent communication. Companies adept at adapting to evolving regulatory requirements and effectively anticipating consumer demands will be ideally positioned to capitalize on the significant long-term growth potential of this dynamic market. A focus on sustainability and responsible environmental practices will also become increasingly important for maintaining a positive brand image and attracting environmentally conscious consumers.
E-liquid Industry Segmentation
-
1. Product Type
- 1.1. E-cigarette Devices
- 1.2. E-liquid Devices
-
2. Distribution Channel
- 2.1. Offline Channel
- 2.2. Online Channel
-
3. Geography
- 3.1. South Africa
- 3.2. Nigeria
- 3.3. Kenya
- 3.4. Ghana
- 3.5. United Arab Emirates
- 3.6. Egypt
- 3.7. Rest of Middle East & Africa
E-liquid Industry Segmentation By Geography
- 1. South Africa
- 2. Nigeria
- 3. Kenya
- 4. Ghana
- 5. United Arab Emirates
- 6. Egypt
- 7. Rest of Middle East
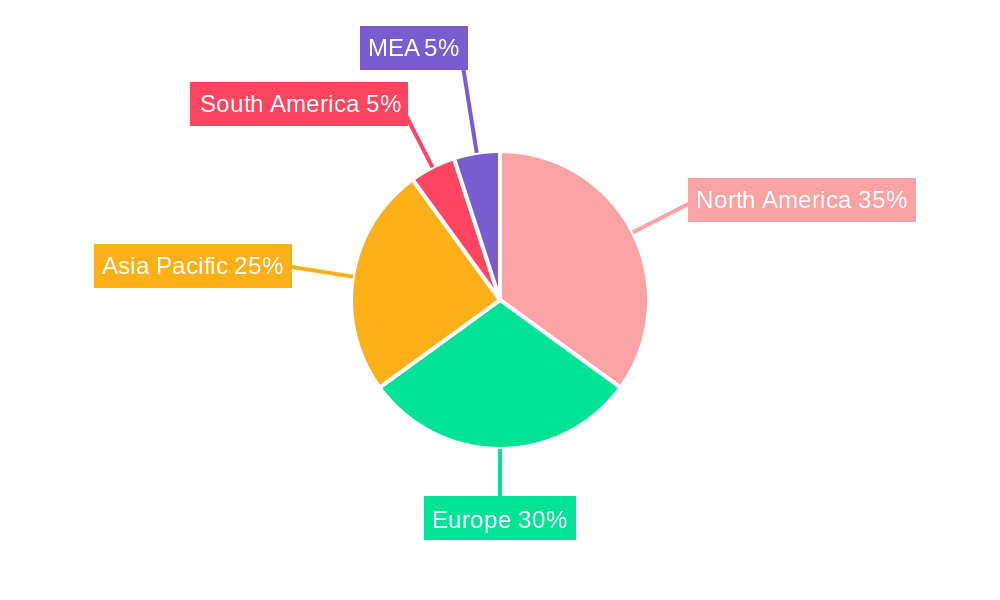
E-liquid Industry Regional Market Share
Geographic Coverage of E-liquid Industry
E-liquid Industry REPORT HIGHLIGHTS
| Aspects | Details |
|---|---|
| Study Period | 2020-2034 |
| Base Year | 2025 |
| Estimated Year | 2026 |
| Forecast Period | 2026-2034 |
| Historical Period | 2020-2025 |
| Growth Rate | CAGR of 18.20% from 2020-2034 |
| Segmentation |
|
Table of Contents
- 1. Introduction
- 1.1. Research Scope
- 1.2. Market Segmentation
- 1.3. Research Objective
- 1.4. Definitions and Assumptions
- 2. Executive Summary
- 2.1. Market Snapshot
- 3. Market Dynamics
- 3.1. Market Drivers
- 3.2. Market Restrains
- 3.3. Market Trends
- 3.4. Market Opportunities
- 4. Market Factor Analysis
- 4.1. Porters Five Forces
- 4.1.1. Bargaining Power of Suppliers
- 4.1.2. Bargaining Power of Buyers
- 4.1.3. Threat of New Entrants
- 4.1.4. Threat of Substitutes
- 4.1.5. Competitive Rivalry
- 4.2. PESTEL analysis
- 4.3. BCG Analysis
- 4.3.1. Stars (High Growth, High Market Share)
- 4.3.2. Cash Cows (Low Growth, High Market Share)
- 4.3.3. Question Mark (High Growth, Low Market Share)
- 4.3.4. Dogs (Low Growth, Low Market Share)
- 4.4. Ansoff Matrix Analysis
- 4.5. Supply Chain Analysis
- 4.6. Regulatory Landscape
- 4.7. Current Market Potential and Opportunity Assessment (TAM–SAM–SOM Framework)
- 4.8. RAX Analyst Note
- 4.1. Porters Five Forces
- 5. Market Analysis, Insights and Forecast 2021-2033
- 5.1. Market Analysis, Insights and Forecast - by Product Type
- 5.1.1. E-cigarette Devices
- 5.1.2. E-liquid Devices
- 5.2. Market Analysis, Insights and Forecast - by Distribution Channel
- 5.2.1. Offline Channel
- 5.2.2. Online Channel
- 5.3. Market Analysis, Insights and Forecast - by Geography
- 5.3.1. South Africa
- 5.3.2. Nigeria
- 5.3.3. Kenya
- 5.3.4. Ghana
- 5.3.5. United Arab Emirates
- 5.3.6. Egypt
- 5.3.7. Rest of Middle East & Africa
- 5.4. Market Analysis, Insights and Forecast - by Region
- 5.4.1. South Africa
- 5.4.2. Nigeria
- 5.4.3. Kenya
- 5.4.4. Ghana
- 5.4.5. United Arab Emirates
- 5.4.6. Egypt
- 5.4.7. Rest of Middle East
- 5.1. Market Analysis, Insights and Forecast - by Product Type
- 6. Global E-liquid Industry Analysis, Insights and Forecast, 2021-2033
- 6.1. Market Analysis, Insights and Forecast - by Product Type
- 6.1.1. E-cigarette Devices
- 6.1.2. E-liquid Devices
- 6.2. Market Analysis, Insights and Forecast - by Distribution Channel
- 6.2.1. Offline Channel
- 6.2.2. Online Channel
- 6.3. Market Analysis, Insights and Forecast - by Geography
- 6.3.1. South Africa
- 6.3.2. Nigeria
- 6.3.3. Kenya
- 6.3.4. Ghana
- 6.3.5. United Arab Emirates
- 6.3.6. Egypt
- 6.3.7. Rest of Middle East & Africa
- 6.1. Market Analysis, Insights and Forecast - by Product Type
- 7. South Africa E-liquid Industry Analysis, Insights and Forecast, 2020-2032
- 7.1. Market Analysis, Insights and Forecast - by Product Type
- 7.1.1. E-cigarette Devices
- 7.1.2. E-liquid Devices
- 7.2. Market Analysis, Insights and Forecast - by Distribution Channel
- 7.2.1. Offline Channel
- 7.2.2. Online Channel
- 7.3. Market Analysis, Insights and Forecast - by Geography
- 7.3.1. South Africa
- 7.3.2. Nigeria
- 7.3.3. Kenya
- 7.3.4. Ghana
- 7.3.5. United Arab Emirates
- 7.3.6. Egypt
- 7.3.7. Rest of Middle East & Africa
- 7.1. Market Analysis, Insights and Forecast - by Product Type
- 8. Nigeria E-liquid Industry Analysis, Insights and Forecast, 2020-2032
- 8.1. Market Analysis, Insights and Forecast - by Product Type
- 8.1.1. E-cigarette Devices
- 8.1.2. E-liquid Devices
- 8.2. Market Analysis, Insights and Forecast - by Distribution Channel
- 8.2.1. Offline Channel
- 8.2.2. Online Channel
- 8.3. Market Analysis, Insights and Forecast - by Geography
- 8.3.1. South Africa
- 8.3.2. Nigeria
- 8.3.3. Kenya
- 8.3.4. Ghana
- 8.3.5. United Arab Emirates
- 8.3.6. Egypt
- 8.3.7. Rest of Middle East & Africa
- 8.1. Market Analysis, Insights and Forecast - by Product Type
- 9. Kenya E-liquid Industry Analysis, Insights and Forecast, 2020-2032
- 9.1. Market Analysis, Insights and Forecast - by Product Type
- 9.1.1. E-cigarette Devices
- 9.1.2. E-liquid Devices
- 9.2. Market Analysis, Insights and Forecast - by Distribution Channel
- 9.2.1. Offline Channel
- 9.2.2. Online Channel
- 9.3. Market Analysis, Insights and Forecast - by Geography
- 9.3.1. South Africa
- 9.3.2. Nigeria
- 9.3.3. Kenya
- 9.3.4. Ghana
- 9.3.5. United Arab Emirates
- 9.3.6. Egypt
- 9.3.7. Rest of Middle East & Africa
- 9.1. Market Analysis, Insights and Forecast - by Product Type
- 10. Ghana E-liquid Industry Analysis, Insights and Forecast, 2020-2032
- 10.1. Market Analysis, Insights and Forecast - by Product Type
- 10.1.1. E-cigarette Devices
- 10.1.2. E-liquid Devices
- 10.2. Market Analysis, Insights and Forecast - by Distribution Channel
- 10.2.1. Offline Channel
- 10.2.2. Online Channel
- 10.3. Market Analysis, Insights and Forecast - by Geography
- 10.3.1. South Africa
- 10.3.2. Nigeria
- 10.3.3. Kenya
- 10.3.4. Ghana
- 10.3.5. United Arab Emirates
- 10.3.6. Egypt
- 10.3.7. Rest of Middle East & Africa
- 10.1. Market Analysis, Insights and Forecast - by Product Type
- 11. United Arab Emirates E-liquid Industry Analysis, Insights and Forecast, 2020-2032
- 11.1. Market Analysis, Insights and Forecast - by Product Type
- 11.1.1. E-cigarette Devices
- 11.1.2. E-liquid Devices
- 11.2. Market Analysis, Insights and Forecast - by Distribution Channel
- 11.2.1. Offline Channel
- 11.2.2. Online Channel
- 11.3. Market Analysis, Insights and Forecast - by Geography
- 11.3.1. South Africa
- 11.3.2. Nigeria
- 11.3.3. Kenya
- 11.3.4. Ghana
- 11.3.5. United Arab Emirates
- 11.3.6. Egypt
- 11.3.7. Rest of Middle East & Africa
- 11.1. Market Analysis, Insights and Forecast - by Product Type
- 12. Egypt E-liquid Industry Analysis, Insights and Forecast, 2020-2032
- 12.1. Market Analysis, Insights and Forecast - by Product Type
- 12.1.1. E-cigarette Devices
- 12.1.2. E-liquid Devices
- 12.2. Market Analysis, Insights and Forecast - by Distribution Channel
- 12.2.1. Offline Channel
- 12.2.2. Online Channel
- 12.3. Market Analysis, Insights and Forecast - by Geography
- 12.3.1. South Africa
- 12.3.2. Nigeria
- 12.3.3. Kenya
- 12.3.4. Ghana
- 12.3.5. United Arab Emirates
- 12.3.6. Egypt
- 12.3.7. Rest of Middle East & Africa
- 12.1. Market Analysis, Insights and Forecast - by Product Type
- 13. Rest of Middle East E-liquid Industry Analysis, Insights and Forecast, 2020-2032
- 13.1. Market Analysis, Insights and Forecast - by Product Type
- 13.1.1. E-cigarette Devices
- 13.1.2. E-liquid Devices
- 13.2. Market Analysis, Insights and Forecast - by Distribution Channel
- 13.2.1. Offline Channel
- 13.2.2. Online Channel
- 13.3. Market Analysis, Insights and Forecast - by Geography
- 13.3.1. South Africa
- 13.3.2. Nigeria
- 13.3.3. Kenya
- 13.3.4. Ghana
- 13.3.5. United Arab Emirates
- 13.3.6. Egypt
- 13.3.7. Rest of Middle East & Africa
- 13.1. Market Analysis, Insights and Forecast - by Product Type
- 14. Competitive Analysis
- 14.1. Company Profiles
- 14.1.1 RITCHY GROUP
- 14.1.1.1. Company Overview
- 14.1.1.2. Products
- 14.1.1.3. Company Financials
- 14.1.1.4. SWOT Analysis
- 14.1.2 Innokin Technology
- 14.1.2.1. Company Overview
- 14.1.2.2. Products
- 14.1.2.3. Company Financials
- 14.1.2.4. SWOT Analysis
- 14.1.3 Philip Morris International Inc
- 14.1.3.1. Company Overview
- 14.1.3.2. Products
- 14.1.3.3. Company Financials
- 14.1.3.4. SWOT Analysis
- 14.1.4 Joyetech Group
- 14.1.4.1. Company Overview
- 14.1.4.2. Products
- 14.1.4.3. Company Financials
- 14.1.4.4. SWOT Analysis
- 14.1.5 Ecigs Solutions Ltd
- 14.1.5.1. Company Overview
- 14.1.5.2. Products
- 14.1.5.3. Company Financials
- 14.1.5.4. SWOT Analysis
- 14.1.6 Intellicig Inc
- 14.1.6.1. Company Overview
- 14.1.6.2. Products
- 14.1.6.3. Company Financials
- 14.1.6.4. SWOT Analysis
- 14.1.7 Aspire
- 14.1.7.1. Company Overview
- 14.1.7.2. Products
- 14.1.7.3. Company Financials
- 14.1.7.4. SWOT Analysis
- 14.1.8 KangerTech
- 14.1.8.1. Company Overview
- 14.1.8.2. Products
- 14.1.8.3. Company Financials
- 14.1.8.4. SWOT Analysis
- 14.1.9 British American Tobacco
- 14.1.9.1. Company Overview
- 14.1.9.2. Products
- 14.1.9.3. Company Financials
- 14.1.9.4. SWOT Analysis
- 14.1.10 VIP Electronic Cigarettes
- 14.1.10.1. Company Overview
- 14.1.10.2. Products
- 14.1.10.3. Company Financials
- 14.1.10.4. SWOT Analysis
- 14.1.1 RITCHY GROUP
- 14.2. Market Entropy
- 14.2.1 Company's Key Areas Served
- 14.2.2 Recent Developments
- 14.3. Company Market Share Analysis 2025
- 14.3.1 Top 5 Companies Market Share Analysis
- 14.3.2 Top 3 Companies Market Share Analysis
- 14.4. List of Potential Customers
- 15. Research Methodology
List of Figures
- Figure 1: Global E-liquid Industry Revenue Breakdown (Million, %) by Region 2025 & 2033
- Figure 2: South Africa E-liquid Industry Revenue (Million), by Product Type 2025 & 2033
- Figure 3: South Africa E-liquid Industry Revenue Share (%), by Product Type 2025 & 2033
- Figure 4: South Africa E-liquid Industry Revenue (Million), by Distribution Channel 2025 & 2033
- Figure 5: South Africa E-liquid Industry Revenue Share (%), by Distribution Channel 2025 & 2033
- Figure 6: South Africa E-liquid Industry Revenue (Million), by Geography 2025 & 2033
- Figure 7: South Africa E-liquid Industry Revenue Share (%), by Geography 2025 & 2033
- Figure 8: South Africa E-liquid Industry Revenue (Million), by Country 2025 & 2033
- Figure 9: South Africa E-liquid Industry Revenue Share (%), by Country 2025 & 2033
- Figure 10: Nigeria E-liquid Industry Revenue (Million), by Product Type 2025 & 2033
- Figure 11: Nigeria E-liquid Industry Revenue Share (%), by Product Type 2025 & 2033
- Figure 12: Nigeria E-liquid Industry Revenue (Million), by Distribution Channel 2025 & 2033
- Figure 13: Nigeria E-liquid Industry Revenue Share (%), by Distribution Channel 2025 & 2033
- Figure 14: Nigeria E-liquid Industry Revenue (Million), by Geography 2025 & 2033
- Figure 15: Nigeria E-liquid Industry Revenue Share (%), by Geography 2025 & 2033
- Figure 16: Nigeria E-liquid Industry Revenue (Million), by Country 2025 & 2033
- Figure 17: Nigeria E-liquid Industry Revenue Share (%), by Country 2025 & 2033
- Figure 18: Kenya E-liquid Industry Revenue (Million), by Product Type 2025 & 2033
- Figure 19: Kenya E-liquid Industry Revenue Share (%), by Product Type 2025 & 2033
- Figure 20: Kenya E-liquid Industry Revenue (Million), by Distribution Channel 2025 & 2033
- Figure 21: Kenya E-liquid Industry Revenue Share (%), by Distribution Channel 2025 & 2033
- Figure 22: Kenya E-liquid Industry Revenue (Million), by Geography 2025 & 2033
- Figure 23: Kenya E-liquid Industry Revenue Share (%), by Geography 2025 & 2033
- Figure 24: Kenya E-liquid Industry Revenue (Million), by Country 2025 & 2033
- Figure 25: Kenya E-liquid Industry Revenue Share (%), by Country 2025 & 2033
- Figure 26: Ghana E-liquid Industry Revenue (Million), by Product Type 2025 & 2033
- Figure 27: Ghana E-liquid Industry Revenue Share (%), by Product Type 2025 & 2033
- Figure 28: Ghana E-liquid Industry Revenue (Million), by Distribution Channel 2025 & 2033
- Figure 29: Ghana E-liquid Industry Revenue Share (%), by Distribution Channel 2025 & 2033
- Figure 30: Ghana E-liquid Industry Revenue (Million), by Geography 2025 & 2033
- Figure 31: Ghana E-liquid Industry Revenue Share (%), by Geography 2025 & 2033
- Figure 32: Ghana E-liquid Industry Revenue (Million), by Country 2025 & 2033
- Figure 33: Ghana E-liquid Industry Revenue Share (%), by Country 2025 & 2033
- Figure 34: United Arab Emirates E-liquid Industry Revenue (Million), by Product Type 2025 & 2033
- Figure 35: United Arab Emirates E-liquid Industry Revenue Share (%), by Product Type 2025 & 2033
- Figure 36: United Arab Emirates E-liquid Industry Revenue (Million), by Distribution Channel 2025 & 2033
- Figure 37: United Arab Emirates E-liquid Industry Revenue Share (%), by Distribution Channel 2025 & 2033
- Figure 38: United Arab Emirates E-liquid Industry Revenue (Million), by Geography 2025 & 2033
- Figure 39: United Arab Emirates E-liquid Industry Revenue Share (%), by Geography 2025 & 2033
- Figure 40: United Arab Emirates E-liquid Industry Revenue (Million), by Country 2025 & 2033
- Figure 41: United Arab Emirates E-liquid Industry Revenue Share (%), by Country 2025 & 2033
- Figure 42: Egypt E-liquid Industry Revenue (Million), by Product Type 2025 & 2033
- Figure 43: Egypt E-liquid Industry Revenue Share (%), by Product Type 2025 & 2033
- Figure 44: Egypt E-liquid Industry Revenue (Million), by Distribution Channel 2025 & 2033
- Figure 45: Egypt E-liquid Industry Revenue Share (%), by Distribution Channel 2025 & 2033
- Figure 46: Egypt E-liquid Industry Revenue (Million), by Geography 2025 & 2033
- Figure 47: Egypt E-liquid Industry Revenue Share (%), by Geography 2025 & 2033
- Figure 48: Egypt E-liquid Industry Revenue (Million), by Country 2025 & 2033
- Figure 49: Egypt E-liquid Industry Revenue Share (%), by Country 2025 & 2033
- Figure 50: Rest of Middle East E-liquid Industry Revenue (Million), by Product Type 2025 & 2033
- Figure 51: Rest of Middle East E-liquid Industry Revenue Share (%), by Product Type 2025 & 2033
- Figure 52: Rest of Middle East E-liquid Industry Revenue (Million), by Distribution Channel 2025 & 2033
- Figure 53: Rest of Middle East E-liquid Industry Revenue Share (%), by Distribution Channel 2025 & 2033
- Figure 54: Rest of Middle East E-liquid Industry Revenue (Million), by Geography 2025 & 2033
- Figure 55: Rest of Middle East E-liquid Industry Revenue Share (%), by Geography 2025 & 2033
- Figure 56: Rest of Middle East E-liquid Industry Revenue (Million), by Country 2025 & 2033
- Figure 57: Rest of Middle East E-liquid Industry Revenue Share (%), by Country 2025 & 2033
List of Tables
- Table 1: Global E-liquid Industry Revenue Million Forecast, by Product Type 2020 & 2033
- Table 2: Global E-liquid Industry Revenue Million Forecast, by Distribution Channel 2020 & 2033
- Table 3: Global E-liquid Industry Revenue Million Forecast, by Geography 2020 & 2033
- Table 4: Global E-liquid Industry Revenue Million Forecast, by Region 2020 & 2033
- Table 5: Global E-liquid Industry Revenue Million Forecast, by Product Type 2020 & 2033
- Table 6: Global E-liquid Industry Revenue Million Forecast, by Distribution Channel 2020 & 2033
- Table 7: Global E-liquid Industry Revenue Million Forecast, by Geography 2020 & 2033
- Table 8: Global E-liquid Industry Revenue Million Forecast, by Country 2020 & 2033
- Table 9: Global E-liquid Industry Revenue Million Forecast, by Product Type 2020 & 2033
- Table 10: Global E-liquid Industry Revenue Million Forecast, by Distribution Channel 2020 & 2033
- Table 11: Global E-liquid Industry Revenue Million Forecast, by Geography 2020 & 2033
- Table 12: Global E-liquid Industry Revenue Million Forecast, by Country 2020 & 2033
- Table 13: Global E-liquid Industry Revenue Million Forecast, by Product Type 2020 & 2033
- Table 14: Global E-liquid Industry Revenue Million Forecast, by Distribution Channel 2020 & 2033
- Table 15: Global E-liquid Industry Revenue Million Forecast, by Geography 2020 & 2033
- Table 16: Global E-liquid Industry Revenue Million Forecast, by Country 2020 & 2033
- Table 17: Global E-liquid Industry Revenue Million Forecast, by Product Type 2020 & 2033
- Table 18: Global E-liquid Industry Revenue Million Forecast, by Distribution Channel 2020 & 2033
- Table 19: Global E-liquid Industry Revenue Million Forecast, by Geography 2020 & 2033
- Table 20: Global E-liquid Industry Revenue Million Forecast, by Country 2020 & 2033
- Table 21: Global E-liquid Industry Revenue Million Forecast, by Product Type 2020 & 2033
- Table 22: Global E-liquid Industry Revenue Million Forecast, by Distribution Channel 2020 & 2033
- Table 23: Global E-liquid Industry Revenue Million Forecast, by Geography 2020 & 2033
- Table 24: Global E-liquid Industry Revenue Million Forecast, by Country 2020 & 2033
- Table 25: Global E-liquid Industry Revenue Million Forecast, by Product Type 2020 & 2033
- Table 26: Global E-liquid Industry Revenue Million Forecast, by Distribution Channel 2020 & 2033
- Table 27: Global E-liquid Industry Revenue Million Forecast, by Geography 2020 & 2033
- Table 28: Global E-liquid Industry Revenue Million Forecast, by Country 2020 & 2033
- Table 29: Global E-liquid Industry Revenue Million Forecast, by Product Type 2020 & 2033
- Table 30: Global E-liquid Industry Revenue Million Forecast, by Distribution Channel 2020 & 2033
- Table 31: Global E-liquid Industry Revenue Million Forecast, by Geography 2020 & 2033
- Table 32: Global E-liquid Industry Revenue Million Forecast, by Country 2020 & 2033
Frequently Asked Questions
1. What is the projected Compound Annual Growth Rate (CAGR) of the E-liquid Industry?
The projected CAGR is approximately 18.20%.
2. Which companies are prominent players in the E-liquid Industry?
Key companies in the market include RITCHY GROUP, Innokin Technology, Philip Morris International Inc, Joyetech Group, Ecigs Solutions Ltd, Intellicig Inc, Aspire, KangerTech, British American Tobacco, VIP Electronic Cigarettes.
3. What are the main segments of the E-liquid Industry?
The market segments include Product Type, Distribution Channel, Geography.
4. Can you provide details about the market size?
The market size is estimated to be USD 128.70 Million as of 2022.
5. What are some drivers contributing to market growth?
Aggressive Social Media Marketing; Lower-risk Factor Associated with the Use of E-Cigarettes Compared to Conventional/Combustible Cigarettes.
6. What are the notable trends driving market growth?
Penetration of E-cigarettes in Organized Retail.
7. Are there any restraints impacting market growth?
Government Initiatives to Ban Disposable E-Cigarettes.
8. Can you provide examples of recent developments in the market?
In April 2022, RELX International, a multinational electronic cigarettes company, lauds the recent decision by Egyptian authorities to allow the legal import and commercialization of e-cigarette products in the country. The lifting of the ban highlights the Egyptian authorities' progressive approach to e-cigarettes. It sets the stage for creating a regulated market rich with business opportunities by serving the demand for easily accessible, quality products by legal age (adult) consumers across the country.
9. What pricing options are available for accessing the report?
Pricing options include single-user, multi-user, and enterprise licenses priced at USD 4750, USD 5250, and USD 8750 respectively.
10. Is the market size provided in terms of value or volume?
The market size is provided in terms of value, measured in Million.
11. Are there any specific market keywords associated with the report?
Yes, the market keyword associated with the report is "E-liquid Industry," which aids in identifying and referencing the specific market segment covered.
12. How do I determine which pricing option suits my needs best?
The pricing options vary based on user requirements and access needs. Individual users may opt for single-user licenses, while businesses requiring broader access may choose multi-user or enterprise licenses for cost-effective access to the report.
13. Are there any additional resources or data provided in the E-liquid Industry report?
While the report offers comprehensive insights, it's advisable to review the specific contents or supplementary materials provided to ascertain if additional resources or data are available.
14. How can I stay updated on further developments or reports in the E-liquid Industry?
To stay informed about further developments, trends, and reports in the E-liquid Industry, consider subscribing to industry newsletters, following relevant companies and organizations, or regularly checking reputable industry news sources and publications.
Methodology
Step 1 - Identification of Relevant Samples Size from Population Database


Step 2 - Approaches for Defining Global Market Size (Value, Volume* & Price*)

Note*: In applicable scenarios
Step 3 - Data Sources
Primary Research
- Web Analytics
- Survey Reports
- Research Institute
- Latest Research Reports
- Opinion Leaders
Secondary Research
- Annual Reports
- White Paper
- Latest Press Release
- Industry Association
- Paid Database
- Investor Presentations

Step 4 - Data Triangulation
Involves using different sources of information in order to increase the validity of a study
These sources are likely to be stakeholders in a program - participants, other researchers, program staff, other community members, and so on.
Then we put all data in single framework & apply various statistical tools to find out the dynamic on the market.
During the analysis stage, feedback from the stakeholder groups would be compared to determine areas of agreement as well as areas of divergence