
Key Insights
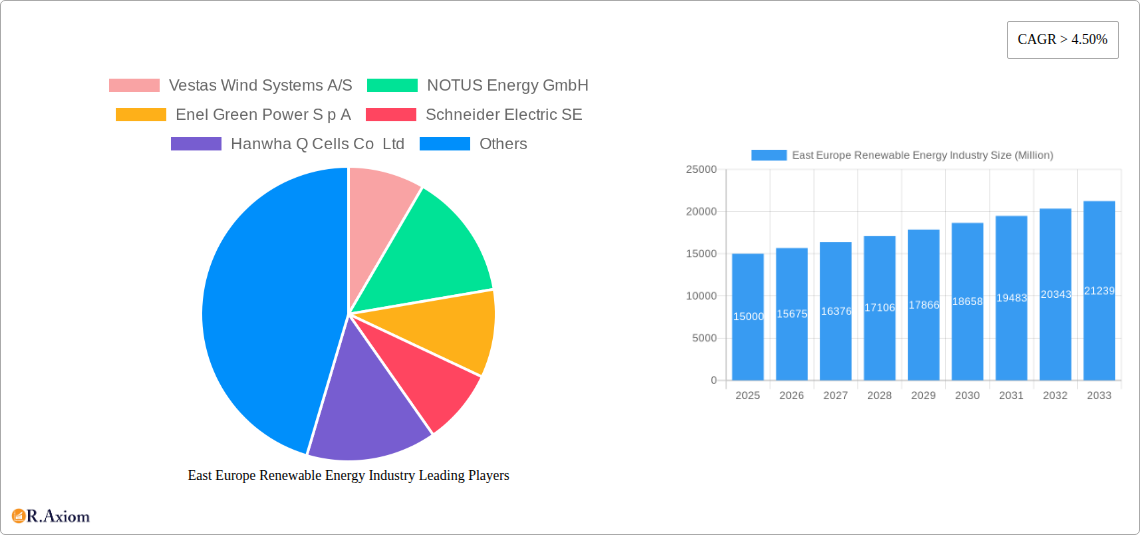
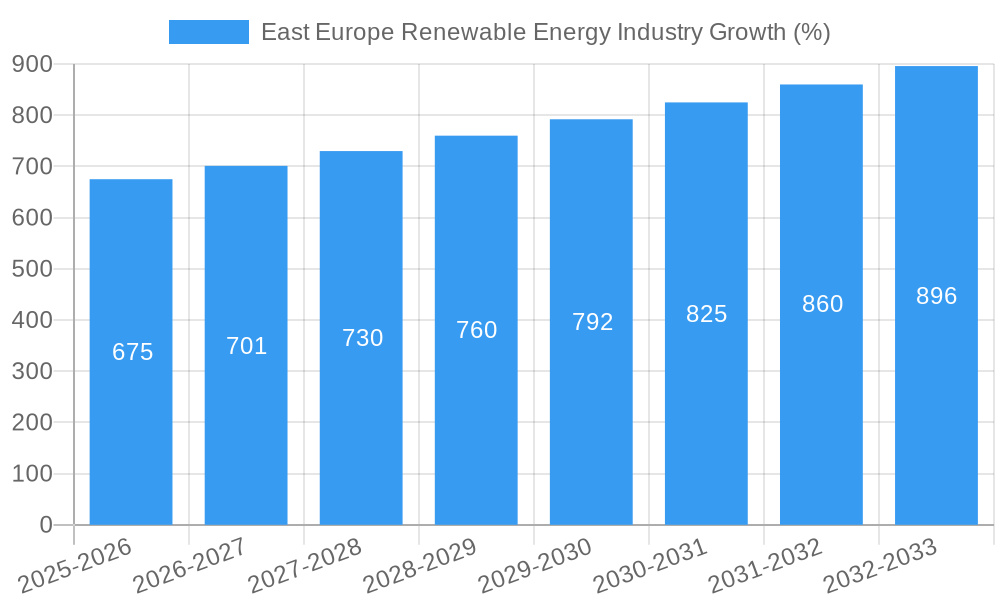
The East European renewable energy market, while exhibiting robust growth potential, faces a complex interplay of factors. The market size in 2025 is estimated at €15 billion, based on extrapolation from global renewable energy market data and the known strong growth in Eastern Europe. This market is projected to experience a Compound Annual Growth Rate (CAGR) exceeding 4.5% through 2033, driven primarily by increasing government support for renewable energy initiatives, a growing focus on energy independence, and the escalating urgency to meet climate change targets. Significant investments in hydropower projects, particularly in countries with abundant water resources, are fueling growth. The rise of solar energy, driven by decreasing technology costs and favorable government policies, is another key driver. The residential and commercial segments are showing strong uptake of renewable energy sources, while the industrial sector presents a significant growth opportunity. While challenges remain, such as grid infrastructure limitations and fluctuating energy prices, the long-term outlook for renewable energy in Eastern Europe is positive, with diverse applications across sectors and regions.
The leading players in this market, including Vestas, Enel Green Power, and Hanwha Q Cells, are actively expanding their operations in the region, further stimulating growth. However, regulatory hurdles and a lack of standardized renewable energy policies across different East European nations could impede progress. Furthermore, reliance on specific renewable energy sources might create vulnerabilities in energy security. Diversification of the energy mix and strategic investments in grid modernization are crucial for long-term sustainability and unlocking the full potential of this burgeoning market. The “Others” segment encompasses geothermal, biomass, and wind, which present further avenues for growth contingent on specific regional conditions and policy frameworks. A focus on smart grid technologies and energy storage solutions will be pivotal in optimizing the integration of renewable energy sources into the existing power grid infrastructure. The growth potential across all segments—hydropower, solar, and others—indicates a robust and multifaceted market with significant opportunities for investors and industry players.
East Europe Renewable Energy Industry: A Comprehensive Market Report (2019-2033)
This comprehensive report provides an in-depth analysis of the East Europe renewable energy industry, covering the period 2019-2033, with a focus on market size, growth drivers, challenges, and key players. The report utilizes data from 2019-2024 (historical period) to establish a robust base year of 2025 and forecast market trends until 2033. This report is essential for investors, industry stakeholders, and policymakers seeking to understand the complexities and opportunities within this rapidly evolving sector. The total market value in 2025 is estimated at xx Million.
East Europe Renewable Energy Industry Market Concentration & Innovation
This section analyzes the competitive landscape of the East European renewable energy market, assessing market concentration, innovation drivers, regulatory frameworks, and recent M&A activities. The market is characterized by a mix of established international players and emerging local companies. Market share data for 2025 suggests a fragmented market, with no single dominant player controlling more than xx%.
- Market Concentration: The Herfindahl-Hirschman Index (HHI) for 2025 is estimated at xx, indicating a moderately concentrated market.
- Innovation Drivers: Government incentives, technological advancements (e.g., improved solar panel efficiency, advancements in wind turbine technology), and decreasing costs are driving innovation.
- Regulatory Frameworks: Varying national policies across Eastern European countries create a complex regulatory environment impacting market growth and investment. Harmonization efforts are underway but face challenges.
- Product Substitutes: Fossil fuels remain a significant competitor, though their dominance is gradually declining due to environmental concerns and rising prices.
- End-User Trends: A growing focus on sustainability and energy independence is driving demand across all sectors (residential, commercial, industrial, and utilities).
- M&A Activities: The report details significant M&A activities during the study period, with total deal value estimated at xx Million in 2025. These transactions reflect consolidation within the industry and strategic expansion by major players. Examples include [Specific examples of M&A deals and their values if available, otherwise, xx Million].
East Europe Renewable Energy Industry Industry Trends & Insights
The East European renewable energy market exhibits robust growth, driven by several factors. The Compound Annual Growth Rate (CAGR) from 2025 to 2033 is projected to be xx%, fueled by supportive government policies, increasing energy demand, and a commitment to decarbonization. Market penetration of renewable energy sources is also on the rise, with an estimated xx% share of total electricity generation by 2033. This growth is further supported by technological advancements leading to cost reductions and increased efficiency of renewable energy technologies. Consumer preferences are increasingly shifting towards cleaner energy solutions, driven by environmental awareness and cost savings in the long term. However, competitive dynamics remain complex, with both domestic and international players vying for market share. Challenges such as grid infrastructure limitations and intermittent energy supply need to be addressed to fully unlock the potential of the market.
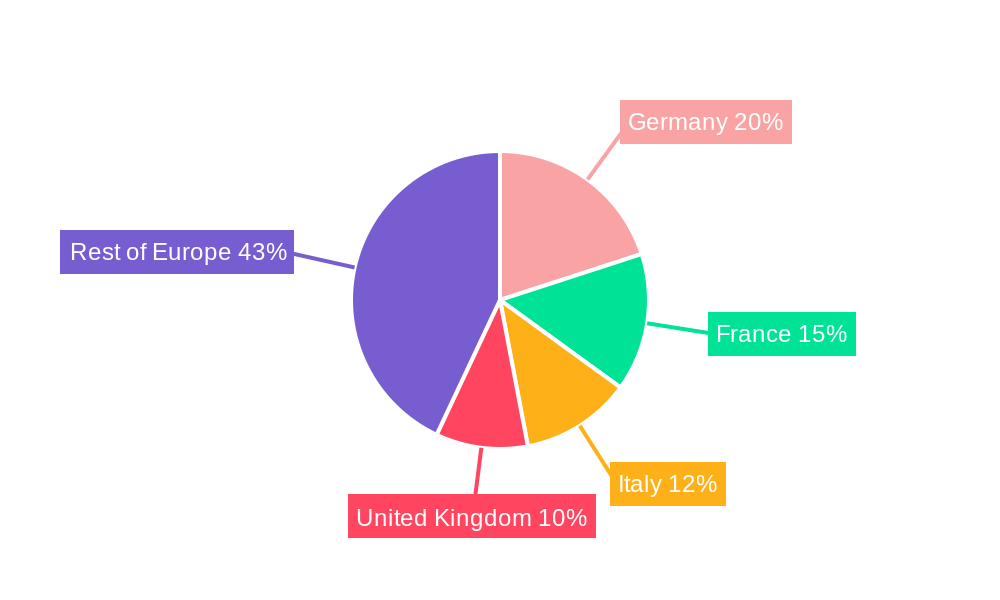
Dominant Markets & Segments in East Europe Renewable Energy Industry
While the entire region shows significant growth potential, certain countries and segments are more prominent. Poland and Romania are leading markets, driven by supportive government policies and favorable geographic conditions. The solar segment demonstrates the highest growth rate, largely due to cost reductions and technological advancements.
- Leading Regions/Countries: Poland and Romania are currently leading due to a combination of factors, including strong government support for renewable energy projects, suitable climatic conditions for solar and wind power, and significant investment from international companies.
- Dominant Segments:
- Type: Solar is the fastest-growing segment, while hydropower remains significant in countries with abundant water resources. “Others” (e.g., biomass, geothermal) are steadily growing, but at a slower pace than solar and wind.
- Application: The utility-scale segment dominates, driven by large-scale projects and government support. However, the residential and commercial segments are also showing strong growth, driven by decreasing costs and increasing consumer awareness. Industrial applications are expanding as companies seek to reduce their carbon footprint.
- Key Drivers:
- Economic Policies: Government subsidies, tax incentives, and feed-in tariffs are major drivers.
- Infrastructure Development: Investments in grid infrastructure are crucial for accommodating the increasing capacity of renewable energy sources.
- Technological Advancements: Continuous improvements in renewable energy technologies drive down costs and increase efficiency.
East Europe Renewable Energy Industry Product Developments
Recent product innovations focus on increasing efficiency, reducing costs, and improving grid integration of renewable energy systems. This includes advancements in solar panel technology, more efficient wind turbines, and improved energy storage solutions. These developments are enhancing the competitiveness of renewable energy sources against traditional fossil fuels, thereby driving market growth and facilitating wider adoption. The market is witnessing a surge in smart grid technologies and energy management systems that optimize the integration of variable renewable energy sources into the existing power grids.
Report Scope & Segmentation Analysis
This report segments the East European renewable energy market by technology type (Hydropower, Solar, Others) and application (Residential, Commercial, Industrial, Utilities). Each segment’s growth trajectory, market size (in Millions), and competitive dynamics are thoroughly analyzed.
- Hydropower: This segment exhibits steady growth, driven by existing infrastructure and potential for further development in specific regions. Market size in 2025 is estimated at xx Million.
- Solar: This is the fastest-growing segment, with significant expansion projected throughout the forecast period. Market size in 2025 is estimated at xx Million.
- Others: This includes biomass, geothermal, and other renewable energy sources. This segment shows moderate growth, with market size in 2025 estimated at xx Million.
- Residential: This segment experiences steady growth, driven by increasing consumer adoption of solar panels and other renewable energy systems.
- Commercial: This segment is witnessing rapid expansion, driven by corporate sustainability initiatives and cost savings.
- Industrial: This segment displays moderate growth, with significant potential for expansion driven by decarbonization efforts.
- Utilities: This segment accounts for a large portion of the market, driven by large-scale renewable energy projects.
Key Drivers of East Europe Renewable Energy Industry Growth
Several factors are driving the growth of the East European renewable energy industry. Firstly, supportive government policies, including subsidies and feed-in tariffs, incentivize renewable energy adoption. Secondly, decreasing technology costs have made renewable energy more economically competitive compared to fossil fuels. Finally, growing environmental awareness and the need to reduce carbon emissions are creating a strong demand for sustainable energy sources.
Challenges in the East Europe Renewable Energy Industry Sector
The industry faces several challenges. Regulatory inconsistencies across countries create hurdles for investors. Intermittency of renewable sources requires significant investment in grid infrastructure and energy storage solutions. Furthermore, competition from established fossil fuel industries and potential supply chain disruptions associated with importing critical components pose risks. For example, delays in securing permits and approvals for projects can lead to significant cost overruns (quantifiable impact - xx Million annually).
Emerging Opportunities in East Europe Renewable Energy Industry
The industry presents various opportunities. The growing demand for energy storage solutions opens avenues for investment. Offshore wind power holds immense potential in coastal regions. Furthermore, integration of renewable energy into smart grids offers opportunities for innovative solutions.
Leading Players in the East Europe Renewable Energy Industry Market
- Vestas Wind Systems A/S
- NOTUS Energy GmbH
- Enel Green Power S.p.A
- Schneider Electric SE
- Hanwha Q Cells Co Ltd
- SGS SA
- Wärtsilä Oyj Abp
- Federal Hydro-Generating Co RusHydro PAO
- C&C Energy SRL
Key Developments in East Europe Renewable Energy Industry Industry
- November 2022: Investors submitted applications for three photovoltaic plants in Albania (151 MW total capacity). This signals significant investment interest in the Albanian renewable energy sector.
- November 2022: Poland launched its first floating PV array (49.5 kW). This highlights innovation in renewable energy deployment and adaptation to specific geographic conditions.
Strategic Outlook for East Europe Renewable Energy Industry Market
The East European renewable energy market is poised for substantial growth. Continued government support, technological advancements, and increasing environmental awareness will fuel expansion across various segments. This presents significant opportunities for investors and industry players to capitalize on the region's growing demand for sustainable energy solutions. The market's future growth will heavily rely on addressing the existing challenges related to grid infrastructure and regulatory harmonization.
East Europe Renewable Energy Industry Segmentation
-
1. Type
- 1.1. Hydropower
- 1.2. Solar
- 1.3. Others
-
2. Geography
- 2.1. Russia
- 2.2. Poland
- 2.3. Ukraine
- 2.4. Others
East Europe Renewable Energy Industry Segmentation By Geography
- 1. Russia
- 2. Poland
- 3. Ukraine
- 4. Others
East Europe Renewable Energy Industry REPORT HIGHLIGHTS
| Aspects | Details |
|---|---|
| Study Period | 2019-2033 |
| Base Year | 2024 |
| Estimated Year | 2025 |
| Forecast Period | 2025-2033 |
| Historical Period | 2019-2024 |
| Growth Rate | CAGR of > 4.50% from 2019-2033 |
| Segmentation |
|
Table of Contents
- 1. Introduction
- 1.1. Research Scope
- 1.2. Market Segmentation
- 1.3. Research Methodology
- 1.4. Definitions and Assumptions
- 2. Executive Summary
- 2.1. Introduction
- 3. Market Dynamics
- 3.1. Introduction
- 3.2. Market Drivers
- 3.2.1. 4.; Increasing Investment in Upcoming Wind Power Projects4.; Favorable Government Policies
- 3.3. Market Restrains
- 3.3.1. 4.; The Growing Adoption of Alternative Energy Sources Such as Gas-Based Power
- 3.4. Market Trends
- 3.4.1. Hydropower Segment to Dominate the Market
- 4. Market Factor Analysis
- 4.1. Porters Five Forces
- 4.2. Supply/Value Chain
- 4.3. PESTEL analysis
- 4.4. Market Entropy
- 4.5. Patent/Trademark Analysis
- 5. East Europe Renewable Energy Industry Analysis, Insights and Forecast, 2019-2031
- 5.1. Market Analysis, Insights and Forecast - by Type
- 5.1.1. Hydropower
- 5.1.2. Solar
- 5.1.3. Others
- 5.2. Market Analysis, Insights and Forecast - by Geography
- 5.2.1. Russia
- 5.2.2. Poland
- 5.2.3. Ukraine
- 5.2.4. Others
- 5.3. Market Analysis, Insights and Forecast - by Region
- 5.3.1. Russia
- 5.3.2. Poland
- 5.3.3. Ukraine
- 5.3.4. Others
- 5.1. Market Analysis, Insights and Forecast - by Type
- 6. Russia East Europe Renewable Energy Industry Analysis, Insights and Forecast, 2019-2031
- 6.1. Market Analysis, Insights and Forecast - by Type
- 6.1.1. Hydropower
- 6.1.2. Solar
- 6.1.3. Others
- 6.2. Market Analysis, Insights and Forecast - by Geography
- 6.2.1. Russia
- 6.2.2. Poland
- 6.2.3. Ukraine
- 6.2.4. Others
- 6.1. Market Analysis, Insights and Forecast - by Type
- 7. Poland East Europe Renewable Energy Industry Analysis, Insights and Forecast, 2019-2031
- 7.1. Market Analysis, Insights and Forecast - by Type
- 7.1.1. Hydropower
- 7.1.2. Solar
- 7.1.3. Others
- 7.2. Market Analysis, Insights and Forecast - by Geography
- 7.2.1. Russia
- 7.2.2. Poland
- 7.2.3. Ukraine
- 7.2.4. Others
- 7.1. Market Analysis, Insights and Forecast - by Type
- 8. Ukraine East Europe Renewable Energy Industry Analysis, Insights and Forecast, 2019-2031
- 8.1. Market Analysis, Insights and Forecast - by Type
- 8.1.1. Hydropower
- 8.1.2. Solar
- 8.1.3. Others
- 8.2. Market Analysis, Insights and Forecast - by Geography
- 8.2.1. Russia
- 8.2.2. Poland
- 8.2.3. Ukraine
- 8.2.4. Others
- 8.1. Market Analysis, Insights and Forecast - by Type
- 9. Others East Europe Renewable Energy Industry Analysis, Insights and Forecast, 2019-2031
- 9.1. Market Analysis, Insights and Forecast - by Type
- 9.1.1. Hydropower
- 9.1.2. Solar
- 9.1.3. Others
- 9.2. Market Analysis, Insights and Forecast - by Geography
- 9.2.1. Russia
- 9.2.2. Poland
- 9.2.3. Ukraine
- 9.2.4. Others
- 9.1. Market Analysis, Insights and Forecast - by Type
- 10. Germany East Europe Renewable Energy Industry Analysis, Insights and Forecast, 2019-2031
- 11. France East Europe Renewable Energy Industry Analysis, Insights and Forecast, 2019-2031
- 12. Italy East Europe Renewable Energy Industry Analysis, Insights and Forecast, 2019-2031
- 13. United Kingdom East Europe Renewable Energy Industry Analysis, Insights and Forecast, 2019-2031
- 14. Netherlands East Europe Renewable Energy Industry Analysis, Insights and Forecast, 2019-2031
- 15. Sweden East Europe Renewable Energy Industry Analysis, Insights and Forecast, 2019-2031
- 16. Rest of Europe East Europe Renewable Energy Industry Analysis, Insights and Forecast, 2019-2031
- 17. Competitive Analysis
- 17.1. Market Share Analysis 2024
- 17.2. Company Profiles
- 17.2.1 Vestas Wind Systems A/S
- 17.2.1.1. Overview
- 17.2.1.2. Products
- 17.2.1.3. SWOT Analysis
- 17.2.1.4. Recent Developments
- 17.2.1.5. Financials (Based on Availability)
- 17.2.2 NOTUS Energy GmbH
- 17.2.2.1. Overview
- 17.2.2.2. Products
- 17.2.2.3. SWOT Analysis
- 17.2.2.4. Recent Developments
- 17.2.2.5. Financials (Based on Availability)
- 17.2.3 Enel Green Power S p A
- 17.2.3.1. Overview
- 17.2.3.2. Products
- 17.2.3.3. SWOT Analysis
- 17.2.3.4. Recent Developments
- 17.2.3.5. Financials (Based on Availability)
- 17.2.4 Schneider Electric SE
- 17.2.4.1. Overview
- 17.2.4.2. Products
- 17.2.4.3. SWOT Analysis
- 17.2.4.4. Recent Developments
- 17.2.4.5. Financials (Based on Availability)
- 17.2.5 Hanwha Q Cells Co Ltd
- 17.2.5.1. Overview
- 17.2.5.2. Products
- 17.2.5.3. SWOT Analysis
- 17.2.5.4. Recent Developments
- 17.2.5.5. Financials (Based on Availability)
- 17.2.6 SGS SA
- 17.2.6.1. Overview
- 17.2.6.2. Products
- 17.2.6.3. SWOT Analysis
- 17.2.6.4. Recent Developments
- 17.2.6.5. Financials (Based on Availability)
- 17.2.7 Wärtsilä Oyj Abp
- 17.2.7.1. Overview
- 17.2.7.2. Products
- 17.2.7.3. SWOT Analysis
- 17.2.7.4. Recent Developments
- 17.2.7.5. Financials (Based on Availability)
- 17.2.8 Federal Hydro-Generating Co RusHydro PAO*List Not Exhaustive
- 17.2.8.1. Overview
- 17.2.8.2. Products
- 17.2.8.3. SWOT Analysis
- 17.2.8.4. Recent Developments
- 17.2.8.5. Financials (Based on Availability)
- 17.2.9 C&C Energy SRL
- 17.2.9.1. Overview
- 17.2.9.2. Products
- 17.2.9.3. SWOT Analysis
- 17.2.9.4. Recent Developments
- 17.2.9.5. Financials (Based on Availability)
- 17.2.1 Vestas Wind Systems A/S
List of Figures
- Figure 1: East Europe Renewable Energy Industry Revenue Breakdown (Million, %) by Product 2024 & 2032
- Figure 2: East Europe Renewable Energy Industry Share (%) by Company 2024
List of Tables
- Table 1: East Europe Renewable Energy Industry Revenue Million Forecast, by Region 2019 & 2032
- Table 2: East Europe Renewable Energy Industry Volume gigawatt Forecast, by Region 2019 & 2032
- Table 3: East Europe Renewable Energy Industry Revenue Million Forecast, by Type 2019 & 2032
- Table 4: East Europe Renewable Energy Industry Volume gigawatt Forecast, by Type 2019 & 2032
- Table 5: East Europe Renewable Energy Industry Revenue Million Forecast, by Geography 2019 & 2032
- Table 6: East Europe Renewable Energy Industry Volume gigawatt Forecast, by Geography 2019 & 2032
- Table 7: East Europe Renewable Energy Industry Revenue Million Forecast, by Region 2019 & 2032
- Table 8: East Europe Renewable Energy Industry Volume gigawatt Forecast, by Region 2019 & 2032
- Table 9: East Europe Renewable Energy Industry Revenue Million Forecast, by Country 2019 & 2032
- Table 10: East Europe Renewable Energy Industry Volume gigawatt Forecast, by Country 2019 & 2032
- Table 11: Germany East Europe Renewable Energy Industry Revenue (Million) Forecast, by Application 2019 & 2032
- Table 12: Germany East Europe Renewable Energy Industry Volume (gigawatt) Forecast, by Application 2019 & 2032
- Table 13: France East Europe Renewable Energy Industry Revenue (Million) Forecast, by Application 2019 & 2032
- Table 14: France East Europe Renewable Energy Industry Volume (gigawatt) Forecast, by Application 2019 & 2032
- Table 15: Italy East Europe Renewable Energy Industry Revenue (Million) Forecast, by Application 2019 & 2032
- Table 16: Italy East Europe Renewable Energy Industry Volume (gigawatt) Forecast, by Application 2019 & 2032
- Table 17: United Kingdom East Europe Renewable Energy Industry Revenue (Million) Forecast, by Application 2019 & 2032
- Table 18: United Kingdom East Europe Renewable Energy Industry Volume (gigawatt) Forecast, by Application 2019 & 2032
- Table 19: Netherlands East Europe Renewable Energy Industry Revenue (Million) Forecast, by Application 2019 & 2032
- Table 20: Netherlands East Europe Renewable Energy Industry Volume (gigawatt) Forecast, by Application 2019 & 2032
- Table 21: Sweden East Europe Renewable Energy Industry Revenue (Million) Forecast, by Application 2019 & 2032
- Table 22: Sweden East Europe Renewable Energy Industry Volume (gigawatt) Forecast, by Application 2019 & 2032
- Table 23: Rest of Europe East Europe Renewable Energy Industry Revenue (Million) Forecast, by Application 2019 & 2032
- Table 24: Rest of Europe East Europe Renewable Energy Industry Volume (gigawatt) Forecast, by Application 2019 & 2032
- Table 25: East Europe Renewable Energy Industry Revenue Million Forecast, by Type 2019 & 2032
- Table 26: East Europe Renewable Energy Industry Volume gigawatt Forecast, by Type 2019 & 2032
- Table 27: East Europe Renewable Energy Industry Revenue Million Forecast, by Geography 2019 & 2032
- Table 28: East Europe Renewable Energy Industry Volume gigawatt Forecast, by Geography 2019 & 2032
- Table 29: East Europe Renewable Energy Industry Revenue Million Forecast, by Country 2019 & 2032
- Table 30: East Europe Renewable Energy Industry Volume gigawatt Forecast, by Country 2019 & 2032
- Table 31: East Europe Renewable Energy Industry Revenue Million Forecast, by Type 2019 & 2032
- Table 32: East Europe Renewable Energy Industry Volume gigawatt Forecast, by Type 2019 & 2032
- Table 33: East Europe Renewable Energy Industry Revenue Million Forecast, by Geography 2019 & 2032
- Table 34: East Europe Renewable Energy Industry Volume gigawatt Forecast, by Geography 2019 & 2032
- Table 35: East Europe Renewable Energy Industry Revenue Million Forecast, by Country 2019 & 2032
- Table 36: East Europe Renewable Energy Industry Volume gigawatt Forecast, by Country 2019 & 2032
- Table 37: East Europe Renewable Energy Industry Revenue Million Forecast, by Type 2019 & 2032
- Table 38: East Europe Renewable Energy Industry Volume gigawatt Forecast, by Type 2019 & 2032
- Table 39: East Europe Renewable Energy Industry Revenue Million Forecast, by Geography 2019 & 2032
- Table 40: East Europe Renewable Energy Industry Volume gigawatt Forecast, by Geography 2019 & 2032
- Table 41: East Europe Renewable Energy Industry Revenue Million Forecast, by Country 2019 & 2032
- Table 42: East Europe Renewable Energy Industry Volume gigawatt Forecast, by Country 2019 & 2032
- Table 43: East Europe Renewable Energy Industry Revenue Million Forecast, by Type 2019 & 2032
- Table 44: East Europe Renewable Energy Industry Volume gigawatt Forecast, by Type 2019 & 2032
- Table 45: East Europe Renewable Energy Industry Revenue Million Forecast, by Geography 2019 & 2032
- Table 46: East Europe Renewable Energy Industry Volume gigawatt Forecast, by Geography 2019 & 2032
- Table 47: East Europe Renewable Energy Industry Revenue Million Forecast, by Country 2019 & 2032
- Table 48: East Europe Renewable Energy Industry Volume gigawatt Forecast, by Country 2019 & 2032
Frequently Asked Questions
1. What is the projected Compound Annual Growth Rate (CAGR) of the East Europe Renewable Energy Industry?
The projected CAGR is approximately > 4.50%.
2. Which companies are prominent players in the East Europe Renewable Energy Industry?
Key companies in the market include Vestas Wind Systems A/S, NOTUS Energy GmbH, Enel Green Power S p A, Schneider Electric SE, Hanwha Q Cells Co Ltd, SGS SA, Wärtsilä Oyj Abp, Federal Hydro-Generating Co RusHydro PAO*List Not Exhaustive, C&C Energy SRL.
3. What are the main segments of the East Europe Renewable Energy Industry?
The market segments include Type, Geography.
4. Can you provide details about the market size?
The market size is estimated to be USD XX Million as of 2022.
5. What are some drivers contributing to market growth?
4.; Increasing Investment in Upcoming Wind Power Projects4.; Favorable Government Policies.
6. What are the notable trends driving market growth?
Hydropower Segment to Dominate the Market.
7. Are there any restraints impacting market growth?
4.; The Growing Adoption of Alternative Energy Sources Such as Gas-Based Power.
8. Can you provide examples of recent developments in the market?
November 2022: investors submitted applications to Albania's Ministry of Infrastructure and Energy for the construction of three photovoltaic plants with a combined capacity of 151 MW, of which the largest one would have 93 MW.
9. What pricing options are available for accessing the report?
Pricing options include single-user, multi-user, and enterprise licenses priced at USD 4750, USD 5250, and USD 8750 respectively.
10. Is the market size provided in terms of value or volume?
The market size is provided in terms of value, measured in Million and volume, measured in gigawatt.
11. Are there any specific market keywords associated with the report?
Yes, the market keyword associated with the report is "East Europe Renewable Energy Industry," which aids in identifying and referencing the specific market segment covered.
12. How do I determine which pricing option suits my needs best?
The pricing options vary based on user requirements and access needs. Individual users may opt for single-user licenses, while businesses requiring broader access may choose multi-user or enterprise licenses for cost-effective access to the report.
13. Are there any additional resources or data provided in the East Europe Renewable Energy Industry report?
While the report offers comprehensive insights, it's advisable to review the specific contents or supplementary materials provided to ascertain if additional resources or data are available.
14. How can I stay updated on further developments or reports in the East Europe Renewable Energy Industry?
To stay informed about further developments, trends, and reports in the East Europe Renewable Energy Industry, consider subscribing to industry newsletters, following relevant companies and organizations, or regularly checking reputable industry news sources and publications.
Methodology
Step 1 - Identification of Relevant Samples Size from Population Database


Step 2 - Approaches for Defining Global Market Size (Value, Volume* & Price*)

Note*: In applicable scenarios
Step 3 - Data Sources
Primary Research
- Web Analytics
- Survey Reports
- Research Institute
- Latest Research Reports
- Opinion Leaders
Secondary Research
- Annual Reports
- White Paper
- Latest Press Release
- Industry Association
- Paid Database
- Investor Presentations

Step 4 - Data Triangulation
Involves using different sources of information in order to increase the validity of a study
These sources are likely to be stakeholders in a program - participants, other researchers, program staff, other community members, and so on.
Then we put all data in single framework & apply various statistical tools to find out the dynamic on the market.
During the analysis stage, feedback from the stakeholder groups would be compared to determine areas of agreement as well as areas of divergence


