
Key Insights
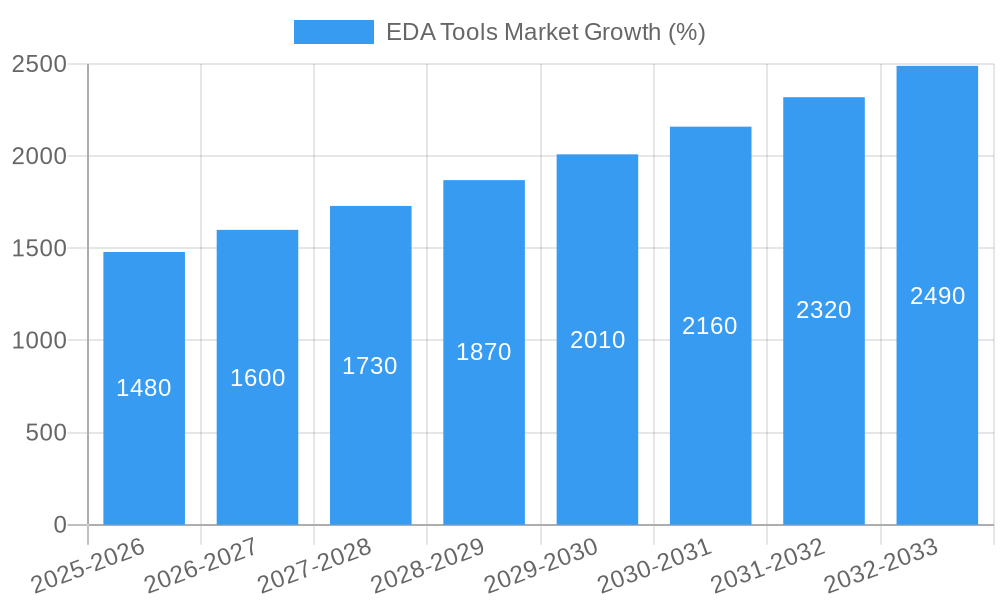
The Electronic Design Automation (EDA) tools market, valued at $17.72 billion in 2025, is projected to experience robust growth, driven by a Compound Annual Growth Rate (CAGR) of 8.46% from 2025 to 2033. This expansion is fueled by several key factors. The increasing complexity of integrated circuits (ICs) necessitates advanced EDA tools for efficient design and verification, particularly in high-growth sectors like automotive and consumer electronics. The rising adoption of 5G and the Internet of Things (IoT) further boosts demand for sophisticated EDA solutions capable of handling massive data volumes and complex system designs. Furthermore, the shift towards advanced packaging technologies, such as System-in-Package (SiP) and 3D integrated circuits, creates new opportunities for EDA vendors. The market's segmentation reflects this diversity, with Computer-aided Engineering (CAE), IC Physical Design and Verification, and PCB & MCM segments leading the charge. Key players like Ansys, Cadence, Synopsys, and Siemens' Mentor Graphics are actively innovating to meet these evolving needs, fostering competition and driving market expansion.
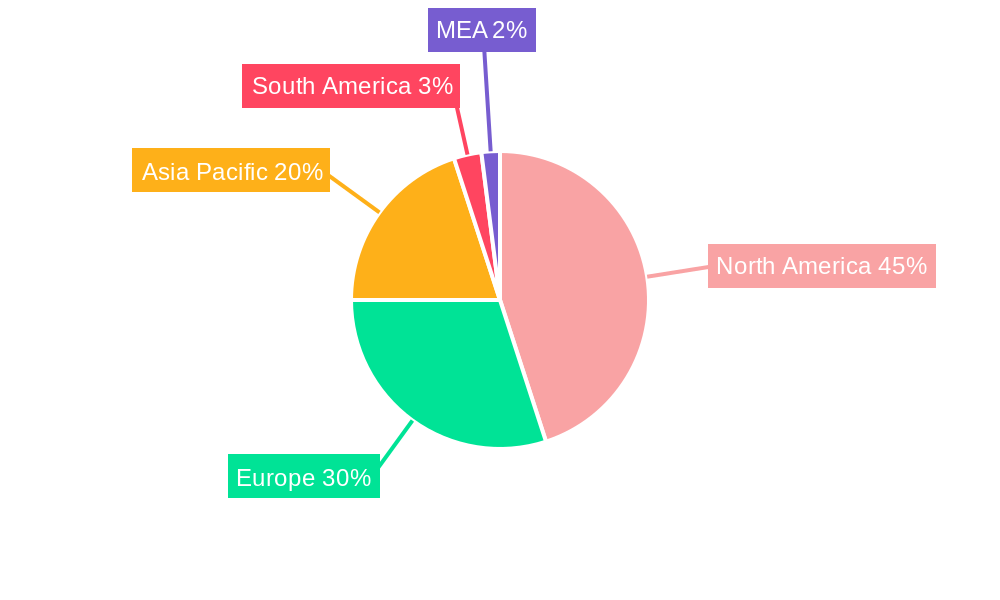
Significant regional variations exist, with North America currently dominating the market due to a strong presence of major EDA vendors and a high concentration of technology companies. However, Asia-Pacific, particularly China and India, is poised for significant growth due to increasing domestic semiconductor manufacturing capabilities and government initiatives promoting technological advancement. Europe also maintains a considerable market share driven by a robust automotive sector and established electronics industries. While the market faces some restraints, such as high software licensing costs and the need for specialized expertise, the overall outlook remains positive, with continued innovation and expanding applications across diverse sectors promising sustained growth throughout the forecast period. The continuous miniaturization of electronics and the development of cutting-edge technologies like Artificial Intelligence (AI) and machine learning within EDA tools further contribute to a positive market forecast.

EDA Tools Market: Comprehensive Report - 2019-2033
This in-depth report provides a comprehensive analysis of the EDA Tools market, encompassing historical data (2019-2024), current estimations (2025), and future projections (2025-2033). The report delves into market segmentation, competitive dynamics, growth drivers, challenges, and emerging opportunities, offering actionable insights for industry stakeholders. The market is valued at xx Million in 2025 and is projected to reach xx Million by 2033, exhibiting a CAGR of xx% during the forecast period.
EDA Tools Market Concentration & Innovation
The EDA tools market demonstrates a moderately concentrated landscape, with a few major players holding significant market share. However, the market also exhibits a high degree of innovation, driven by the constant need for improved design efficiency and faster time-to-market for electronic systems. Key players frequently engage in mergers and acquisitions (M&A) to expand their capabilities and market reach. The total value of M&A deals within the EDA tools sector from 2019-2024 is estimated to be xx Million.
- Market Share: The top 5 players collectively hold an estimated xx% market share, with individual player shares varying based on specific product categories and geographical regions. Exact figures are detailed within the full report.
- Innovation Drivers: The relentless push for miniaturization, increased performance, and lower power consumption in electronic devices fuels innovation in EDA tools. The emergence of new technologies like Artificial Intelligence (AI) and machine learning is further accelerating this trend.
- Regulatory Frameworks: Government regulations concerning data security, intellectual property, and environmental compliance influence the development and adoption of EDA tools. These regulations are impacting the EDA industry’s direction and market conditions.
- Product Substitutes: While there are no direct substitutes for sophisticated EDA tools, the use of simplified design methods or manual processes represent less efficient alternatives, especially for complex projects.
- End-User Trends: The increasing demand for high-performance computing (HPC) systems, the expansion of 5G networks, and growth in the automotive and industrial automation sectors are driving growth in the EDA tools market.
- M&A Activities: Recent significant M&A activity includes Cadence Design Systems' acquisition of Future Facilities in July 2022 (xx Million deal value), highlighting the consolidation trend within the industry and the strategic importance of expanding capabilities in areas like CFD analysis.
EDA Tools Market Industry Trends & Insights
The EDA tools market is experiencing significant growth fueled by several factors. The increasing complexity of electronic systems, coupled with the demand for faster design cycles and reduced development costs, are key drivers. Technological advancements, such as the integration of AI and machine learning into EDA software, are further enhancing design efficiency and accelerating time-to-market. Consumer preference for smaller, faster, and more energy-efficient devices also significantly impacts the industry. The competitive landscape is characterized by intense rivalry among major players, leading to continuous innovation and improvements in EDA tools. The market is witnessing a shift towards cloud-based EDA solutions, enabling better collaboration and accessibility. This trend is expected to continue, increasing the market's overall growth. The market penetration rate of cloud-based EDA solutions in 2025 is estimated to be approximately xx%.
Dominant Markets & Segments in EDA Tools Market
The Asia-Pacific region is currently the dominant market for EDA tools, driven by rapid growth in electronics manufacturing and semiconductor production within countries like China, South Korea, and Taiwan. North America also maintains a significant market share, due to a strong presence of major EDA tool vendors and a high concentration of technology companies.
Type:
- Computer-aided Engineering (CAE): This segment holds a significant market share due to the widespread use of CAE tools in various applications.
- IC Physical Design and Verification: Growing complexity of integrated circuits drives growth in this sector.
- Printed Circuit Board and Multi-chip Module (PCB and MCM): This segment shows steady growth driven by demand for high-density PCB designs.
- Semiconductor Intellectual Property (SIP): The increasing use of IP cores in IC design fuels this segment's growth.
- Services: The demand for consulting and support services associated with EDA tools ensures a significant market share for this segment.
Application:
- Communication: The expansion of 5G and other communication technologies is significantly boosting demand in this sector.
- Consumer Electronics: The ubiquitous presence of electronics in consumer products drives the need for efficient EDA tools.
- Automotive: The development of autonomous vehicles and advanced driver-assistance systems (ADAS) is fueling significant growth in this segment.
- Industrial: The growth of industrial automation and IoT is positively impacting the sector.
- Other Applications: This includes segments like aerospace and defense, medical devices, etc.
Key Drivers (Regional):
- Asia-Pacific: Strong government support for technology development, large consumer base, and expanding manufacturing capabilities contribute to the region's dominance.
- North America: A robust technology ecosystem, presence of major EDA vendors, and high R&D spending drive the market's growth.
- Europe: Growth in the automotive and industrial sectors, combined with increasing investments in R&D, contribute to the European market.
EDA Tools Market Product Developments
Recent advancements in EDA tools focus on incorporating AI/ML for improved design automation, enhanced simulation capabilities for complex systems, and cloud-based platforms for enhanced collaboration. These innovations improve design efficiency, reduce design cycles, and enable the development of more advanced electronic systems, leading to better market fit and competitive advantages.
Report Scope & Segmentation Analysis
This report comprehensively analyzes the EDA Tools market across various segments:
- Type: Computer-aided Engineering (CAE), IC Physical Design and Verification, Printed Circuit Board and Multi-chip Module (PCB and MCM), Semiconductor Intellectual Property (SIP), and Services. Each segment's growth projection, market size, and competitive dynamics are analyzed in detail.
- Application: Communication, Consumer Electronics, Automotive, Industrial, and Other Applications. Growth forecasts and competitive landscape analysis for each segment are provided. The report provides detailed market size estimations and growth projections for each application segment, highlighting the key competitive dynamics.
Key Drivers of EDA Tools Market Growth
The EDA tools market is experiencing robust growth driven by several key factors. The increasing complexity of electronic systems demands more efficient and sophisticated design tools. Advancements in semiconductor technology and the demand for higher performance, lower power consumption, and miniaturization further propel this growth. Furthermore, government initiatives and investments in technology development, particularly in key regions like Asia-Pacific, significantly support market expansion.
Challenges in the EDA Tools Market Sector
The EDA tools market faces challenges including high software costs, the need for specialized skills and training to operate advanced tools effectively, and intense competition among established and emerging players. Keeping up with rapid technological advancements is another significant challenge, necessitating continuous investment in research and development.
Emerging Opportunities in EDA Tools Market
Emerging opportunities lie in the integration of AI/ML into EDA tools for improved automation and design optimization, the development of cloud-based EDA platforms, and the expansion into new applications like quantum computing. The growing demand for specialized EDA tools in high-growth sectors like autonomous vehicles, 5G networks, and IoT also presents significant growth potential.
Leading Players in the EDA Tools Market Market
- Ansys Inc
- Aldec Inc
- Xilinx Inc
- Altium Limited
- Keysight Technologies Inc
- Mentor Graphic Corporation (Siemens PLM Software)
- Synopsys Inc
- Cadence Design Systems Inc
- Lauterbach GmbH
- Agnisys Inc
- Zuken Ltd
Key Developments in EDA Tools Market Industry
- July 2022: Cadence Design Systems, Inc. finalized the acquisition of Future Facilities, bolstering its capabilities in CFD and multiphysics system analysis.
- April 2022: Keysight Technologies, Inc. joined the Si2 TITAN advisory council, contributing its expertise in RF and microwave applications.
- May 2021: Siemens Digital Industries Software acquired Fractal Technologies, enhancing its IC verification offerings.
- May 2021: Keysight Technologies Inc. acquired Quantum Benchmark, expanding into quantum computing software solutions.
Strategic Outlook for EDA Tools Market Market
The EDA tools market is poised for continued growth, driven by technological advancements, expanding applications across various industries, and increasing demand for efficient and high-performance electronic systems. The integration of AI/ML, the adoption of cloud-based solutions, and the exploration of new applications like quantum computing will shape the future of this dynamic market, presenting lucrative opportunities for both established players and new entrants.
EDA Tools Market Segmentation
-
1. Type
- 1.1. Computer-aided Engineering (CAE)
- 1.2. IC Physical Design and Verification
- 1.3. Printed
- 1.4. Semiconductor Intellectual Property (SIP)
- 1.5. Services
-
2. Application
- 2.1. Communication
- 2.2. Consumer Electronics
- 2.3. Automotive
- 2.4. Industrial
- 2.5. Other Applications
-
3. End-user
- 3.1. Semiconductor manufacturers
- 3.2. Electronics manufacturers
- 3.3. Design houses
- 3.4. Research institutions
EDA Tools Market Segmentation By Geography
- 1. North America
- 2. Europe
- 3. Asia Pacific
- 4. Rest of the World
EDA Tools Market REPORT HIGHLIGHTS
| Aspects | Details |
|---|---|
| Study Period | 2019-2033 |
| Base Year | 2024 |
| Estimated Year | 2025 |
| Forecast Period | 2025-2033 |
| Historical Period | 2019-2024 |
| Growth Rate | CAGR of 8.46% from 2019-2033 |
| Segmentation |
|
Table of Contents
- 1. Introduction
- 1.1. Research Scope
- 1.2. Market Segmentation
- 1.3. Research Methodology
- 1.4. Definitions and Assumptions
- 2. Executive Summary
- 2.1. Introduction
- 3. Market Dynamics
- 3.1. Introduction
- 3.2. Market Drivers
- 3.2.1 Booming Automotive
- 3.2.2 IoT
- 3.2.3 and AI Sectors; Upcoming Trend of EDA Toolsets Equipped with Machine Learning Capabilities
- 3.3. Market Restrains
- 3.3.1. Moore's Law about to be Proven Faulty
- 3.4. Market Trends
- 3.4.1. IC Physical Design and Verification Segment to Grow Significantly
- 4. Market Factor Analysis
- 4.1. Porters Five Forces
- 4.2. Supply/Value Chain
- 4.3. PESTEL analysis
- 4.4. Market Entropy
- 4.5. Patent/Trademark Analysis
- 5. Global EDA Tools Market Analysis, Insights and Forecast, 2019-2031
- 5.1. Market Analysis, Insights and Forecast - by Type
- 5.1.1. Computer-aided Engineering (CAE)
- 5.1.2. IC Physical Design and Verification
- 5.1.3. Printed
- 5.1.4. Semiconductor Intellectual Property (SIP)
- 5.1.5. Services
- 5.2. Market Analysis, Insights and Forecast - by Application
- 5.2.1. Communication
- 5.2.2. Consumer Electronics
- 5.2.3. Automotive
- 5.2.4. Industrial
- 5.2.5. Other Applications
- 5.3. Market Analysis, Insights and Forecast - by End-user
- 5.3.1. Semiconductor manufacturers
- 5.3.2. Electronics manufacturers
- 5.3.3. Design houses
- 5.3.4. Research institutions
- 5.4. Market Analysis, Insights and Forecast - by Region
- 5.4.1. North America
- 5.4.2. Europe
- 5.4.3. Asia Pacific
- 5.4.4. Rest of the World
- 5.1. Market Analysis, Insights and Forecast - by Type
- 6. North America EDA Tools Market Analysis, Insights and Forecast, 2019-2031
- 6.1. Market Analysis, Insights and Forecast - by Type
- 6.1.1. Computer-aided Engineering (CAE)
- 6.1.2. IC Physical Design and Verification
- 6.1.3. Printed
- 6.1.4. Semiconductor Intellectual Property (SIP)
- 6.1.5. Services
- 6.2. Market Analysis, Insights and Forecast - by Application
- 6.2.1. Communication
- 6.2.2. Consumer Electronics
- 6.2.3. Automotive
- 6.2.4. Industrial
- 6.2.5. Other Applications
- 6.3. Market Analysis, Insights and Forecast - by End-user
- 6.3.1. Semiconductor manufacturers
- 6.3.2. Electronics manufacturers
- 6.3.3. Design houses
- 6.3.4. Research institutions
- 6.1. Market Analysis, Insights and Forecast - by Type
- 7. Europe EDA Tools Market Analysis, Insights and Forecast, 2019-2031
- 7.1. Market Analysis, Insights and Forecast - by Type
- 7.1.1. Computer-aided Engineering (CAE)
- 7.1.2. IC Physical Design and Verification
- 7.1.3. Printed
- 7.1.4. Semiconductor Intellectual Property (SIP)
- 7.1.5. Services
- 7.2. Market Analysis, Insights and Forecast - by Application
- 7.2.1. Communication
- 7.2.2. Consumer Electronics
- 7.2.3. Automotive
- 7.2.4. Industrial
- 7.2.5. Other Applications
- 7.3. Market Analysis, Insights and Forecast - by End-user
- 7.3.1. Semiconductor manufacturers
- 7.3.2. Electronics manufacturers
- 7.3.3. Design houses
- 7.3.4. Research institutions
- 7.1. Market Analysis, Insights and Forecast - by Type
- 8. Asia Pacific EDA Tools Market Analysis, Insights and Forecast, 2019-2031
- 8.1. Market Analysis, Insights and Forecast - by Type
- 8.1.1. Computer-aided Engineering (CAE)
- 8.1.2. IC Physical Design and Verification
- 8.1.3. Printed
- 8.1.4. Semiconductor Intellectual Property (SIP)
- 8.1.5. Services
- 8.2. Market Analysis, Insights and Forecast - by Application
- 8.2.1. Communication
- 8.2.2. Consumer Electronics
- 8.2.3. Automotive
- 8.2.4. Industrial
- 8.2.5. Other Applications
- 8.3. Market Analysis, Insights and Forecast - by End-user
- 8.3.1. Semiconductor manufacturers
- 8.3.2. Electronics manufacturers
- 8.3.3. Design houses
- 8.3.4. Research institutions
- 8.1. Market Analysis, Insights and Forecast - by Type
- 9. Rest of the World EDA Tools Market Analysis, Insights and Forecast, 2019-2031
- 9.1. Market Analysis, Insights and Forecast - by Type
- 9.1.1. Computer-aided Engineering (CAE)
- 9.1.2. IC Physical Design and Verification
- 9.1.3. Printed
- 9.1.4. Semiconductor Intellectual Property (SIP)
- 9.1.5. Services
- 9.2. Market Analysis, Insights and Forecast - by Application
- 9.2.1. Communication
- 9.2.2. Consumer Electronics
- 9.2.3. Automotive
- 9.2.4. Industrial
- 9.2.5. Other Applications
- 9.3. Market Analysis, Insights and Forecast - by End-user
- 9.3.1. Semiconductor manufacturers
- 9.3.2. Electronics manufacturers
- 9.3.3. Design houses
- 9.3.4. Research institutions
- 9.1. Market Analysis, Insights and Forecast - by Type
- 10. North America EDA Tools Market Analysis, Insights and Forecast, 2019-2031
- 10.1. Market Analysis, Insights and Forecast - By Country/Sub-region
- 10.1.1 United States
- 10.1.2 Canada
- 10.1.3 Mexico
- 11. Europe EDA Tools Market Analysis, Insights and Forecast, 2019-2031
- 11.1. Market Analysis, Insights and Forecast - By Country/Sub-region
- 11.1.1 Germany
- 11.1.2 United Kingdom
- 11.1.3 France
- 11.1.4 Spain
- 11.1.5 Italy
- 11.1.6 Spain
- 11.1.7 Belgium
- 11.1.8 Netherland
- 11.1.9 Nordics
- 11.1.10 Rest of Europe
- 12. Asia Pacific EDA Tools Market Analysis, Insights and Forecast, 2019-2031
- 12.1. Market Analysis, Insights and Forecast - By Country/Sub-region
- 12.1.1 China
- 12.1.2 Japan
- 12.1.3 India
- 12.1.4 South Korea
- 12.1.5 Southeast Asia
- 12.1.6 Australia
- 12.1.7 Indonesia
- 12.1.8 Phillipes
- 12.1.9 Singapore
- 12.1.10 Thailandc
- 12.1.11 Rest of Asia Pacific
- 13. South America EDA Tools Market Analysis, Insights and Forecast, 2019-2031
- 13.1. Market Analysis, Insights and Forecast - By Country/Sub-region
- 13.1.1 Brazil
- 13.1.2 Argentina
- 13.1.3 Peru
- 13.1.4 Chile
- 13.1.5 Colombia
- 13.1.6 Ecuador
- 13.1.7 Venezuela
- 13.1.8 Rest of South America
- 14. North America EDA Tools Market Analysis, Insights and Forecast, 2019-2031
- 14.1. Market Analysis, Insights and Forecast - By Country/Sub-region
- 14.1.1 United States
- 14.1.2 Canada
- 14.1.3 Mexico
- 15. MEA EDA Tools Market Analysis, Insights and Forecast, 2019-2031
- 15.1. Market Analysis, Insights and Forecast - By Country/Sub-region
- 15.1.1 United Arab Emirates
- 15.1.2 Saudi Arabia
- 15.1.3 South Africa
- 15.1.4 Rest of Middle East and Africa
- 16. Competitive Analysis
- 16.1. Global Market Share Analysis 2024
- 16.2. Company Profiles
- 16.2.1 Ansys Inc
- 16.2.1.1. Overview
- 16.2.1.2. Products
- 16.2.1.3. SWOT Analysis
- 16.2.1.4. Recent Developments
- 16.2.1.5. Financials (Based on Availability)
- 16.2.2 Aldec Inc
- 16.2.2.1. Overview
- 16.2.2.2. Products
- 16.2.2.3. SWOT Analysis
- 16.2.2.4. Recent Developments
- 16.2.2.5. Financials (Based on Availability)
- 16.2.3 Xilinx Inc
- 16.2.3.1. Overview
- 16.2.3.2. Products
- 16.2.3.3. SWOT Analysis
- 16.2.3.4. Recent Developments
- 16.2.3.5. Financials (Based on Availability)
- 16.2.4 Altium Limited
- 16.2.4.1. Overview
- 16.2.4.2. Products
- 16.2.4.3. SWOT Analysis
- 16.2.4.4. Recent Developments
- 16.2.4.5. Financials (Based on Availability)
- 16.2.5 Keysight Technologies Inc
- 16.2.5.1. Overview
- 16.2.5.2. Products
- 16.2.5.3. SWOT Analysis
- 16.2.5.4. Recent Developments
- 16.2.5.5. Financials (Based on Availability)
- 16.2.6 Mentor Graphic Corporation (Siemens PLM Software)
- 16.2.6.1. Overview
- 16.2.6.2. Products
- 16.2.6.3. SWOT Analysis
- 16.2.6.4. Recent Developments
- 16.2.6.5. Financials (Based on Availability)
- 16.2.7 Synopsys Inc
- 16.2.7.1. Overview
- 16.2.7.2. Products
- 16.2.7.3. SWOT Analysis
- 16.2.7.4. Recent Developments
- 16.2.7.5. Financials (Based on Availability)
- 16.2.8 Cadence Design Systems Inc
- 16.2.8.1. Overview
- 16.2.8.2. Products
- 16.2.8.3. SWOT Analysis
- 16.2.8.4. Recent Developments
- 16.2.8.5. Financials (Based on Availability)
- 16.2.9 Lauterbach GmbH
- 16.2.9.1. Overview
- 16.2.9.2. Products
- 16.2.9.3. SWOT Analysis
- 16.2.9.4. Recent Developments
- 16.2.9.5. Financials (Based on Availability)
- 16.2.10 Agnisys Inc
- 16.2.10.1. Overview
- 16.2.10.2. Products
- 16.2.10.3. SWOT Analysis
- 16.2.10.4. Recent Developments
- 16.2.10.5. Financials (Based on Availability)
- 16.2.11 Zuken Ltd
- 16.2.11.1. Overview
- 16.2.11.2. Products
- 16.2.11.3. SWOT Analysis
- 16.2.11.4. Recent Developments
- 16.2.11.5. Financials (Based on Availability)
- 16.2.1 Ansys Inc
List of Figures
- Figure 1: Global EDA Tools Market Revenue Breakdown (Million, %) by Region 2024 & 2032
- Figure 2: Global EDA Tools Market Volume Breakdown (K Unit, %) by Region 2024 & 2032
- Figure 3: North America EDA Tools Market Revenue (Million), by Country 2024 & 2032
- Figure 4: North America EDA Tools Market Volume (K Unit), by Country 2024 & 2032
- Figure 5: North America EDA Tools Market Revenue Share (%), by Country 2024 & 2032
- Figure 6: North America EDA Tools Market Volume Share (%), by Country 2024 & 2032
- Figure 7: Europe EDA Tools Market Revenue (Million), by Country 2024 & 2032
- Figure 8: Europe EDA Tools Market Volume (K Unit), by Country 2024 & 2032
- Figure 9: Europe EDA Tools Market Revenue Share (%), by Country 2024 & 2032
- Figure 10: Europe EDA Tools Market Volume Share (%), by Country 2024 & 2032
- Figure 11: Asia Pacific EDA Tools Market Revenue (Million), by Country 2024 & 2032
- Figure 12: Asia Pacific EDA Tools Market Volume (K Unit), by Country 2024 & 2032
- Figure 13: Asia Pacific EDA Tools Market Revenue Share (%), by Country 2024 & 2032
- Figure 14: Asia Pacific EDA Tools Market Volume Share (%), by Country 2024 & 2032
- Figure 15: South America EDA Tools Market Revenue (Million), by Country 2024 & 2032
- Figure 16: South America EDA Tools Market Volume (K Unit), by Country 2024 & 2032
- Figure 17: South America EDA Tools Market Revenue Share (%), by Country 2024 & 2032
- Figure 18: South America EDA Tools Market Volume Share (%), by Country 2024 & 2032
- Figure 19: North America EDA Tools Market Revenue (Million), by Country 2024 & 2032
- Figure 20: North America EDA Tools Market Volume (K Unit), by Country 2024 & 2032
- Figure 21: North America EDA Tools Market Revenue Share (%), by Country 2024 & 2032
- Figure 22: North America EDA Tools Market Volume Share (%), by Country 2024 & 2032
- Figure 23: MEA EDA Tools Market Revenue (Million), by Country 2024 & 2032
- Figure 24: MEA EDA Tools Market Volume (K Unit), by Country 2024 & 2032
- Figure 25: MEA EDA Tools Market Revenue Share (%), by Country 2024 & 2032
- Figure 26: MEA EDA Tools Market Volume Share (%), by Country 2024 & 2032
- Figure 27: North America EDA Tools Market Revenue (Million), by Type 2024 & 2032
- Figure 28: North America EDA Tools Market Volume (K Unit), by Type 2024 & 2032
- Figure 29: North America EDA Tools Market Revenue Share (%), by Type 2024 & 2032
- Figure 30: North America EDA Tools Market Volume Share (%), by Type 2024 & 2032
- Figure 31: North America EDA Tools Market Revenue (Million), by Application 2024 & 2032
- Figure 32: North America EDA Tools Market Volume (K Unit), by Application 2024 & 2032
- Figure 33: North America EDA Tools Market Revenue Share (%), by Application 2024 & 2032
- Figure 34: North America EDA Tools Market Volume Share (%), by Application 2024 & 2032
- Figure 35: North America EDA Tools Market Revenue (Million), by End-user 2024 & 2032
- Figure 36: North America EDA Tools Market Volume (K Unit), by End-user 2024 & 2032
- Figure 37: North America EDA Tools Market Revenue Share (%), by End-user 2024 & 2032
- Figure 38: North America EDA Tools Market Volume Share (%), by End-user 2024 & 2032
- Figure 39: North America EDA Tools Market Revenue (Million), by Country 2024 & 2032
- Figure 40: North America EDA Tools Market Volume (K Unit), by Country 2024 & 2032
- Figure 41: North America EDA Tools Market Revenue Share (%), by Country 2024 & 2032
- Figure 42: North America EDA Tools Market Volume Share (%), by Country 2024 & 2032
- Figure 43: Europe EDA Tools Market Revenue (Million), by Type 2024 & 2032
- Figure 44: Europe EDA Tools Market Volume (K Unit), by Type 2024 & 2032
- Figure 45: Europe EDA Tools Market Revenue Share (%), by Type 2024 & 2032
- Figure 46: Europe EDA Tools Market Volume Share (%), by Type 2024 & 2032
- Figure 47: Europe EDA Tools Market Revenue (Million), by Application 2024 & 2032
- Figure 48: Europe EDA Tools Market Volume (K Unit), by Application 2024 & 2032
- Figure 49: Europe EDA Tools Market Revenue Share (%), by Application 2024 & 2032
- Figure 50: Europe EDA Tools Market Volume Share (%), by Application 2024 & 2032
- Figure 51: Europe EDA Tools Market Revenue (Million), by End-user 2024 & 2032
- Figure 52: Europe EDA Tools Market Volume (K Unit), by End-user 2024 & 2032
- Figure 53: Europe EDA Tools Market Revenue Share (%), by End-user 2024 & 2032
- Figure 54: Europe EDA Tools Market Volume Share (%), by End-user 2024 & 2032
- Figure 55: Europe EDA Tools Market Revenue (Million), by Country 2024 & 2032
- Figure 56: Europe EDA Tools Market Volume (K Unit), by Country 2024 & 2032
- Figure 57: Europe EDA Tools Market Revenue Share (%), by Country 2024 & 2032
- Figure 58: Europe EDA Tools Market Volume Share (%), by Country 2024 & 2032
- Figure 59: Asia Pacific EDA Tools Market Revenue (Million), by Type 2024 & 2032
- Figure 60: Asia Pacific EDA Tools Market Volume (K Unit), by Type 2024 & 2032
- Figure 61: Asia Pacific EDA Tools Market Revenue Share (%), by Type 2024 & 2032
- Figure 62: Asia Pacific EDA Tools Market Volume Share (%), by Type 2024 & 2032
- Figure 63: Asia Pacific EDA Tools Market Revenue (Million), by Application 2024 & 2032
- Figure 64: Asia Pacific EDA Tools Market Volume (K Unit), by Application 2024 & 2032
- Figure 65: Asia Pacific EDA Tools Market Revenue Share (%), by Application 2024 & 2032
- Figure 66: Asia Pacific EDA Tools Market Volume Share (%), by Application 2024 & 2032
- Figure 67: Asia Pacific EDA Tools Market Revenue (Million), by End-user 2024 & 2032
- Figure 68: Asia Pacific EDA Tools Market Volume (K Unit), by End-user 2024 & 2032
- Figure 69: Asia Pacific EDA Tools Market Revenue Share (%), by End-user 2024 & 2032
- Figure 70: Asia Pacific EDA Tools Market Volume Share (%), by End-user 2024 & 2032
- Figure 71: Asia Pacific EDA Tools Market Revenue (Million), by Country 2024 & 2032
- Figure 72: Asia Pacific EDA Tools Market Volume (K Unit), by Country 2024 & 2032
- Figure 73: Asia Pacific EDA Tools Market Revenue Share (%), by Country 2024 & 2032
- Figure 74: Asia Pacific EDA Tools Market Volume Share (%), by Country 2024 & 2032
- Figure 75: Rest of the World EDA Tools Market Revenue (Million), by Type 2024 & 2032
- Figure 76: Rest of the World EDA Tools Market Volume (K Unit), by Type 2024 & 2032
- Figure 77: Rest of the World EDA Tools Market Revenue Share (%), by Type 2024 & 2032
- Figure 78: Rest of the World EDA Tools Market Volume Share (%), by Type 2024 & 2032
- Figure 79: Rest of the World EDA Tools Market Revenue (Million), by Application 2024 & 2032
- Figure 80: Rest of the World EDA Tools Market Volume (K Unit), by Application 2024 & 2032
- Figure 81: Rest of the World EDA Tools Market Revenue Share (%), by Application 2024 & 2032
- Figure 82: Rest of the World EDA Tools Market Volume Share (%), by Application 2024 & 2032
- Figure 83: Rest of the World EDA Tools Market Revenue (Million), by End-user 2024 & 2032
- Figure 84: Rest of the World EDA Tools Market Volume (K Unit), by End-user 2024 & 2032
- Figure 85: Rest of the World EDA Tools Market Revenue Share (%), by End-user 2024 & 2032
- Figure 86: Rest of the World EDA Tools Market Volume Share (%), by End-user 2024 & 2032
- Figure 87: Rest of the World EDA Tools Market Revenue (Million), by Country 2024 & 2032
- Figure 88: Rest of the World EDA Tools Market Volume (K Unit), by Country 2024 & 2032
- Figure 89: Rest of the World EDA Tools Market Revenue Share (%), by Country 2024 & 2032
- Figure 90: Rest of the World EDA Tools Market Volume Share (%), by Country 2024 & 2032
List of Tables
- Table 1: Global EDA Tools Market Revenue Million Forecast, by Region 2019 & 2032
- Table 2: Global EDA Tools Market Volume K Unit Forecast, by Region 2019 & 2032
- Table 3: Global EDA Tools Market Revenue Million Forecast, by Type 2019 & 2032
- Table 4: Global EDA Tools Market Volume K Unit Forecast, by Type 2019 & 2032
- Table 5: Global EDA Tools Market Revenue Million Forecast, by Application 2019 & 2032
- Table 6: Global EDA Tools Market Volume K Unit Forecast, by Application 2019 & 2032
- Table 7: Global EDA Tools Market Revenue Million Forecast, by End-user 2019 & 2032
- Table 8: Global EDA Tools Market Volume K Unit Forecast, by End-user 2019 & 2032
- Table 9: Global EDA Tools Market Revenue Million Forecast, by Region 2019 & 2032
- Table 10: Global EDA Tools Market Volume K Unit Forecast, by Region 2019 & 2032
- Table 11: Global EDA Tools Market Revenue Million Forecast, by Country 2019 & 2032
- Table 12: Global EDA Tools Market Volume K Unit Forecast, by Country 2019 & 2032
- Table 13: United States EDA Tools Market Revenue (Million) Forecast, by Application 2019 & 2032
- Table 14: United States EDA Tools Market Volume (K Unit) Forecast, by Application 2019 & 2032
- Table 15: Canada EDA Tools Market Revenue (Million) Forecast, by Application 2019 & 2032
- Table 16: Canada EDA Tools Market Volume (K Unit) Forecast, by Application 2019 & 2032
- Table 17: Mexico EDA Tools Market Revenue (Million) Forecast, by Application 2019 & 2032
- Table 18: Mexico EDA Tools Market Volume (K Unit) Forecast, by Application 2019 & 2032
- Table 19: Global EDA Tools Market Revenue Million Forecast, by Country 2019 & 2032
- Table 20: Global EDA Tools Market Volume K Unit Forecast, by Country 2019 & 2032
- Table 21: Germany EDA Tools Market Revenue (Million) Forecast, by Application 2019 & 2032
- Table 22: Germany EDA Tools Market Volume (K Unit) Forecast, by Application 2019 & 2032
- Table 23: United Kingdom EDA Tools Market Revenue (Million) Forecast, by Application 2019 & 2032
- Table 24: United Kingdom EDA Tools Market Volume (K Unit) Forecast, by Application 2019 & 2032
- Table 25: France EDA Tools Market Revenue (Million) Forecast, by Application 2019 & 2032
- Table 26: France EDA Tools Market Volume (K Unit) Forecast, by Application 2019 & 2032
- Table 27: Spain EDA Tools Market Revenue (Million) Forecast, by Application 2019 & 2032
- Table 28: Spain EDA Tools Market Volume (K Unit) Forecast, by Application 2019 & 2032
- Table 29: Italy EDA Tools Market Revenue (Million) Forecast, by Application 2019 & 2032
- Table 30: Italy EDA Tools Market Volume (K Unit) Forecast, by Application 2019 & 2032
- Table 31: Spain EDA Tools Market Revenue (Million) Forecast, by Application 2019 & 2032
- Table 32: Spain EDA Tools Market Volume (K Unit) Forecast, by Application 2019 & 2032
- Table 33: Belgium EDA Tools Market Revenue (Million) Forecast, by Application 2019 & 2032
- Table 34: Belgium EDA Tools Market Volume (K Unit) Forecast, by Application 2019 & 2032
- Table 35: Netherland EDA Tools Market Revenue (Million) Forecast, by Application 2019 & 2032
- Table 36: Netherland EDA Tools Market Volume (K Unit) Forecast, by Application 2019 & 2032
- Table 37: Nordics EDA Tools Market Revenue (Million) Forecast, by Application 2019 & 2032
- Table 38: Nordics EDA Tools Market Volume (K Unit) Forecast, by Application 2019 & 2032
- Table 39: Rest of Europe EDA Tools Market Revenue (Million) Forecast, by Application 2019 & 2032
- Table 40: Rest of Europe EDA Tools Market Volume (K Unit) Forecast, by Application 2019 & 2032
- Table 41: Global EDA Tools Market Revenue Million Forecast, by Country 2019 & 2032
- Table 42: Global EDA Tools Market Volume K Unit Forecast, by Country 2019 & 2032
- Table 43: China EDA Tools Market Revenue (Million) Forecast, by Application 2019 & 2032
- Table 44: China EDA Tools Market Volume (K Unit) Forecast, by Application 2019 & 2032
- Table 45: Japan EDA Tools Market Revenue (Million) Forecast, by Application 2019 & 2032
- Table 46: Japan EDA Tools Market Volume (K Unit) Forecast, by Application 2019 & 2032
- Table 47: India EDA Tools Market Revenue (Million) Forecast, by Application 2019 & 2032
- Table 48: India EDA Tools Market Volume (K Unit) Forecast, by Application 2019 & 2032
- Table 49: South Korea EDA Tools Market Revenue (Million) Forecast, by Application 2019 & 2032
- Table 50: South Korea EDA Tools Market Volume (K Unit) Forecast, by Application 2019 & 2032
- Table 51: Southeast Asia EDA Tools Market Revenue (Million) Forecast, by Application 2019 & 2032
- Table 52: Southeast Asia EDA Tools Market Volume (K Unit) Forecast, by Application 2019 & 2032
- Table 53: Australia EDA Tools Market Revenue (Million) Forecast, by Application 2019 & 2032
- Table 54: Australia EDA Tools Market Volume (K Unit) Forecast, by Application 2019 & 2032
- Table 55: Indonesia EDA Tools Market Revenue (Million) Forecast, by Application 2019 & 2032
- Table 56: Indonesia EDA Tools Market Volume (K Unit) Forecast, by Application 2019 & 2032
- Table 57: Phillipes EDA Tools Market Revenue (Million) Forecast, by Application 2019 & 2032
- Table 58: Phillipes EDA Tools Market Volume (K Unit) Forecast, by Application 2019 & 2032
- Table 59: Singapore EDA Tools Market Revenue (Million) Forecast, by Application 2019 & 2032
- Table 60: Singapore EDA Tools Market Volume (K Unit) Forecast, by Application 2019 & 2032
- Table 61: Thailandc EDA Tools Market Revenue (Million) Forecast, by Application 2019 & 2032
- Table 62: Thailandc EDA Tools Market Volume (K Unit) Forecast, by Application 2019 & 2032
- Table 63: Rest of Asia Pacific EDA Tools Market Revenue (Million) Forecast, by Application 2019 & 2032
- Table 64: Rest of Asia Pacific EDA Tools Market Volume (K Unit) Forecast, by Application 2019 & 2032
- Table 65: Global EDA Tools Market Revenue Million Forecast, by Country 2019 & 2032
- Table 66: Global EDA Tools Market Volume K Unit Forecast, by Country 2019 & 2032
- Table 67: Brazil EDA Tools Market Revenue (Million) Forecast, by Application 2019 & 2032
- Table 68: Brazil EDA Tools Market Volume (K Unit) Forecast, by Application 2019 & 2032
- Table 69: Argentina EDA Tools Market Revenue (Million) Forecast, by Application 2019 & 2032
- Table 70: Argentina EDA Tools Market Volume (K Unit) Forecast, by Application 2019 & 2032
- Table 71: Peru EDA Tools Market Revenue (Million) Forecast, by Application 2019 & 2032
- Table 72: Peru EDA Tools Market Volume (K Unit) Forecast, by Application 2019 & 2032
- Table 73: Chile EDA Tools Market Revenue (Million) Forecast, by Application 2019 & 2032
- Table 74: Chile EDA Tools Market Volume (K Unit) Forecast, by Application 2019 & 2032
- Table 75: Colombia EDA Tools Market Revenue (Million) Forecast, by Application 2019 & 2032
- Table 76: Colombia EDA Tools Market Volume (K Unit) Forecast, by Application 2019 & 2032
- Table 77: Ecuador EDA Tools Market Revenue (Million) Forecast, by Application 2019 & 2032
- Table 78: Ecuador EDA Tools Market Volume (K Unit) Forecast, by Application 2019 & 2032
- Table 79: Venezuela EDA Tools Market Revenue (Million) Forecast, by Application 2019 & 2032
- Table 80: Venezuela EDA Tools Market Volume (K Unit) Forecast, by Application 2019 & 2032
- Table 81: Rest of South America EDA Tools Market Revenue (Million) Forecast, by Application 2019 & 2032
- Table 82: Rest of South America EDA Tools Market Volume (K Unit) Forecast, by Application 2019 & 2032
- Table 83: Global EDA Tools Market Revenue Million Forecast, by Country 2019 & 2032
- Table 84: Global EDA Tools Market Volume K Unit Forecast, by Country 2019 & 2032
- Table 85: United States EDA Tools Market Revenue (Million) Forecast, by Application 2019 & 2032
- Table 86: United States EDA Tools Market Volume (K Unit) Forecast, by Application 2019 & 2032
- Table 87: Canada EDA Tools Market Revenue (Million) Forecast, by Application 2019 & 2032
- Table 88: Canada EDA Tools Market Volume (K Unit) Forecast, by Application 2019 & 2032
- Table 89: Mexico EDA Tools Market Revenue (Million) Forecast, by Application 2019 & 2032
- Table 90: Mexico EDA Tools Market Volume (K Unit) Forecast, by Application 2019 & 2032
- Table 91: Global EDA Tools Market Revenue Million Forecast, by Country 2019 & 2032
- Table 92: Global EDA Tools Market Volume K Unit Forecast, by Country 2019 & 2032
- Table 93: United Arab Emirates EDA Tools Market Revenue (Million) Forecast, by Application 2019 & 2032
- Table 94: United Arab Emirates EDA Tools Market Volume (K Unit) Forecast, by Application 2019 & 2032
- Table 95: Saudi Arabia EDA Tools Market Revenue (Million) Forecast, by Application 2019 & 2032
- Table 96: Saudi Arabia EDA Tools Market Volume (K Unit) Forecast, by Application 2019 & 2032
- Table 97: South Africa EDA Tools Market Revenue (Million) Forecast, by Application 2019 & 2032
- Table 98: South Africa EDA Tools Market Volume (K Unit) Forecast, by Application 2019 & 2032
- Table 99: Rest of Middle East and Africa EDA Tools Market Revenue (Million) Forecast, by Application 2019 & 2032
- Table 100: Rest of Middle East and Africa EDA Tools Market Volume (K Unit) Forecast, by Application 2019 & 2032
- Table 101: Global EDA Tools Market Revenue Million Forecast, by Type 2019 & 2032
- Table 102: Global EDA Tools Market Volume K Unit Forecast, by Type 2019 & 2032
- Table 103: Global EDA Tools Market Revenue Million Forecast, by Application 2019 & 2032
- Table 104: Global EDA Tools Market Volume K Unit Forecast, by Application 2019 & 2032
- Table 105: Global EDA Tools Market Revenue Million Forecast, by End-user 2019 & 2032
- Table 106: Global EDA Tools Market Volume K Unit Forecast, by End-user 2019 & 2032
- Table 107: Global EDA Tools Market Revenue Million Forecast, by Country 2019 & 2032
- Table 108: Global EDA Tools Market Volume K Unit Forecast, by Country 2019 & 2032
- Table 109: Global EDA Tools Market Revenue Million Forecast, by Type 2019 & 2032
- Table 110: Global EDA Tools Market Volume K Unit Forecast, by Type 2019 & 2032
- Table 111: Global EDA Tools Market Revenue Million Forecast, by Application 2019 & 2032
- Table 112: Global EDA Tools Market Volume K Unit Forecast, by Application 2019 & 2032
- Table 113: Global EDA Tools Market Revenue Million Forecast, by End-user 2019 & 2032
- Table 114: Global EDA Tools Market Volume K Unit Forecast, by End-user 2019 & 2032
- Table 115: Global EDA Tools Market Revenue Million Forecast, by Country 2019 & 2032
- Table 116: Global EDA Tools Market Volume K Unit Forecast, by Country 2019 & 2032
- Table 117: Global EDA Tools Market Revenue Million Forecast, by Type 2019 & 2032
- Table 118: Global EDA Tools Market Volume K Unit Forecast, by Type 2019 & 2032
- Table 119: Global EDA Tools Market Revenue Million Forecast, by Application 2019 & 2032
- Table 120: Global EDA Tools Market Volume K Unit Forecast, by Application 2019 & 2032
- Table 121: Global EDA Tools Market Revenue Million Forecast, by End-user 2019 & 2032
- Table 122: Global EDA Tools Market Volume K Unit Forecast, by End-user 2019 & 2032
- Table 123: Global EDA Tools Market Revenue Million Forecast, by Country 2019 & 2032
- Table 124: Global EDA Tools Market Volume K Unit Forecast, by Country 2019 & 2032
- Table 125: Global EDA Tools Market Revenue Million Forecast, by Type 2019 & 2032
- Table 126: Global EDA Tools Market Volume K Unit Forecast, by Type 2019 & 2032
- Table 127: Global EDA Tools Market Revenue Million Forecast, by Application 2019 & 2032
- Table 128: Global EDA Tools Market Volume K Unit Forecast, by Application 2019 & 2032
- Table 129: Global EDA Tools Market Revenue Million Forecast, by End-user 2019 & 2032
- Table 130: Global EDA Tools Market Volume K Unit Forecast, by End-user 2019 & 2032
- Table 131: Global EDA Tools Market Revenue Million Forecast, by Country 2019 & 2032
- Table 132: Global EDA Tools Market Volume K Unit Forecast, by Country 2019 & 2032
Frequently Asked Questions
1. What is the projected Compound Annual Growth Rate (CAGR) of the EDA Tools Market?
The projected CAGR is approximately 8.46%.
2. Which companies are prominent players in the EDA Tools Market?
Key companies in the market include Ansys Inc, Aldec Inc, Xilinx Inc, Altium Limited, Keysight Technologies Inc, Mentor Graphic Corporation (Siemens PLM Software), Synopsys Inc, Cadence Design Systems Inc, Lauterbach GmbH, Agnisys Inc, Zuken Ltd.
3. What are the main segments of the EDA Tools Market?
The market segments include Type, Application, End-user .
4. Can you provide details about the market size?
The market size is estimated to be USD 17.72 Million as of 2022.
5. What are some drivers contributing to market growth?
Booming Automotive. IoT. and AI Sectors; Upcoming Trend of EDA Toolsets Equipped with Machine Learning Capabilities.
6. What are the notable trends driving market growth?
IC Physical Design and Verification Segment to Grow Significantly.
7. Are there any restraints impacting market growth?
Moore's Law about to be Proven Faulty.
8. Can you provide examples of recent developments in the market?
July 2022 - Future Facilities' acquisition by Cadence Design Systems, Inc. has been finalized, the company announced. The inclusion of Future Facilities technologies and experience bolsters Cadence's approach to intelligent system design and expands its capabilities in computational fluid dynamics (CFD) and multiphysics system analysis. Leading technology companies can make wise business decisions about data center design, operations, and lifecycle management and lessen their carbon footprint thanks to Future Facilities' electronics cooling analysis and energy performance optimization solutions for data center design and operation using physics-based 3D digital twins.
9. What pricing options are available for accessing the report?
Pricing options include single-user, multi-user, and enterprise licenses priced at USD 4750, USD 5250, and USD 8750 respectively.
10. Is the market size provided in terms of value or volume?
The market size is provided in terms of value, measured in Million and volume, measured in K Unit.
11. Are there any specific market keywords associated with the report?
Yes, the market keyword associated with the report is "EDA Tools Market," which aids in identifying and referencing the specific market segment covered.
12. How do I determine which pricing option suits my needs best?
The pricing options vary based on user requirements and access needs. Individual users may opt for single-user licenses, while businesses requiring broader access may choose multi-user or enterprise licenses for cost-effective access to the report.
13. Are there any additional resources or data provided in the EDA Tools Market report?
While the report offers comprehensive insights, it's advisable to review the specific contents or supplementary materials provided to ascertain if additional resources or data are available.
14. How can I stay updated on further developments or reports in the EDA Tools Market?
To stay informed about further developments, trends, and reports in the EDA Tools Market, consider subscribing to industry newsletters, following relevant companies and organizations, or regularly checking reputable industry news sources and publications.
Methodology
Step 1 - Identification of Relevant Samples Size from Population Database


Step 2 - Approaches for Defining Global Market Size (Value, Volume* & Price*)

Note*: In applicable scenarios
Step 3 - Data Sources
Primary Research
- Web Analytics
- Survey Reports
- Research Institute
- Latest Research Reports
- Opinion Leaders
Secondary Research
- Annual Reports
- White Paper
- Latest Press Release
- Industry Association
- Paid Database
- Investor Presentations

Step 4 - Data Triangulation
Involves using different sources of information in order to increase the validity of a study
These sources are likely to be stakeholders in a program - participants, other researchers, program staff, other community members, and so on.
Then we put all data in single framework & apply various statistical tools to find out the dynamic on the market.
During the analysis stage, feedback from the stakeholder groups would be compared to determine areas of agreement as well as areas of divergence


