
Key Insights
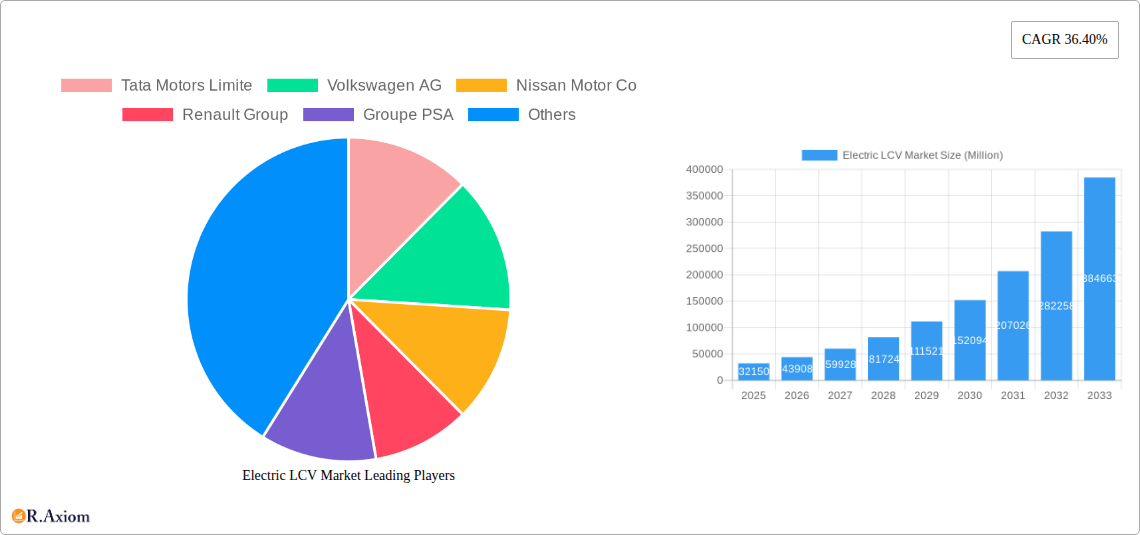
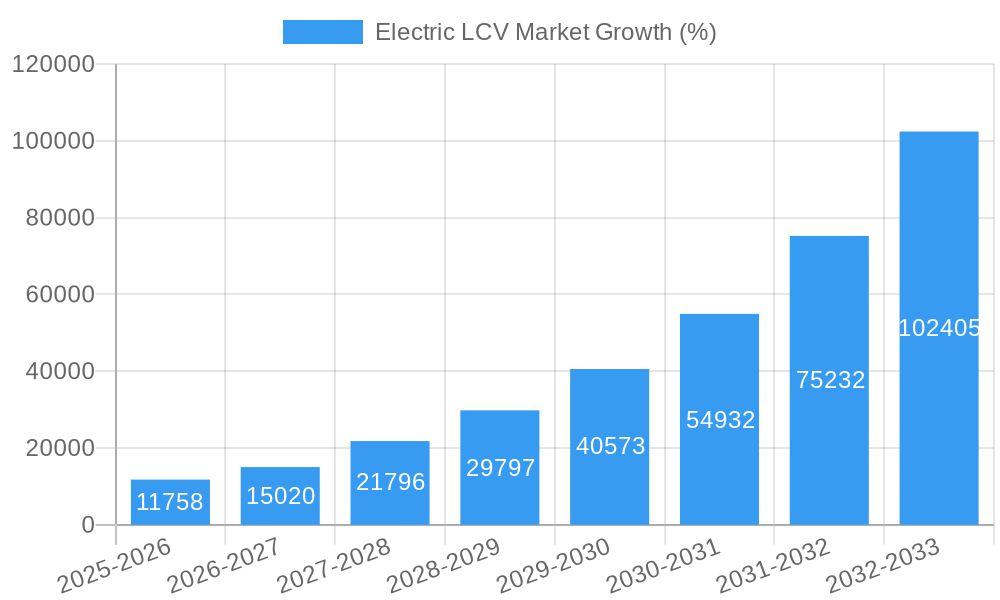
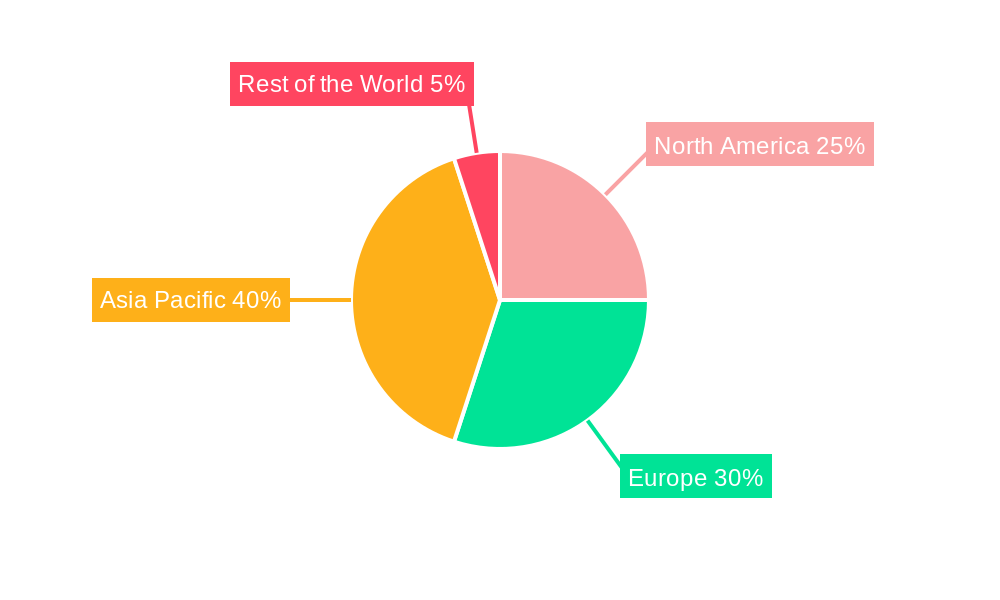
The Electric Light Commercial Vehicle (LCV) market is experiencing explosive growth, projected to reach \$32.15 billion in 2025 and exhibiting a remarkable Compound Annual Growth Rate (CAGR) of 36.40% from 2025 to 2033. Several factors fuel this expansion. Stringent emission regulations globally are driving the adoption of electric vehicles, including LCVs, to reduce carbon footprints and improve air quality in urban areas. Furthermore, advancements in battery technology, resulting in increased range and reduced charging times, are making electric LCVs a more practical and attractive option for businesses. Government incentives and subsidies are also playing a crucial role, encouraging both manufacturers and consumers to embrace electric mobility. The market is segmented by propulsion type (BEV, HEV, FCEV), vehicle type (van, pick-up truck), and power output (less than 100 kW, 100-250 kW, more than 250 kW). While Battery Electric Vehicles (BEVs) currently dominate, Fuel Cell Electric Vehicles (FCEVs) are expected to gain traction in the coming years, particularly for long-haul applications. The Asia Pacific region, particularly China and India, is anticipated to be a significant growth driver due to increasing urbanization, expanding e-commerce sectors, and supportive government policies. Major players like Tata Motors, Volkswagen, and Tesla are strategically investing in this market, expanding their product portfolios and strengthening their distribution networks to meet the rising demand. However, challenges such as high initial purchase costs, limited charging infrastructure, and concerns about battery lifespan and replacement remain.
The continued growth of the Electric LCV market is contingent upon overcoming infrastructural hurdles and addressing consumer concerns. The expansion of charging infrastructure, particularly in underserved areas, is crucial for wider adoption. Technological advancements focusing on longer battery life, faster charging capabilities, and improved battery recycling processes will further enhance the appeal of electric LCVs. Furthermore, innovative financing options and leasing programs can help mitigate the high initial investment costs. Competition among manufacturers is fierce, driving innovation and pushing down prices. As technology advances and economies of scale are realized, the cost of electric LCVs is expected to decline, making them increasingly competitive with traditional internal combustion engine vehicles. The future of the Electric LCV market appears bright, driven by environmental concerns, technological progress, and supportive government policies. The market is poised for significant expansion in the next decade.
Electric LCV Market: A Comprehensive Analysis 2019-2033
This in-depth report provides a comprehensive analysis of the Electric Light Commercial Vehicle (LCV) market, offering invaluable insights for stakeholders across the industry. Covering the period 2019-2033, with a focus on 2025, this report meticulously examines market dynamics, technological advancements, competitive landscapes, and future growth projections. The study incorporates detailed segmentation analysis, covering propulsion types (BEV, HEV, FCEV), vehicle types (Van, Pick-up Truck), and power output (Less Than 100 kW, 100-250 kW, More Than 250 kW). Key players analyzed include Tata Motors Limited, Volkswagen AG, Nissan Motor Co, Renault Group, Groupe PSA, Mahindra and Mahindra Ltd, BYD Group, Tesla Inc, Arrival Ltd, Rivian Automotive, and BAIC Group.
Electric LCV Market Concentration & Innovation
The Electric LCV market exhibits a moderately concentrated landscape, with established automotive giants and emerging EV startups vying for market share. The market share of the top 5 players in 2025 is estimated at xx%. Innovation is driven by advancements in battery technology, charging infrastructure, and autonomous driving capabilities. Stringent emission regulations globally are accelerating the adoption of electric LCVs. Product substitutes, such as CNG and hybrid vehicles, continue to pose competition, though their environmental impact and long-term cost-effectiveness are increasingly questioned. End-user trends point towards a preference for efficient, cost-effective, and environmentally friendly vehicles. M&A activities within the sector are also on the rise, with xx Million in deals recorded between 2021 and 2024. Key players are focusing on strategic acquisitions to expand their product portfolios and geographic reach.
- Market Concentration: Top 5 players hold xx% market share in 2025.
- Innovation Drivers: Battery technology, charging infrastructure, autonomous driving.
- Regulatory Frameworks: Stringent emission norms are pushing adoption.
- M&A Activity: xx Million in deal value between 2021 and 2024.
Electric LCV Market Industry Trends & Insights
The Electric LCV market is experiencing robust growth, fueled by several key factors. Government incentives, growing environmental awareness, and declining battery costs are major catalysts. Technological advancements, such as improved battery range and faster charging times, are further boosting market penetration. Consumer preferences are shifting towards electric vehicles due to their lower running costs and reduced environmental impact. Competitive dynamics are intense, with established automakers and new entrants vying for market leadership. The market is expected to witness a CAGR of xx% during the forecast period (2025-2033), with market penetration reaching xx% by 2033. Technological disruptions, such as solid-state batteries and advanced charging technologies, are poised to revolutionize the industry in the coming years. The transition to electric LCVs is being aided by significant investments in charging infrastructure and supportive government policies worldwide.
Dominant Markets & Segments in Electric LCV Market
The dominant segment in the Electric LCV market in 2025 is projected to be BEV (Battery Electric Vehicles) vans in the 100-250 kW power output range. Europe is expected to be the leading region, driven by supportive policies and a strong focus on emission reduction targets.
By Propulsion Type: BEV dominates, followed by HEV, with FCEV showing slower growth.
By Vehicle Type: Vans hold a larger market share than pick-up trucks.
By Power Output: The 100-250 kW segment displays the highest demand.
Key Drivers (Europe): Strong environmental regulations, government incentives, and robust charging infrastructure.
Key Drivers (Other Regions): Varying economic policies, level of government support and consumer purchasing power.
Electric LCV Market Product Developments
Significant advancements are underway in battery technology, increasing energy density and lowering costs. Improved motor efficiency and lightweight materials are enhancing vehicle performance and range. Smart connectivity features, telematics systems, and autonomous driving capabilities are becoming increasingly integrated into electric LCVs, creating competitive advantages and improved operational efficiency. These developments cater to evolving customer demands for safer, more efficient, and technologically advanced vehicles.
Report Scope & Segmentation Analysis
This report segments the Electric LCV market based on propulsion type (BEV, HEV, FCEV), vehicle type (Van, Pick-up Truck), and power output (Less than 100 kW, 100-250 kW, More than 250 kW). Each segment's market size, growth projections, and competitive dynamics are comprehensively analyzed. The BEV segment is expected to witness the most significant growth. Vans are projected to dominate the vehicle type segment, while the 100-250 kW power output range is expected to hold the largest market share in 2025.
Key Drivers of Electric LCV Market Growth
The electric LCV market is propelled by stringent emission regulations, government incentives like tax breaks and subsidies, growing environmental awareness among consumers, decreasing battery prices, and advancements in battery technology enhancing range and performance. Furthermore, investments in charging infrastructure and supportive policies from governments worldwide accelerate the transition to electric vehicles.
Challenges in the Electric LCV Market Sector
Challenges include the high initial cost of electric LCVs, concerns about range anxiety and charging time, limited charging infrastructure in certain regions, and the reliance on raw materials for battery production which can face supply chain disruptions. These factors, coupled with competition from traditional fuel-powered vehicles, present significant hurdles to market penetration. The total impact of these challenges is estimated to reduce the market size by approximately xx Million in 2025.
Emerging Opportunities in Electric LCV Market
Emerging opportunities lie in the development of advanced battery technologies like solid-state batteries, expanding charging infrastructure, particularly in underserved regions, and integrating smart technologies such as telematics and autonomous driving features. The expansion into new markets, particularly in developing economies with growing transportation needs, presents significant growth potential. Furthermore, exploring innovative business models like battery leasing or subscription services can broaden market access.
Leading Players in the Electric LCV Market Market
- Tata Motors Limited
- Volkswagen AG
- Nissan Motor Co
- Renault Group
- Groupe PSA
- Mahindra and Mahindra Ltd
- BYD Group
- Tesla Inc
- Arrival Ltd
- Rivian Automotive
- BAIC Group
Key Developments in Electric LCV Market Industry
- January 2023: BYD launched its new electric van model, expanding its product portfolio.
- March 2024: Tata Motors and a major logistics company announced a partnership to deploy 1000 electric LCVs.
- June 2024: Volkswagen AG invested xx Million in expanding its electric LCV production facility.
Strategic Outlook for Electric LCV Market Market
The Electric LCV market is poised for significant growth over the next decade, driven by technological advancements, supportive government policies, and increasing environmental awareness. The focus on improving battery technology, expanding charging infrastructure, and developing innovative business models will be crucial for unlocking the market's full potential. The market is anticipated to expand significantly, offering attractive opportunities for both established players and new entrants alike.
Electric LCV Market Segmentation
-
1. Propulsion Type
- 1.1. BEV
- 1.2. HEV
- 1.3. FCEV
-
2. Vehicle Type
- 2.1. Van
- 2.2. Pick-up Truck
-
3. Power Output
- 3.1. Less Than 100 kW
- 3.2. 100 -250 kW
- 3.3. More Than 250 kW
Electric LCV Market Segmentation By Geography
-
1. North America
- 1.1. United States
- 1.2. Canada
- 1.3. Rest of North America
-
2. Europe
- 2.1. Germany
- 2.2. United Kingdom
- 2.3. France
- 2.4. Rest of Europe
-
3. Asia Pacific
- 3.1. India
- 3.2. China
- 3.3. Japan
- 3.4. South Korea
- 3.5. Rest of Asia Pacific
-
4. Rest of the World
- 4.1. Brazil
- 4.2. Mexico
- 4.3. United Arab Emirates
- 4.4. Other Countries
Electric LCV Market REPORT HIGHLIGHTS
| Aspects | Details |
|---|---|
| Study Period | 2019-2033 |
| Base Year | 2024 |
| Estimated Year | 2025 |
| Forecast Period | 2025-2033 |
| Historical Period | 2019-2024 |
| Growth Rate | CAGR of 36.40% from 2019-2033 |
| Segmentation |
|
Table of Contents
- 1. Introduction
- 1.1. Research Scope
- 1.2. Market Segmentation
- 1.3. Research Methodology
- 1.4. Definitions and Assumptions
- 2. Executive Summary
- 2.1. Introduction
- 3. Market Dynamics
- 3.1. Introduction
- 3.2. Market Drivers
- 3.2.1. Growing Travel and Tourism Industry is Driving the Car Rental Market
- 3.3. Market Restrains
- 3.3.1. Increasing Popularity of Ride-Sharing Services Pose Challenges for the Conventional Car Rental Market
- 3.4. Market Trends
- 3.4.1. Electric Van is Leading the Electric LCV Market
- 4. Market Factor Analysis
- 4.1. Porters Five Forces
- 4.2. Supply/Value Chain
- 4.3. PESTEL analysis
- 4.4. Market Entropy
- 4.5. Patent/Trademark Analysis
- 5. Global Electric LCV Market Analysis, Insights and Forecast, 2019-2031
- 5.1. Market Analysis, Insights and Forecast - by Propulsion Type
- 5.1.1. BEV
- 5.1.2. HEV
- 5.1.3. FCEV
- 5.2. Market Analysis, Insights and Forecast - by Vehicle Type
- 5.2.1. Van
- 5.2.2. Pick-up Truck
- 5.3. Market Analysis, Insights and Forecast - by Power Output
- 5.3.1. Less Than 100 kW
- 5.3.2. 100 -250 kW
- 5.3.3. More Than 250 kW
- 5.4. Market Analysis, Insights and Forecast - by Region
- 5.4.1. North America
- 5.4.2. Europe
- 5.4.3. Asia Pacific
- 5.4.4. Rest of the World
- 5.1. Market Analysis, Insights and Forecast - by Propulsion Type
- 6. North America Electric LCV Market Analysis, Insights and Forecast, 2019-2031
- 6.1. Market Analysis, Insights and Forecast - by Propulsion Type
- 6.1.1. BEV
- 6.1.2. HEV
- 6.1.3. FCEV
- 6.2. Market Analysis, Insights and Forecast - by Vehicle Type
- 6.2.1. Van
- 6.2.2. Pick-up Truck
- 6.3. Market Analysis, Insights and Forecast - by Power Output
- 6.3.1. Less Than 100 kW
- 6.3.2. 100 -250 kW
- 6.3.3. More Than 250 kW
- 6.1. Market Analysis, Insights and Forecast - by Propulsion Type
- 7. Europe Electric LCV Market Analysis, Insights and Forecast, 2019-2031
- 7.1. Market Analysis, Insights and Forecast - by Propulsion Type
- 7.1.1. BEV
- 7.1.2. HEV
- 7.1.3. FCEV
- 7.2. Market Analysis, Insights and Forecast - by Vehicle Type
- 7.2.1. Van
- 7.2.2. Pick-up Truck
- 7.3. Market Analysis, Insights and Forecast - by Power Output
- 7.3.1. Less Than 100 kW
- 7.3.2. 100 -250 kW
- 7.3.3. More Than 250 kW
- 7.1. Market Analysis, Insights and Forecast - by Propulsion Type
- 8. Asia Pacific Electric LCV Market Analysis, Insights and Forecast, 2019-2031
- 8.1. Market Analysis, Insights and Forecast - by Propulsion Type
- 8.1.1. BEV
- 8.1.2. HEV
- 8.1.3. FCEV
- 8.2. Market Analysis, Insights and Forecast - by Vehicle Type
- 8.2.1. Van
- 8.2.2. Pick-up Truck
- 8.3. Market Analysis, Insights and Forecast - by Power Output
- 8.3.1. Less Than 100 kW
- 8.3.2. 100 -250 kW
- 8.3.3. More Than 250 kW
- 8.1. Market Analysis, Insights and Forecast - by Propulsion Type
- 9. Rest of the World Electric LCV Market Analysis, Insights and Forecast, 2019-2031
- 9.1. Market Analysis, Insights and Forecast - by Propulsion Type
- 9.1.1. BEV
- 9.1.2. HEV
- 9.1.3. FCEV
- 9.2. Market Analysis, Insights and Forecast - by Vehicle Type
- 9.2.1. Van
- 9.2.2. Pick-up Truck
- 9.3. Market Analysis, Insights and Forecast - by Power Output
- 9.3.1. Less Than 100 kW
- 9.3.2. 100 -250 kW
- 9.3.3. More Than 250 kW
- 9.1. Market Analysis, Insights and Forecast - by Propulsion Type
- 10. North America Electric LCV Market Analysis, Insights and Forecast, 2019-2031
- 10.1. Market Analysis, Insights and Forecast - By Country/Sub-region
- 10.1.1 United States
- 10.1.2 Canada
- 10.1.3 Rest of North America
- 11. Europe Electric LCV Market Analysis, Insights and Forecast, 2019-2031
- 11.1. Market Analysis, Insights and Forecast - By Country/Sub-region
- 11.1.1 Germany
- 11.1.2 United Kingdom
- 11.1.3 France
- 11.1.4 Rest of Europe
- 12. Asia Pacific Electric LCV Market Analysis, Insights and Forecast, 2019-2031
- 12.1. Market Analysis, Insights and Forecast - By Country/Sub-region
- 12.1.1 India
- 12.1.2 China
- 12.1.3 Japan
- 12.1.4 South Korea
- 12.1.5 Rest of Asia Pacific
- 13. Rest of the World Electric LCV Market Analysis, Insights and Forecast, 2019-2031
- 13.1. Market Analysis, Insights and Forecast - By Country/Sub-region
- 13.1.1 Brazil
- 13.1.2 Mexico
- 13.1.3 United Arab Emirates
- 13.1.4 Other Countries
- 14. Competitive Analysis
- 14.1. Global Market Share Analysis 2024
- 14.2. Company Profiles
- 14.2.1 Tata Motors Limite
- 14.2.1.1. Overview
- 14.2.1.2. Products
- 14.2.1.3. SWOT Analysis
- 14.2.1.4. Recent Developments
- 14.2.1.5. Financials (Based on Availability)
- 14.2.2 Volkswagen AG
- 14.2.2.1. Overview
- 14.2.2.2. Products
- 14.2.2.3. SWOT Analysis
- 14.2.2.4. Recent Developments
- 14.2.2.5. Financials (Based on Availability)
- 14.2.3 Nissan Motor Co
- 14.2.3.1. Overview
- 14.2.3.2. Products
- 14.2.3.3. SWOT Analysis
- 14.2.3.4. Recent Developments
- 14.2.3.5. Financials (Based on Availability)
- 14.2.4 Renault Group
- 14.2.4.1. Overview
- 14.2.4.2. Products
- 14.2.4.3. SWOT Analysis
- 14.2.4.4. Recent Developments
- 14.2.4.5. Financials (Based on Availability)
- 14.2.5 Groupe PSA
- 14.2.5.1. Overview
- 14.2.5.2. Products
- 14.2.5.3. SWOT Analysis
- 14.2.5.4. Recent Developments
- 14.2.5.5. Financials (Based on Availability)
- 14.2.6 Mahindra and Mahindra Ltd
- 14.2.6.1. Overview
- 14.2.6.2. Products
- 14.2.6.3. SWOT Analysis
- 14.2.6.4. Recent Developments
- 14.2.6.5. Financials (Based on Availability)
- 14.2.7 BYD Group
- 14.2.7.1. Overview
- 14.2.7.2. Products
- 14.2.7.3. SWOT Analysis
- 14.2.7.4. Recent Developments
- 14.2.7.5. Financials (Based on Availability)
- 14.2.8 Tesla Inc
- 14.2.8.1. Overview
- 14.2.8.2. Products
- 14.2.8.3. SWOT Analysis
- 14.2.8.4. Recent Developments
- 14.2.8.5. Financials (Based on Availability)
- 14.2.9 Arrival Ltd
- 14.2.9.1. Overview
- 14.2.9.2. Products
- 14.2.9.3. SWOT Analysis
- 14.2.9.4. Recent Developments
- 14.2.9.5. Financials (Based on Availability)
- 14.2.10 Rivian Automotive
- 14.2.10.1. Overview
- 14.2.10.2. Products
- 14.2.10.3. SWOT Analysis
- 14.2.10.4. Recent Developments
- 14.2.10.5. Financials (Based on Availability)
- 14.2.11 BAIC Group
- 14.2.11.1. Overview
- 14.2.11.2. Products
- 14.2.11.3. SWOT Analysis
- 14.2.11.4. Recent Developments
- 14.2.11.5. Financials (Based on Availability)
- 14.2.1 Tata Motors Limite
List of Figures
- Figure 1: Global Electric LCV Market Revenue Breakdown (Million, %) by Region 2024 & 2032
- Figure 2: North America Electric LCV Market Revenue (Million), by Country 2024 & 2032
- Figure 3: North America Electric LCV Market Revenue Share (%), by Country 2024 & 2032
- Figure 4: Europe Electric LCV Market Revenue (Million), by Country 2024 & 2032
- Figure 5: Europe Electric LCV Market Revenue Share (%), by Country 2024 & 2032
- Figure 6: Asia Pacific Electric LCV Market Revenue (Million), by Country 2024 & 2032
- Figure 7: Asia Pacific Electric LCV Market Revenue Share (%), by Country 2024 & 2032
- Figure 8: Rest of the World Electric LCV Market Revenue (Million), by Country 2024 & 2032
- Figure 9: Rest of the World Electric LCV Market Revenue Share (%), by Country 2024 & 2032
- Figure 10: North America Electric LCV Market Revenue (Million), by Propulsion Type 2024 & 2032
- Figure 11: North America Electric LCV Market Revenue Share (%), by Propulsion Type 2024 & 2032
- Figure 12: North America Electric LCV Market Revenue (Million), by Vehicle Type 2024 & 2032
- Figure 13: North America Electric LCV Market Revenue Share (%), by Vehicle Type 2024 & 2032
- Figure 14: North America Electric LCV Market Revenue (Million), by Power Output 2024 & 2032
- Figure 15: North America Electric LCV Market Revenue Share (%), by Power Output 2024 & 2032
- Figure 16: North America Electric LCV Market Revenue (Million), by Country 2024 & 2032
- Figure 17: North America Electric LCV Market Revenue Share (%), by Country 2024 & 2032
- Figure 18: Europe Electric LCV Market Revenue (Million), by Propulsion Type 2024 & 2032
- Figure 19: Europe Electric LCV Market Revenue Share (%), by Propulsion Type 2024 & 2032
- Figure 20: Europe Electric LCV Market Revenue (Million), by Vehicle Type 2024 & 2032
- Figure 21: Europe Electric LCV Market Revenue Share (%), by Vehicle Type 2024 & 2032
- Figure 22: Europe Electric LCV Market Revenue (Million), by Power Output 2024 & 2032
- Figure 23: Europe Electric LCV Market Revenue Share (%), by Power Output 2024 & 2032
- Figure 24: Europe Electric LCV Market Revenue (Million), by Country 2024 & 2032
- Figure 25: Europe Electric LCV Market Revenue Share (%), by Country 2024 & 2032
- Figure 26: Asia Pacific Electric LCV Market Revenue (Million), by Propulsion Type 2024 & 2032
- Figure 27: Asia Pacific Electric LCV Market Revenue Share (%), by Propulsion Type 2024 & 2032
- Figure 28: Asia Pacific Electric LCV Market Revenue (Million), by Vehicle Type 2024 & 2032
- Figure 29: Asia Pacific Electric LCV Market Revenue Share (%), by Vehicle Type 2024 & 2032
- Figure 30: Asia Pacific Electric LCV Market Revenue (Million), by Power Output 2024 & 2032
- Figure 31: Asia Pacific Electric LCV Market Revenue Share (%), by Power Output 2024 & 2032
- Figure 32: Asia Pacific Electric LCV Market Revenue (Million), by Country 2024 & 2032
- Figure 33: Asia Pacific Electric LCV Market Revenue Share (%), by Country 2024 & 2032
- Figure 34: Rest of the World Electric LCV Market Revenue (Million), by Propulsion Type 2024 & 2032
- Figure 35: Rest of the World Electric LCV Market Revenue Share (%), by Propulsion Type 2024 & 2032
- Figure 36: Rest of the World Electric LCV Market Revenue (Million), by Vehicle Type 2024 & 2032
- Figure 37: Rest of the World Electric LCV Market Revenue Share (%), by Vehicle Type 2024 & 2032
- Figure 38: Rest of the World Electric LCV Market Revenue (Million), by Power Output 2024 & 2032
- Figure 39: Rest of the World Electric LCV Market Revenue Share (%), by Power Output 2024 & 2032
- Figure 40: Rest of the World Electric LCV Market Revenue (Million), by Country 2024 & 2032
- Figure 41: Rest of the World Electric LCV Market Revenue Share (%), by Country 2024 & 2032
List of Tables
- Table 1: Global Electric LCV Market Revenue Million Forecast, by Region 2019 & 2032
- Table 2: Global Electric LCV Market Revenue Million Forecast, by Propulsion Type 2019 & 2032
- Table 3: Global Electric LCV Market Revenue Million Forecast, by Vehicle Type 2019 & 2032
- Table 4: Global Electric LCV Market Revenue Million Forecast, by Power Output 2019 & 2032
- Table 5: Global Electric LCV Market Revenue Million Forecast, by Region 2019 & 2032
- Table 6: Global Electric LCV Market Revenue Million Forecast, by Country 2019 & 2032
- Table 7: United States Electric LCV Market Revenue (Million) Forecast, by Application 2019 & 2032
- Table 8: Canada Electric LCV Market Revenue (Million) Forecast, by Application 2019 & 2032
- Table 9: Rest of North America Electric LCV Market Revenue (Million) Forecast, by Application 2019 & 2032
- Table 10: Global Electric LCV Market Revenue Million Forecast, by Country 2019 & 2032
- Table 11: Germany Electric LCV Market Revenue (Million) Forecast, by Application 2019 & 2032
- Table 12: United Kingdom Electric LCV Market Revenue (Million) Forecast, by Application 2019 & 2032
- Table 13: France Electric LCV Market Revenue (Million) Forecast, by Application 2019 & 2032
- Table 14: Rest of Europe Electric LCV Market Revenue (Million) Forecast, by Application 2019 & 2032
- Table 15: Global Electric LCV Market Revenue Million Forecast, by Country 2019 & 2032
- Table 16: India Electric LCV Market Revenue (Million) Forecast, by Application 2019 & 2032
- Table 17: China Electric LCV Market Revenue (Million) Forecast, by Application 2019 & 2032
- Table 18: Japan Electric LCV Market Revenue (Million) Forecast, by Application 2019 & 2032
- Table 19: South Korea Electric LCV Market Revenue (Million) Forecast, by Application 2019 & 2032
- Table 20: Rest of Asia Pacific Electric LCV Market Revenue (Million) Forecast, by Application 2019 & 2032
- Table 21: Global Electric LCV Market Revenue Million Forecast, by Country 2019 & 2032
- Table 22: Brazil Electric LCV Market Revenue (Million) Forecast, by Application 2019 & 2032
- Table 23: Mexico Electric LCV Market Revenue (Million) Forecast, by Application 2019 & 2032
- Table 24: United Arab Emirates Electric LCV Market Revenue (Million) Forecast, by Application 2019 & 2032
- Table 25: Other Countries Electric LCV Market Revenue (Million) Forecast, by Application 2019 & 2032
- Table 26: Global Electric LCV Market Revenue Million Forecast, by Propulsion Type 2019 & 2032
- Table 27: Global Electric LCV Market Revenue Million Forecast, by Vehicle Type 2019 & 2032
- Table 28: Global Electric LCV Market Revenue Million Forecast, by Power Output 2019 & 2032
- Table 29: Global Electric LCV Market Revenue Million Forecast, by Country 2019 & 2032
- Table 30: United States Electric LCV Market Revenue (Million) Forecast, by Application 2019 & 2032
- Table 31: Canada Electric LCV Market Revenue (Million) Forecast, by Application 2019 & 2032
- Table 32: Rest of North America Electric LCV Market Revenue (Million) Forecast, by Application 2019 & 2032
- Table 33: Global Electric LCV Market Revenue Million Forecast, by Propulsion Type 2019 & 2032
- Table 34: Global Electric LCV Market Revenue Million Forecast, by Vehicle Type 2019 & 2032
- Table 35: Global Electric LCV Market Revenue Million Forecast, by Power Output 2019 & 2032
- Table 36: Global Electric LCV Market Revenue Million Forecast, by Country 2019 & 2032
- Table 37: Germany Electric LCV Market Revenue (Million) Forecast, by Application 2019 & 2032
- Table 38: United Kingdom Electric LCV Market Revenue (Million) Forecast, by Application 2019 & 2032
- Table 39: France Electric LCV Market Revenue (Million) Forecast, by Application 2019 & 2032
- Table 40: Rest of Europe Electric LCV Market Revenue (Million) Forecast, by Application 2019 & 2032
- Table 41: Global Electric LCV Market Revenue Million Forecast, by Propulsion Type 2019 & 2032
- Table 42: Global Electric LCV Market Revenue Million Forecast, by Vehicle Type 2019 & 2032
- Table 43: Global Electric LCV Market Revenue Million Forecast, by Power Output 2019 & 2032
- Table 44: Global Electric LCV Market Revenue Million Forecast, by Country 2019 & 2032
- Table 45: India Electric LCV Market Revenue (Million) Forecast, by Application 2019 & 2032
- Table 46: China Electric LCV Market Revenue (Million) Forecast, by Application 2019 & 2032
- Table 47: Japan Electric LCV Market Revenue (Million) Forecast, by Application 2019 & 2032
- Table 48: South Korea Electric LCV Market Revenue (Million) Forecast, by Application 2019 & 2032
- Table 49: Rest of Asia Pacific Electric LCV Market Revenue (Million) Forecast, by Application 2019 & 2032
- Table 50: Global Electric LCV Market Revenue Million Forecast, by Propulsion Type 2019 & 2032
- Table 51: Global Electric LCV Market Revenue Million Forecast, by Vehicle Type 2019 & 2032
- Table 52: Global Electric LCV Market Revenue Million Forecast, by Power Output 2019 & 2032
- Table 53: Global Electric LCV Market Revenue Million Forecast, by Country 2019 & 2032
- Table 54: Brazil Electric LCV Market Revenue (Million) Forecast, by Application 2019 & 2032
- Table 55: Mexico Electric LCV Market Revenue (Million) Forecast, by Application 2019 & 2032
- Table 56: United Arab Emirates Electric LCV Market Revenue (Million) Forecast, by Application 2019 & 2032
- Table 57: Other Countries Electric LCV Market Revenue (Million) Forecast, by Application 2019 & 2032
Frequently Asked Questions
1. What is the projected Compound Annual Growth Rate (CAGR) of the Electric LCV Market?
The projected CAGR is approximately 36.40%.
2. Which companies are prominent players in the Electric LCV Market?
Key companies in the market include Tata Motors Limite, Volkswagen AG, Nissan Motor Co, Renault Group, Groupe PSA, Mahindra and Mahindra Ltd, BYD Group, Tesla Inc, Arrival Ltd, Rivian Automotive, BAIC Group.
3. What are the main segments of the Electric LCV Market?
The market segments include Propulsion Type, Vehicle Type, Power Output.
4. Can you provide details about the market size?
The market size is estimated to be USD 32.15 Million as of 2022.
5. What are some drivers contributing to market growth?
Growing Travel and Tourism Industry is Driving the Car Rental Market.
6. What are the notable trends driving market growth?
Electric Van is Leading the Electric LCV Market.
7. Are there any restraints impacting market growth?
Increasing Popularity of Ride-Sharing Services Pose Challenges for the Conventional Car Rental Market.
8. Can you provide examples of recent developments in the market?
N/A
9. What pricing options are available for accessing the report?
Pricing options include single-user, multi-user, and enterprise licenses priced at USD 4750, USD 5250, and USD 8750 respectively.
10. Is the market size provided in terms of value or volume?
The market size is provided in terms of value, measured in Million.
11. Are there any specific market keywords associated with the report?
Yes, the market keyword associated with the report is "Electric LCV Market," which aids in identifying and referencing the specific market segment covered.
12. How do I determine which pricing option suits my needs best?
The pricing options vary based on user requirements and access needs. Individual users may opt for single-user licenses, while businesses requiring broader access may choose multi-user or enterprise licenses for cost-effective access to the report.
13. Are there any additional resources or data provided in the Electric LCV Market report?
While the report offers comprehensive insights, it's advisable to review the specific contents or supplementary materials provided to ascertain if additional resources or data are available.
14. How can I stay updated on further developments or reports in the Electric LCV Market?
To stay informed about further developments, trends, and reports in the Electric LCV Market, consider subscribing to industry newsletters, following relevant companies and organizations, or regularly checking reputable industry news sources and publications.
Methodology
Step 1 - Identification of Relevant Samples Size from Population Database


Step 2 - Approaches for Defining Global Market Size (Value, Volume* & Price*)

Note*: In applicable scenarios
Step 3 - Data Sources
Primary Research
- Web Analytics
- Survey Reports
- Research Institute
- Latest Research Reports
- Opinion Leaders
Secondary Research
- Annual Reports
- White Paper
- Latest Press Release
- Industry Association
- Paid Database
- Investor Presentations

Step 4 - Data Triangulation
Involves using different sources of information in order to increase the validity of a study
These sources are likely to be stakeholders in a program - participants, other researchers, program staff, other community members, and so on.
Then we put all data in single framework & apply various statistical tools to find out the dynamic on the market.
During the analysis stage, feedback from the stakeholder groups would be compared to determine areas of agreement as well as areas of divergence


