Key Insights
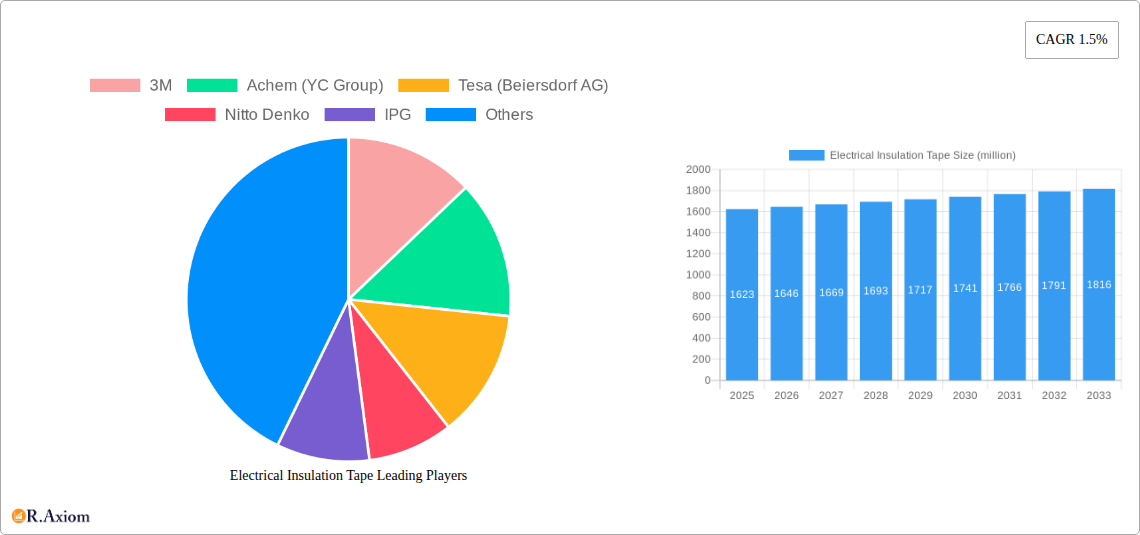
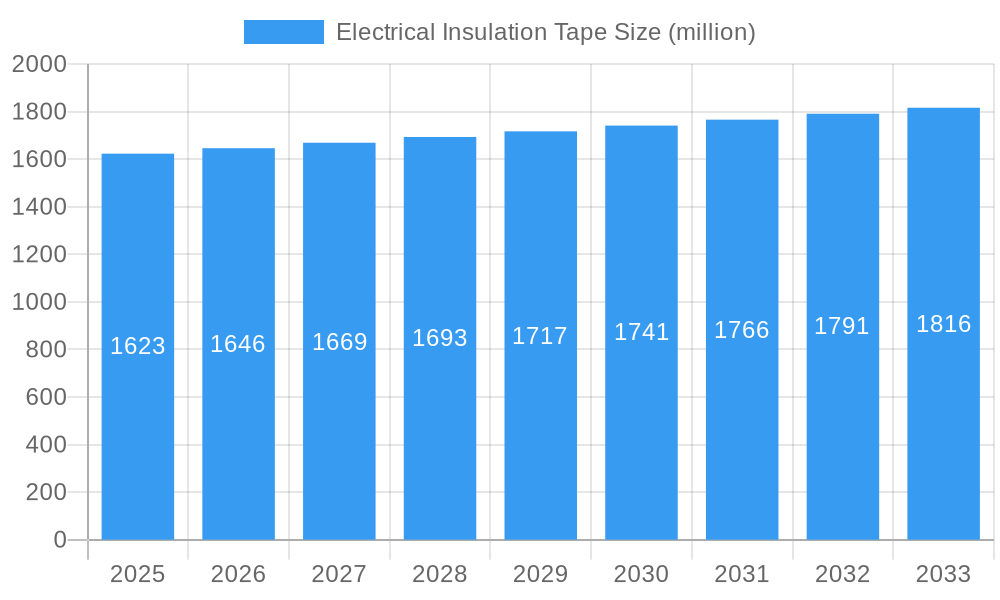
The global electrical insulation tape market, valued at $1623 million in 2025, is projected to experience steady growth, driven by the increasing demand for energy-efficient electrical systems and the expanding electronics industry. The Compound Annual Growth Rate (CAGR) of 1.5% over the forecast period (2025-2033) reflects a conservative yet realistic estimate considering potential economic fluctuations and technological advancements. Key drivers include the rising adoption of electric vehicles, renewable energy infrastructure development, and the continued miniaturization of electronic devices demanding high-performance insulation solutions. Emerging trends such as the development of eco-friendly, bio-based insulation tapes and the integration of smart sensors for real-time condition monitoring are expected to reshape the market landscape. However, fluctuating raw material prices and stringent environmental regulations could pose challenges to market growth. The market is segmented by material type (e.g., PVC, PET, fiberglass), application (e.g., automotive, industrial, consumer electronics), and region. Major players like 3M, Tesa, Nitto Denko, and Avery Dennison are actively engaged in product innovation and strategic partnerships to maintain their market positions.
Electrical Insulation Tape Market Size (In Billion)
The competitive landscape is characterized by both established multinational corporations and regional players. While the presence of many established players indicates a mature market, ongoing technological advancements and the increasing demand for specialized insulation tapes are creating opportunities for new entrants. Companies are focusing on expanding their product portfolio to cater to diverse application requirements and invest in research and development to meet the growing need for high-performance, environmentally sustainable products. Market growth will largely depend on technological innovation, the adoption of advanced materials, and the overall health of the global economy, particularly in sectors like automotive and electronics. Regional variations in growth rates are expected, influenced by factors such as economic development, industrial infrastructure, and government policies promoting energy efficiency and sustainable technologies.
Electrical Insulation Tape Company Market Share
Electrical Insulation Tape Market Report: 2019-2033
This comprehensive report provides an in-depth analysis of the global electrical insulation tape market, offering crucial insights for stakeholders across the value chain. The study period spans from 2019 to 2033, with 2025 serving as the base and estimated year. The forecast period covers 2025-2033, while the historical period analyzed is 2019-2024. The report's findings are based on rigorous data analysis and expert insights, providing actionable intelligence for strategic decision-making. The market is valued at xx million in 2025 and is projected to reach xx million by 2033, exhibiting a CAGR of xx% during the forecast period.
Electrical Insulation Tape Market Concentration & Innovation
The global electrical insulation tape market exhibits a moderately concentrated landscape, with key players like 3M, 3M, Achem (YC Group), Tesa (Beiersdorf AG), Nitto Denko, IPG, Scapa, Saint-Gobain, Four Pillars Enterprise, Globe Industries Corporation, Plymouth Rubber, Teraoka, Wurth, Shushi Group, Avery Dennison Corporation (Yongle), Shanghai Yongguan Adhesive, Ningbo Sincere New Material, Denka, Furukawa Electric, and Berry Global holding significant market shares. In 2025, the top 5 players collectively control approximately xx% of the market. Innovation in the sector is driven by the need for improved electrical performance, enhanced durability, and eco-friendly materials. Regulatory frameworks, such as RoHS and REACH, are shaping material choices and manufacturing processes. Product substitutes, including other insulation materials, present competitive pressure, but the versatility and cost-effectiveness of electrical insulation tape maintain its market dominance. End-user trends towards miniaturization and higher power density in electronics are driving demand for specialized tapes with enhanced properties. Recent M&A activities, valued at approximately xx million in the past five years, demonstrate strategic consolidation within the industry.
- Market Share (2025): 3M (xx%), Tesa (xx%), Nitto Denko (xx%), Others (xx%)
- M&A Deal Value (2020-2024): Approximately xx million
Electrical Insulation Tape Industry Trends & Insights
The global electrical insulation tape market is experiencing robust growth, propelled by factors such as increasing demand from the automotive, electronics, and renewable energy sectors. The market's growth is further fueled by technological advancements leading to the development of high-performance tapes with superior dielectric strength, thermal stability, and resistance to chemicals and moisture. Consumer preferences are shifting towards environmentally friendly and sustainable solutions, pushing manufacturers to adopt bio-based materials and reduce their environmental footprint. The competitive landscape is characterized by intense rivalry, with major players focusing on product innovation, strategic partnerships, and geographic expansion to gain a competitive edge. Market penetration in emerging economies is high, especially in regions experiencing rapid industrialization and infrastructure development. The estimated CAGR for the market is xx% from 2025 to 2033.
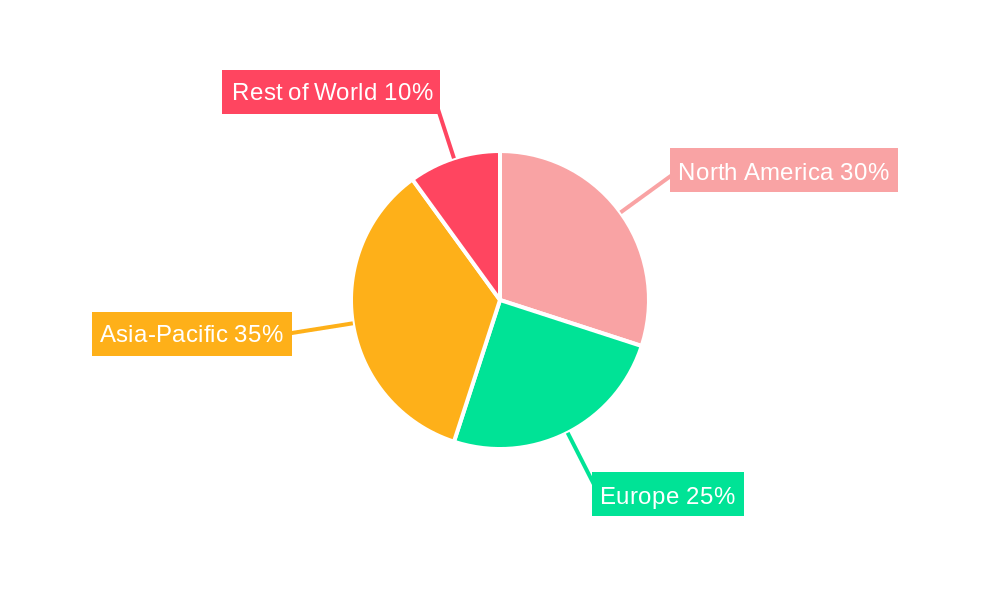
Dominant Markets & Segments in Electrical Insulation Tape
The Asia-Pacific region dominates the global electrical insulation tape market, driven by strong economic growth, expanding manufacturing sectors, and burgeoning infrastructure development in countries like China and India.
- Key Drivers in Asia-Pacific:
- Rapid industrialization and urbanization
- Significant investments in infrastructure projects
- Growing demand from electronics and automotive sectors
- Favorable government policies supporting manufacturing and industrial growth
- Increasing adoption of renewable energy technologies.
The strong dominance of the Asia-Pacific region is further cemented by the high concentration of manufacturing facilities, robust supply chains, and a cost-effective labor force. North America and Europe also represent significant markets, although their growth rates are comparatively slower than those in the Asia-Pacific region. Specific segments such as high-temperature tapes and specialized tapes for electric vehicles show high growth potential.
Electrical Insulation Tape Product Developments
Recent product innovations focus on enhanced dielectric strength, improved flexibility, and greater resistance to harsh environmental conditions. New materials like nanomaterials and bio-based polymers are being integrated to enhance performance and sustainability. Applications are expanding into new sectors, including electric vehicles, renewable energy systems, and advanced electronics. This trend highlights a shift towards specialized tapes tailored to meet the specific requirements of emerging applications. The competitive advantage hinges on offering superior performance characteristics at competitive prices, alongside environmentally responsible manufacturing practices.
Report Scope & Segmentation Analysis
The report segments the electrical insulation tape market based on several factors including material type (e.g., PVC, PET, PTFE), application (e.g., electrical motors, transformers, wiring harnesses), end-use industry (e.g., automotive, electronics, energy), and geography. Each segment's market size and growth projections are provided, along with insights into competitive dynamics and key trends. The growth projections account for varying economic conditions and technological advancements within each segment. The report provides a granular view of the market, enabling businesses to identify lucrative segments and optimize their strategies.
Key Drivers of Electrical Insulation Tape Growth
Several factors fuel the growth of the electrical insulation tape market. Firstly, the burgeoning electronics industry, particularly in consumer electronics, and the expansion of the automotive and renewable energy sectors, including electric vehicle manufacturing, create substantial demand for high-performance insulation tapes. Secondly, technological advancements in tape materials and manufacturing processes consistently lead to improved performance, durability, and reliability. Lastly, supportive government regulations and initiatives in various countries promoting energy efficiency and sustainability further stimulate market growth.
Challenges in the Electrical Insulation Tape Sector
The electrical insulation tape industry faces challenges including fluctuations in raw material prices, supply chain disruptions, and increasing competition from substitute materials. Environmental regulations are also creating pressure on manufacturers to reduce their carbon footprint and adopt more sustainable materials. These challenges significantly impact production costs and profitability, necessitating strategic responses from industry players.
Emerging Opportunities in Electrical Insulation Tape
Emerging opportunities lie in the development of specialized tapes for high-temperature applications, electric vehicles, and renewable energy systems. The growing emphasis on sustainable and eco-friendly materials presents opportunities for manufacturers using bio-based polymers or recycled materials. Furthermore, advancements in smart technologies can potentially integrate sensors or other functionalities into tapes, creating new market possibilities.
Leading Players in the Electrical Insulation Tape Market
- 3M
- Achem (YC Group)
- Tesa (Beiersdorf AG)
- Nitto Denko
- IPG
- Scapa
- Saint-Gobain
- Four Pillars Enterprise
- Globe Industries Corporation
- Plymouth Rubber
- Teraoka
- Wurth
- Shushi Group
- Avery Dennison Corporation (Yongle)
- Shanghai Yongguan Adhesive
- Ningbo Sincere New Material
- Denka
- Furukawa Electric
- Berry Global
Key Developments in Electrical Insulation Tape Industry
- 2022 Q3: 3M launches a new series of high-temperature insulation tapes.
- 2023 Q1: Nitto Denko announces a strategic partnership to expand its presence in the electric vehicle market.
- 2024 Q2: Achem (YC Group) invests in a new manufacturing facility to increase production capacity.
- (Add further developments with year/month and impact description)
Strategic Outlook for Electrical Insulation Tape Market
The electrical insulation tape market holds significant growth potential, driven by the continued expansion of key end-use industries and technological advancements. The focus on sustainability, coupled with the demand for specialized tapes in emerging applications, creates lucrative opportunities for industry players. Strategic investments in research and development, coupled with expansion into new geographic markets and strategic partnerships, will be crucial for success in this dynamic market.
Electrical Insulation Tape Segmentation
-
1. Application
- 1.1. Electrical and Electronics
- 1.2. Auto
- 1.3. Aerospace
- 1.4. Communication
- 1.5. Others
-
2. Type
- 2.1. PVC Electrical Tape
- 2.2. Cloth Electrical Tape
- 2.3. PET Electrical Tape
- 2.4. Others
Electrical Insulation Tape Segmentation By Geography
-
1. North America
- 1.1. United States
- 1.2. Canada
- 1.3. Mexico
-
2. South America
- 2.1. Brazil
- 2.2. Argentina
- 2.3. Rest of South America
-
3. Europe
- 3.1. United Kingdom
- 3.2. Germany
- 3.3. France
- 3.4. Italy
- 3.5. Spain
- 3.6. Russia
- 3.7. Benelux
- 3.8. Nordics
- 3.9. Rest of Europe
-
4. Middle East & Africa
- 4.1. Turkey
- 4.2. Israel
- 4.3. GCC
- 4.4. North Africa
- 4.5. South Africa
- 4.6. Rest of Middle East & Africa
-
5. Asia Pacific
- 5.1. China
- 5.2. India
- 5.3. Japan
- 5.4. South Korea
- 5.5. ASEAN
- 5.6. Oceania
- 5.7. Rest of Asia Pacific
Electrical Insulation Tape Regional Market Share
Geographic Coverage of Electrical Insulation Tape
Electrical Insulation Tape REPORT HIGHLIGHTS
| Aspects | Details |
|---|---|
| Study Period | 2020-2034 |
| Base Year | 2025 |
| Estimated Year | 2026 |
| Forecast Period | 2026-2034 |
| Historical Period | 2020-2025 |
| Growth Rate | CAGR of 1.5% from 2020-2034 |
| Segmentation |
|
Table of Contents
- 1. Introduction
- 1.1. Research Scope
- 1.2. Market Segmentation
- 1.3. Research Objective
- 1.4. Definitions and Assumptions
- 2. Executive Summary
- 2.1. Market Snapshot
- 3. Market Dynamics
- 3.1. Market Drivers
- 3.2. Market Restrains
- 3.3. Market Trends
- 3.4. Market Opportunities
- 4. Market Factor Analysis
- 4.1. Porters Five Forces
- 4.1.1. Bargaining Power of Suppliers
- 4.1.2. Bargaining Power of Buyers
- 4.1.3. Threat of New Entrants
- 4.1.4. Threat of Substitutes
- 4.1.5. Competitive Rivalry
- 4.2. PESTEL analysis
- 4.3. BCG Analysis
- 4.3.1. Stars (High Growth, High Market Share)
- 4.3.2. Cash Cows (Low Growth, High Market Share)
- 4.3.3. Question Mark (High Growth, Low Market Share)
- 4.3.4. Dogs (Low Growth, Low Market Share)
- 4.4. Ansoff Matrix Analysis
- 4.5. Supply Chain Analysis
- 4.6. Regulatory Landscape
- 4.7. Current Market Potential and Opportunity Assessment (TAM–SAM–SOM Framework)
- 4.8. RAX Analyst Note
- 4.1. Porters Five Forces
- 5. Market Analysis, Insights and Forecast 2021-2033
- 5.1. Market Analysis, Insights and Forecast - by Application
- 5.1.1. Electrical and Electronics
- 5.1.2. Auto
- 5.1.3. Aerospace
- 5.1.4. Communication
- 5.1.5. Others
- 5.2. Market Analysis, Insights and Forecast - by Type
- 5.2.1. PVC Electrical Tape
- 5.2.2. Cloth Electrical Tape
- 5.2.3. PET Electrical Tape
- 5.2.4. Others
- 5.3. Market Analysis, Insights and Forecast - by Region
- 5.3.1. North America
- 5.3.2. South America
- 5.3.3. Europe
- 5.3.4. Middle East & Africa
- 5.3.5. Asia Pacific
- 5.1. Market Analysis, Insights and Forecast - by Application
- 6. Global Electrical Insulation Tape Analysis, Insights and Forecast, 2021-2033
- 6.1. Market Analysis, Insights and Forecast - by Application
- 6.1.1. Electrical and Electronics
- 6.1.2. Auto
- 6.1.3. Aerospace
- 6.1.4. Communication
- 6.1.5. Others
- 6.2. Market Analysis, Insights and Forecast - by Type
- 6.2.1. PVC Electrical Tape
- 6.2.2. Cloth Electrical Tape
- 6.2.3. PET Electrical Tape
- 6.2.4. Others
- 6.1. Market Analysis, Insights and Forecast - by Application
- 7. North America Electrical Insulation Tape Analysis, Insights and Forecast, 2020-2032
- 7.1. Market Analysis, Insights and Forecast - by Application
- 7.1.1. Electrical and Electronics
- 7.1.2. Auto
- 7.1.3. Aerospace
- 7.1.4. Communication
- 7.1.5. Others
- 7.2. Market Analysis, Insights and Forecast - by Type
- 7.2.1. PVC Electrical Tape
- 7.2.2. Cloth Electrical Tape
- 7.2.3. PET Electrical Tape
- 7.2.4. Others
- 7.1. Market Analysis, Insights and Forecast - by Application
- 8. South America Electrical Insulation Tape Analysis, Insights and Forecast, 2020-2032
- 8.1. Market Analysis, Insights and Forecast - by Application
- 8.1.1. Electrical and Electronics
- 8.1.2. Auto
- 8.1.3. Aerospace
- 8.1.4. Communication
- 8.1.5. Others
- 8.2. Market Analysis, Insights and Forecast - by Type
- 8.2.1. PVC Electrical Tape
- 8.2.2. Cloth Electrical Tape
- 8.2.3. PET Electrical Tape
- 8.2.4. Others
- 8.1. Market Analysis, Insights and Forecast - by Application
- 9. Europe Electrical Insulation Tape Analysis, Insights and Forecast, 2020-2032
- 9.1. Market Analysis, Insights and Forecast - by Application
- 9.1.1. Electrical and Electronics
- 9.1.2. Auto
- 9.1.3. Aerospace
- 9.1.4. Communication
- 9.1.5. Others
- 9.2. Market Analysis, Insights and Forecast - by Type
- 9.2.1. PVC Electrical Tape
- 9.2.2. Cloth Electrical Tape
- 9.2.3. PET Electrical Tape
- 9.2.4. Others
- 9.1. Market Analysis, Insights and Forecast - by Application
- 10. Middle East & Africa Electrical Insulation Tape Analysis, Insights and Forecast, 2020-2032
- 10.1. Market Analysis, Insights and Forecast - by Application
- 10.1.1. Electrical and Electronics
- 10.1.2. Auto
- 10.1.3. Aerospace
- 10.1.4. Communication
- 10.1.5. Others
- 10.2. Market Analysis, Insights and Forecast - by Type
- 10.2.1. PVC Electrical Tape
- 10.2.2. Cloth Electrical Tape
- 10.2.3. PET Electrical Tape
- 10.2.4. Others
- 10.1. Market Analysis, Insights and Forecast - by Application
- 11. Asia Pacific Electrical Insulation Tape Analysis, Insights and Forecast, 2020-2032
- 11.1. Market Analysis, Insights and Forecast - by Application
- 11.1.1. Electrical and Electronics
- 11.1.2. Auto
- 11.1.3. Aerospace
- 11.1.4. Communication
- 11.1.5. Others
- 11.2. Market Analysis, Insights and Forecast - by Type
- 11.2.1. PVC Electrical Tape
- 11.2.2. Cloth Electrical Tape
- 11.2.3. PET Electrical Tape
- 11.2.4. Others
- 11.1. Market Analysis, Insights and Forecast - by Application
- 12. Competitive Analysis
- 12.1. Company Profiles
- 12.1.1 3M
- 12.1.1.1. Company Overview
- 12.1.1.2. Products
- 12.1.1.3. Company Financials
- 12.1.1.4. SWOT Analysis
- 12.1.2 Achem (YC Group)
- 12.1.2.1. Company Overview
- 12.1.2.2. Products
- 12.1.2.3. Company Financials
- 12.1.2.4. SWOT Analysis
- 12.1.3 Tesa (Beiersdorf AG)
- 12.1.3.1. Company Overview
- 12.1.3.2. Products
- 12.1.3.3. Company Financials
- 12.1.3.4. SWOT Analysis
- 12.1.4 Nitto Denko
- 12.1.4.1. Company Overview
- 12.1.4.2. Products
- 12.1.4.3. Company Financials
- 12.1.4.4. SWOT Analysis
- 12.1.5 IPG
- 12.1.5.1. Company Overview
- 12.1.5.2. Products
- 12.1.5.3. Company Financials
- 12.1.5.4. SWOT Analysis
- 12.1.6 Scapa
- 12.1.6.1. Company Overview
- 12.1.6.2. Products
- 12.1.6.3. Company Financials
- 12.1.6.4. SWOT Analysis
- 12.1.7 Saint-Gobain
- 12.1.7.1. Company Overview
- 12.1.7.2. Products
- 12.1.7.3. Company Financials
- 12.1.7.4. SWOT Analysis
- 12.1.8 Four Pillars Enterprise
- 12.1.8.1. Company Overview
- 12.1.8.2. Products
- 12.1.8.3. Company Financials
- 12.1.8.4. SWOT Analysis
- 12.1.9 Globe Industries Corporation
- 12.1.9.1. Company Overview
- 12.1.9.2. Products
- 12.1.9.3. Company Financials
- 12.1.9.4. SWOT Analysis
- 12.1.10 Plymouth Rubber
- 12.1.10.1. Company Overview
- 12.1.10.2. Products
- 12.1.10.3. Company Financials
- 12.1.10.4. SWOT Analysis
- 12.1.11 Teraoka
- 12.1.11.1. Company Overview
- 12.1.11.2. Products
- 12.1.11.3. Company Financials
- 12.1.11.4. SWOT Analysis
- 12.1.12 Wurth
- 12.1.12.1. Company Overview
- 12.1.12.2. Products
- 12.1.12.3. Company Financials
- 12.1.12.4. SWOT Analysis
- 12.1.13 Shushi Group
- 12.1.13.1. Company Overview
- 12.1.13.2. Products
- 12.1.13.3. Company Financials
- 12.1.13.4. SWOT Analysis
- 12.1.14 Avery Dennison Corporation (Yongle)
- 12.1.14.1. Company Overview
- 12.1.14.2. Products
- 12.1.14.3. Company Financials
- 12.1.14.4. SWOT Analysis
- 12.1.15 Shanghai Yongguan Adhesive
- 12.1.15.1. Company Overview
- 12.1.15.2. Products
- 12.1.15.3. Company Financials
- 12.1.15.4. SWOT Analysis
- 12.1.16 Ningbo Sincere New Material
- 12.1.16.1. Company Overview
- 12.1.16.2. Products
- 12.1.16.3. Company Financials
- 12.1.16.4. SWOT Analysis
- 12.1.17 Denka
- 12.1.17.1. Company Overview
- 12.1.17.2. Products
- 12.1.17.3. Company Financials
- 12.1.17.4. SWOT Analysis
- 12.1.18 Furukawa Electric
- 12.1.18.1. Company Overview
- 12.1.18.2. Products
- 12.1.18.3. Company Financials
- 12.1.18.4. SWOT Analysis
- 12.1.19 Berry Global
- 12.1.19.1. Company Overview
- 12.1.19.2. Products
- 12.1.19.3. Company Financials
- 12.1.19.4. SWOT Analysis
- 12.1.1 3M
- 12.2. Market Entropy
- 12.2.1 Company's Key Areas Served
- 12.2.2 Recent Developments
- 12.3. Company Market Share Analysis 2025
- 12.3.1 Top 5 Companies Market Share Analysis
- 12.3.2 Top 3 Companies Market Share Analysis
- 12.4. List of Potential Customers
- 13. Research Methodology
List of Figures
- Figure 1: Global Electrical Insulation Tape Revenue Breakdown (million, %) by Region 2025 & 2033
- Figure 2: Global Electrical Insulation Tape Volume Breakdown (K, %) by Region 2025 & 2033
- Figure 3: North America Electrical Insulation Tape Revenue (million), by Application 2025 & 2033
- Figure 4: North America Electrical Insulation Tape Volume (K), by Application 2025 & 2033
- Figure 5: North America Electrical Insulation Tape Revenue Share (%), by Application 2025 & 2033
- Figure 6: North America Electrical Insulation Tape Volume Share (%), by Application 2025 & 2033
- Figure 7: North America Electrical Insulation Tape Revenue (million), by Type 2025 & 2033
- Figure 8: North America Electrical Insulation Tape Volume (K), by Type 2025 & 2033
- Figure 9: North America Electrical Insulation Tape Revenue Share (%), by Type 2025 & 2033
- Figure 10: North America Electrical Insulation Tape Volume Share (%), by Type 2025 & 2033
- Figure 11: North America Electrical Insulation Tape Revenue (million), by Country 2025 & 2033
- Figure 12: North America Electrical Insulation Tape Volume (K), by Country 2025 & 2033
- Figure 13: North America Electrical Insulation Tape Revenue Share (%), by Country 2025 & 2033
- Figure 14: North America Electrical Insulation Tape Volume Share (%), by Country 2025 & 2033
- Figure 15: South America Electrical Insulation Tape Revenue (million), by Application 2025 & 2033
- Figure 16: South America Electrical Insulation Tape Volume (K), by Application 2025 & 2033
- Figure 17: South America Electrical Insulation Tape Revenue Share (%), by Application 2025 & 2033
- Figure 18: South America Electrical Insulation Tape Volume Share (%), by Application 2025 & 2033
- Figure 19: South America Electrical Insulation Tape Revenue (million), by Type 2025 & 2033
- Figure 20: South America Electrical Insulation Tape Volume (K), by Type 2025 & 2033
- Figure 21: South America Electrical Insulation Tape Revenue Share (%), by Type 2025 & 2033
- Figure 22: South America Electrical Insulation Tape Volume Share (%), by Type 2025 & 2033
- Figure 23: South America Electrical Insulation Tape Revenue (million), by Country 2025 & 2033
- Figure 24: South America Electrical Insulation Tape Volume (K), by Country 2025 & 2033
- Figure 25: South America Electrical Insulation Tape Revenue Share (%), by Country 2025 & 2033
- Figure 26: South America Electrical Insulation Tape Volume Share (%), by Country 2025 & 2033
- Figure 27: Europe Electrical Insulation Tape Revenue (million), by Application 2025 & 2033
- Figure 28: Europe Electrical Insulation Tape Volume (K), by Application 2025 & 2033
- Figure 29: Europe Electrical Insulation Tape Revenue Share (%), by Application 2025 & 2033
- Figure 30: Europe Electrical Insulation Tape Volume Share (%), by Application 2025 & 2033
- Figure 31: Europe Electrical Insulation Tape Revenue (million), by Type 2025 & 2033
- Figure 32: Europe Electrical Insulation Tape Volume (K), by Type 2025 & 2033
- Figure 33: Europe Electrical Insulation Tape Revenue Share (%), by Type 2025 & 2033
- Figure 34: Europe Electrical Insulation Tape Volume Share (%), by Type 2025 & 2033
- Figure 35: Europe Electrical Insulation Tape Revenue (million), by Country 2025 & 2033
- Figure 36: Europe Electrical Insulation Tape Volume (K), by Country 2025 & 2033
- Figure 37: Europe Electrical Insulation Tape Revenue Share (%), by Country 2025 & 2033
- Figure 38: Europe Electrical Insulation Tape Volume Share (%), by Country 2025 & 2033
- Figure 39: Middle East & Africa Electrical Insulation Tape Revenue (million), by Application 2025 & 2033
- Figure 40: Middle East & Africa Electrical Insulation Tape Volume (K), by Application 2025 & 2033
- Figure 41: Middle East & Africa Electrical Insulation Tape Revenue Share (%), by Application 2025 & 2033
- Figure 42: Middle East & Africa Electrical Insulation Tape Volume Share (%), by Application 2025 & 2033
- Figure 43: Middle East & Africa Electrical Insulation Tape Revenue (million), by Type 2025 & 2033
- Figure 44: Middle East & Africa Electrical Insulation Tape Volume (K), by Type 2025 & 2033
- Figure 45: Middle East & Africa Electrical Insulation Tape Revenue Share (%), by Type 2025 & 2033
- Figure 46: Middle East & Africa Electrical Insulation Tape Volume Share (%), by Type 2025 & 2033
- Figure 47: Middle East & Africa Electrical Insulation Tape Revenue (million), by Country 2025 & 2033
- Figure 48: Middle East & Africa Electrical Insulation Tape Volume (K), by Country 2025 & 2033
- Figure 49: Middle East & Africa Electrical Insulation Tape Revenue Share (%), by Country 2025 & 2033
- Figure 50: Middle East & Africa Electrical Insulation Tape Volume Share (%), by Country 2025 & 2033
- Figure 51: Asia Pacific Electrical Insulation Tape Revenue (million), by Application 2025 & 2033
- Figure 52: Asia Pacific Electrical Insulation Tape Volume (K), by Application 2025 & 2033
- Figure 53: Asia Pacific Electrical Insulation Tape Revenue Share (%), by Application 2025 & 2033
- Figure 54: Asia Pacific Electrical Insulation Tape Volume Share (%), by Application 2025 & 2033
- Figure 55: Asia Pacific Electrical Insulation Tape Revenue (million), by Type 2025 & 2033
- Figure 56: Asia Pacific Electrical Insulation Tape Volume (K), by Type 2025 & 2033
- Figure 57: Asia Pacific Electrical Insulation Tape Revenue Share (%), by Type 2025 & 2033
- Figure 58: Asia Pacific Electrical Insulation Tape Volume Share (%), by Type 2025 & 2033
- Figure 59: Asia Pacific Electrical Insulation Tape Revenue (million), by Country 2025 & 2033
- Figure 60: Asia Pacific Electrical Insulation Tape Volume (K), by Country 2025 & 2033
- Figure 61: Asia Pacific Electrical Insulation Tape Revenue Share (%), by Country 2025 & 2033
- Figure 62: Asia Pacific Electrical Insulation Tape Volume Share (%), by Country 2025 & 2033
List of Tables
- Table 1: Global Electrical Insulation Tape Revenue million Forecast, by Application 2020 & 2033
- Table 2: Global Electrical Insulation Tape Volume K Forecast, by Application 2020 & 2033
- Table 3: Global Electrical Insulation Tape Revenue million Forecast, by Type 2020 & 2033
- Table 4: Global Electrical Insulation Tape Volume K Forecast, by Type 2020 & 2033
- Table 5: Global Electrical Insulation Tape Revenue million Forecast, by Region 2020 & 2033
- Table 6: Global Electrical Insulation Tape Volume K Forecast, by Region 2020 & 2033
- Table 7: Global Electrical Insulation Tape Revenue million Forecast, by Application 2020 & 2033
- Table 8: Global Electrical Insulation Tape Volume K Forecast, by Application 2020 & 2033
- Table 9: Global Electrical Insulation Tape Revenue million Forecast, by Type 2020 & 2033
- Table 10: Global Electrical Insulation Tape Volume K Forecast, by Type 2020 & 2033
- Table 11: Global Electrical Insulation Tape Revenue million Forecast, by Country 2020 & 2033
- Table 12: Global Electrical Insulation Tape Volume K Forecast, by Country 2020 & 2033
- Table 13: United States Electrical Insulation Tape Revenue (million) Forecast, by Application 2020 & 2033
- Table 14: United States Electrical Insulation Tape Volume (K) Forecast, by Application 2020 & 2033
- Table 15: Canada Electrical Insulation Tape Revenue (million) Forecast, by Application 2020 & 2033
- Table 16: Canada Electrical Insulation Tape Volume (K) Forecast, by Application 2020 & 2033
- Table 17: Mexico Electrical Insulation Tape Revenue (million) Forecast, by Application 2020 & 2033
- Table 18: Mexico Electrical Insulation Tape Volume (K) Forecast, by Application 2020 & 2033
- Table 19: Global Electrical Insulation Tape Revenue million Forecast, by Application 2020 & 2033
- Table 20: Global Electrical Insulation Tape Volume K Forecast, by Application 2020 & 2033
- Table 21: Global Electrical Insulation Tape Revenue million Forecast, by Type 2020 & 2033
- Table 22: Global Electrical Insulation Tape Volume K Forecast, by Type 2020 & 2033
- Table 23: Global Electrical Insulation Tape Revenue million Forecast, by Country 2020 & 2033
- Table 24: Global Electrical Insulation Tape Volume K Forecast, by Country 2020 & 2033
- Table 25: Brazil Electrical Insulation Tape Revenue (million) Forecast, by Application 2020 & 2033
- Table 26: Brazil Electrical Insulation Tape Volume (K) Forecast, by Application 2020 & 2033
- Table 27: Argentina Electrical Insulation Tape Revenue (million) Forecast, by Application 2020 & 2033
- Table 28: Argentina Electrical Insulation Tape Volume (K) Forecast, by Application 2020 & 2033
- Table 29: Rest of South America Electrical Insulation Tape Revenue (million) Forecast, by Application 2020 & 2033
- Table 30: Rest of South America Electrical Insulation Tape Volume (K) Forecast, by Application 2020 & 2033
- Table 31: Global Electrical Insulation Tape Revenue million Forecast, by Application 2020 & 2033
- Table 32: Global Electrical Insulation Tape Volume K Forecast, by Application 2020 & 2033
- Table 33: Global Electrical Insulation Tape Revenue million Forecast, by Type 2020 & 2033
- Table 34: Global Electrical Insulation Tape Volume K Forecast, by Type 2020 & 2033
- Table 35: Global Electrical Insulation Tape Revenue million Forecast, by Country 2020 & 2033
- Table 36: Global Electrical Insulation Tape Volume K Forecast, by Country 2020 & 2033
- Table 37: United Kingdom Electrical Insulation Tape Revenue (million) Forecast, by Application 2020 & 2033
- Table 38: United Kingdom Electrical Insulation Tape Volume (K) Forecast, by Application 2020 & 2033
- Table 39: Germany Electrical Insulation Tape Revenue (million) Forecast, by Application 2020 & 2033
- Table 40: Germany Electrical Insulation Tape Volume (K) Forecast, by Application 2020 & 2033
- Table 41: France Electrical Insulation Tape Revenue (million) Forecast, by Application 2020 & 2033
- Table 42: France Electrical Insulation Tape Volume (K) Forecast, by Application 2020 & 2033
- Table 43: Italy Electrical Insulation Tape Revenue (million) Forecast, by Application 2020 & 2033
- Table 44: Italy Electrical Insulation Tape Volume (K) Forecast, by Application 2020 & 2033
- Table 45: Spain Electrical Insulation Tape Revenue (million) Forecast, by Application 2020 & 2033
- Table 46: Spain Electrical Insulation Tape Volume (K) Forecast, by Application 2020 & 2033
- Table 47: Russia Electrical Insulation Tape Revenue (million) Forecast, by Application 2020 & 2033
- Table 48: Russia Electrical Insulation Tape Volume (K) Forecast, by Application 2020 & 2033
- Table 49: Benelux Electrical Insulation Tape Revenue (million) Forecast, by Application 2020 & 2033
- Table 50: Benelux Electrical Insulation Tape Volume (K) Forecast, by Application 2020 & 2033
- Table 51: Nordics Electrical Insulation Tape Revenue (million) Forecast, by Application 2020 & 2033
- Table 52: Nordics Electrical Insulation Tape Volume (K) Forecast, by Application 2020 & 2033
- Table 53: Rest of Europe Electrical Insulation Tape Revenue (million) Forecast, by Application 2020 & 2033
- Table 54: Rest of Europe Electrical Insulation Tape Volume (K) Forecast, by Application 2020 & 2033
- Table 55: Global Electrical Insulation Tape Revenue million Forecast, by Application 2020 & 2033
- Table 56: Global Electrical Insulation Tape Volume K Forecast, by Application 2020 & 2033
- Table 57: Global Electrical Insulation Tape Revenue million Forecast, by Type 2020 & 2033
- Table 58: Global Electrical Insulation Tape Volume K Forecast, by Type 2020 & 2033
- Table 59: Global Electrical Insulation Tape Revenue million Forecast, by Country 2020 & 2033
- Table 60: Global Electrical Insulation Tape Volume K Forecast, by Country 2020 & 2033
- Table 61: Turkey Electrical Insulation Tape Revenue (million) Forecast, by Application 2020 & 2033
- Table 62: Turkey Electrical Insulation Tape Volume (K) Forecast, by Application 2020 & 2033
- Table 63: Israel Electrical Insulation Tape Revenue (million) Forecast, by Application 2020 & 2033
- Table 64: Israel Electrical Insulation Tape Volume (K) Forecast, by Application 2020 & 2033
- Table 65: GCC Electrical Insulation Tape Revenue (million) Forecast, by Application 2020 & 2033
- Table 66: GCC Electrical Insulation Tape Volume (K) Forecast, by Application 2020 & 2033
- Table 67: North Africa Electrical Insulation Tape Revenue (million) Forecast, by Application 2020 & 2033
- Table 68: North Africa Electrical Insulation Tape Volume (K) Forecast, by Application 2020 & 2033
- Table 69: South Africa Electrical Insulation Tape Revenue (million) Forecast, by Application 2020 & 2033
- Table 70: South Africa Electrical Insulation Tape Volume (K) Forecast, by Application 2020 & 2033
- Table 71: Rest of Middle East & Africa Electrical Insulation Tape Revenue (million) Forecast, by Application 2020 & 2033
- Table 72: Rest of Middle East & Africa Electrical Insulation Tape Volume (K) Forecast, by Application 2020 & 2033
- Table 73: Global Electrical Insulation Tape Revenue million Forecast, by Application 2020 & 2033
- Table 74: Global Electrical Insulation Tape Volume K Forecast, by Application 2020 & 2033
- Table 75: Global Electrical Insulation Tape Revenue million Forecast, by Type 2020 & 2033
- Table 76: Global Electrical Insulation Tape Volume K Forecast, by Type 2020 & 2033
- Table 77: Global Electrical Insulation Tape Revenue million Forecast, by Country 2020 & 2033
- Table 78: Global Electrical Insulation Tape Volume K Forecast, by Country 2020 & 2033
- Table 79: China Electrical Insulation Tape Revenue (million) Forecast, by Application 2020 & 2033
- Table 80: China Electrical Insulation Tape Volume (K) Forecast, by Application 2020 & 2033
- Table 81: India Electrical Insulation Tape Revenue (million) Forecast, by Application 2020 & 2033
- Table 82: India Electrical Insulation Tape Volume (K) Forecast, by Application 2020 & 2033
- Table 83: Japan Electrical Insulation Tape Revenue (million) Forecast, by Application 2020 & 2033
- Table 84: Japan Electrical Insulation Tape Volume (K) Forecast, by Application 2020 & 2033
- Table 85: South Korea Electrical Insulation Tape Revenue (million) Forecast, by Application 2020 & 2033
- Table 86: South Korea Electrical Insulation Tape Volume (K) Forecast, by Application 2020 & 2033
- Table 87: ASEAN Electrical Insulation Tape Revenue (million) Forecast, by Application 2020 & 2033
- Table 88: ASEAN Electrical Insulation Tape Volume (K) Forecast, by Application 2020 & 2033
- Table 89: Oceania Electrical Insulation Tape Revenue (million) Forecast, by Application 2020 & 2033
- Table 90: Oceania Electrical Insulation Tape Volume (K) Forecast, by Application 2020 & 2033
- Table 91: Rest of Asia Pacific Electrical Insulation Tape Revenue (million) Forecast, by Application 2020 & 2033
- Table 92: Rest of Asia Pacific Electrical Insulation Tape Volume (K) Forecast, by Application 2020 & 2033
Frequently Asked Questions
1. What is the projected Compound Annual Growth Rate (CAGR) of the Electrical Insulation Tape?
The projected CAGR is approximately 1.5%.
2. Which companies are prominent players in the Electrical Insulation Tape?
Key companies in the market include 3M, Achem (YC Group), Tesa (Beiersdorf AG), Nitto Denko, IPG, Scapa, Saint-Gobain, Four Pillars Enterprise, Globe Industries Corporation, Plymouth Rubber, Teraoka, Wurth, Shushi Group, Avery Dennison Corporation (Yongle), Shanghai Yongguan Adhesive, Ningbo Sincere New Material, Denka, Furukawa Electric, Berry Global.
3. What are the main segments of the Electrical Insulation Tape?
The market segments include Application, Type.
4. Can you provide details about the market size?
The market size is estimated to be USD 1623 million as of 2022.
5. What are some drivers contributing to market growth?
N/A
6. What are the notable trends driving market growth?
N/A
7. Are there any restraints impacting market growth?
N/A
8. Can you provide examples of recent developments in the market?
N/A
9. What pricing options are available for accessing the report?
Pricing options include single-user, multi-user, and enterprise licenses priced at USD 3950.00, USD 5925.00, and USD 7900.00 respectively.
10. Is the market size provided in terms of value or volume?
The market size is provided in terms of value, measured in million and volume, measured in K.
11. Are there any specific market keywords associated with the report?
Yes, the market keyword associated with the report is "Electrical Insulation Tape," which aids in identifying and referencing the specific market segment covered.
12. How do I determine which pricing option suits my needs best?
The pricing options vary based on user requirements and access needs. Individual users may opt for single-user licenses, while businesses requiring broader access may choose multi-user or enterprise licenses for cost-effective access to the report.
13. Are there any additional resources or data provided in the Electrical Insulation Tape report?
While the report offers comprehensive insights, it's advisable to review the specific contents or supplementary materials provided to ascertain if additional resources or data are available.
14. How can I stay updated on further developments or reports in the Electrical Insulation Tape?
To stay informed about further developments, trends, and reports in the Electrical Insulation Tape, consider subscribing to industry newsletters, following relevant companies and organizations, or regularly checking reputable industry news sources and publications.
Methodology
Step 1 - Identification of Relevant Samples Size from Population Database


Step 2 - Approaches for Defining Global Market Size (Value, Volume* & Price*)

Note*: In applicable scenarios
Step 3 - Data Sources
Primary Research
- Web Analytics
- Survey Reports
- Research Institute
- Latest Research Reports
- Opinion Leaders
Secondary Research
- Annual Reports
- White Paper
- Latest Press Release
- Industry Association
- Paid Database
- Investor Presentations

Step 4 - Data Triangulation
Involves using different sources of information in order to increase the validity of a study
These sources are likely to be stakeholders in a program - participants, other researchers, program staff, other community members, and so on.
Then we put all data in single framework & apply various statistical tools to find out the dynamic on the market.
During the analysis stage, feedback from the stakeholder groups would be compared to determine areas of agreement as well as areas of divergence

