

Key Insights
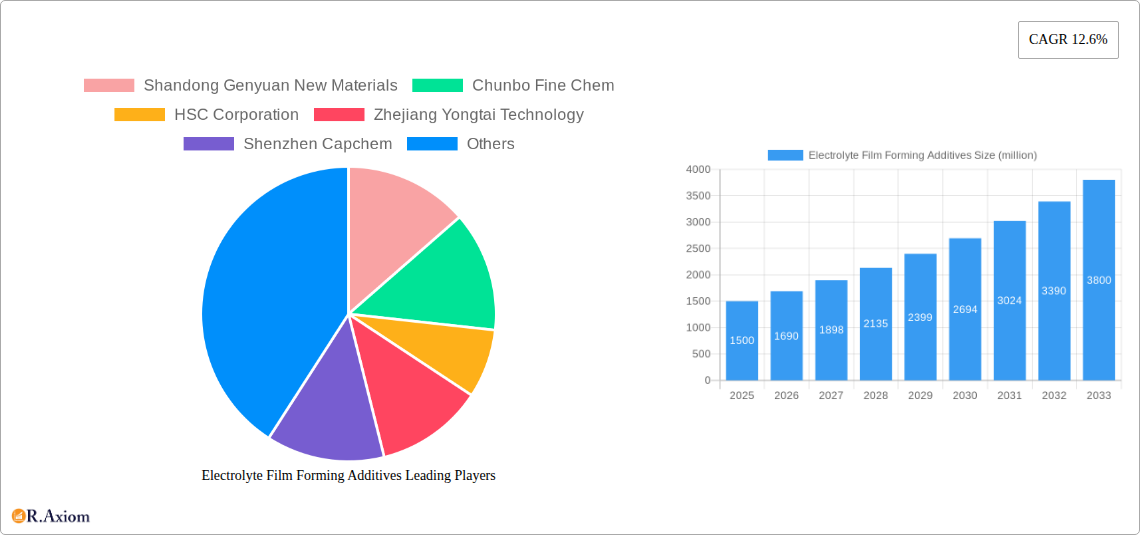
The global market for Electrolyte Film Forming Additives (EFFAs) is experiencing robust growth, projected to reach a substantial value by 2026, driven by the increasing demand for high-performance lithium-ion batteries (LIBs) in electric vehicles (EVs), energy storage systems (ESS), and portable electronics. The compound annual growth rate (CAGR) of 12.6% from 2019-2026 indicates a significant upward trajectory, fueled by advancements in battery technology focusing on improved energy density, lifespan, and safety. Key drivers include the global push for renewable energy sources, stringent emission regulations promoting EV adoption, and the burgeoning demand for grid-scale energy storage solutions. Furthermore, ongoing research and development in novel EFFA formulations are contributing to enhanced battery performance, leading to wider adoption across various applications. The market is segmented by additive type (e.g., vinylene carbonate, fluoroethylene carbonate), application (e.g., EVs, ESS), and geography, with key players like Shandong Genyuan New Materials, Chunbo Fine Chem, and HSC Corporation vying for market share through strategic partnerships, capacity expansions, and technological innovations. Competition is expected to intensify as the market matures, with a focus on cost reduction, performance optimization, and sustainable manufacturing practices.
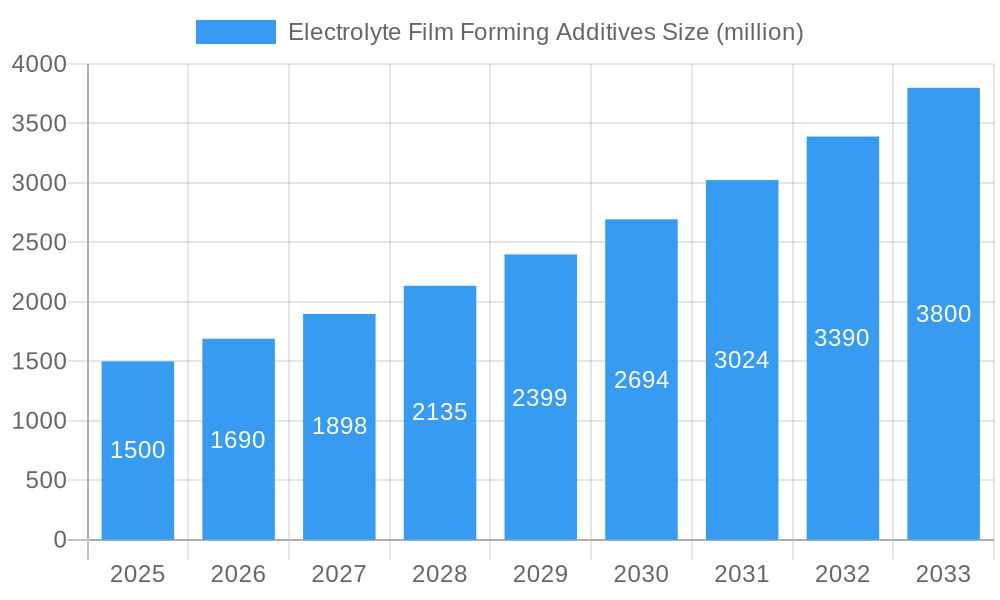
Electrolyte Film Forming Additives Market Size (In Billion)
The forecast period from 2025-2033 anticipates continued expansion of the EFFA market, albeit potentially at a slightly moderated CAGR, as the market reaches a larger scale. Sustained growth will be contingent on several factors, including the pace of EV adoption, advancements in battery chemistries beyond lithium-ion, and the emergence of alternative energy storage technologies. Challenges remain, such as ensuring the consistent supply of raw materials and navigating potential fluctuations in raw material prices. However, the long-term prospects remain positive, driven by the imperative for clean energy solutions and the continuous pursuit of higher-performing and more sustainable battery technologies. Strategic investments in research and development, coupled with effective supply chain management, will be crucial for companies to maintain a competitive edge in this dynamic and rapidly evolving market.
Electrolyte Film Forming Additives Company Market Share
This comprehensive report provides a detailed analysis of the global Electrolyte Film Forming Additives market, offering invaluable insights for industry stakeholders, investors, and strategic decision-makers. Covering the period 2019-2033, with a base year of 2025 and a forecast period of 2025-2033, this report meticulously examines market trends, competitive dynamics, and growth opportunities. The study leverages extensive primary and secondary research, incorporating data from reputable sources and expert interviews to deliver accurate and actionable information. The total market size is estimated at xx million in 2025, and is projected to reach xx million by 2033, exhibiting a CAGR of xx%.
Electrolyte Film Forming Additives Market Concentration & Innovation
This section analyzes the level of market concentration, identifying key players and their respective market shares. We explore the drivers of innovation, including R&D investments and technological advancements. The impact of regulatory frameworks, the presence of substitute products, and evolving end-user trends are also examined. Furthermore, the report delves into M&A activities within the industry, quantifying deal values and analyzing their strategic implications.
- Market Concentration: The market is moderately concentrated, with the top five players holding an estimated xx% market share in 2025. This concentration is expected to xx slightly by 2033 due to increased competition and market entry by new players.
- Innovation Drivers: Key innovation drivers include the development of high-performance additives with improved film-forming properties, enhanced thermal stability, and wider electrochemical windows. Significant R&D investments are being made by leading companies to develop next-generation additives.
- Regulatory Frameworks: Stringent environmental regulations and safety standards are influencing the development and adoption of eco-friendly electrolyte film forming additives. Compliance costs are expected to increase.
- Product Substitutes: The emergence of alternative technologies and materials poses a potential threat to the market, although the current market dominance of electrolyte film forming additives is strong.
- End-User Trends: The growing demand for high-energy-density batteries in electric vehicles and energy storage systems is driving the market for high-performance electrolyte film forming additives.
- M&A Activities: Over the historical period (2019-2024), the total value of M&A deals in the electrolyte film forming additives sector reached approximately xx million, with an average deal size of xx million. These transactions primarily focused on strengthening R&D capabilities and expanding market reach.
Electrolyte Film Forming Additives Industry Trends & Insights
This section provides a comprehensive overview of the industry's current trends and future prospects. It explores market growth drivers, including the increasing adoption of lithium-ion batteries and the expansion of the electric vehicle market. Technological disruptions, such as the emergence of solid-state batteries, are analyzed for their potential impact on the market. Consumer preferences and shifting demand patterns are examined, and a competitive landscape analysis is presented, highlighting key competitive dynamics and strategies.
The market is experiencing robust growth, driven primarily by the surging demand for electric vehicles and energy storage solutions. Technological advancements in battery chemistry and manufacturing processes are further fueling market expansion. However, price fluctuations in raw materials and the emergence of alternative technologies pose potential challenges. The market is expected to witness a CAGR of xx% during the forecast period (2025-2033), with significant market penetration in emerging economies. The penetration rate is currently at xx% and projected to reach xx% by 2033.
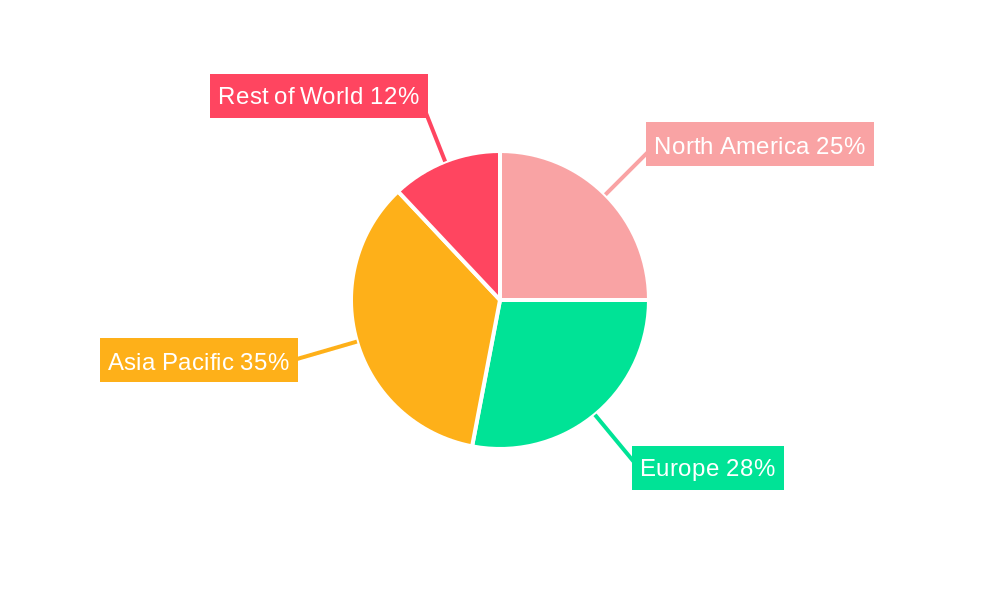
Dominant Markets & Segments in Electrolyte Film Forming Additives
This section identifies the leading regions, countries, and segments within the electrolyte film forming additives market. It analyzes the factors driving their dominance, such as economic policies, infrastructure development, and consumer preferences. A detailed analysis of each dominant market is provided, highlighting its unique characteristics and growth potential.
- Dominant Region: Asia-Pacific is the dominant region, driven by robust growth in the electric vehicle and electronics industries within China, Japan, and South Korea.
- Key Drivers in Asia-Pacific:
- Strong government support for electric vehicle adoption.
- Rapid growth of the electronics industry.
- Significant investments in battery manufacturing.
- Expanding infrastructure for renewable energy storage.
- Dominant Segment: The lithium-ion battery segment dominates the market, due to its wide application in various electronic devices and electric vehicles. The growth of this segment is largely driven by the rising demand for portable electronics and electric vehicles globally.
Electrolyte Film Forming Additives Product Developments
Recent product innovations focus on enhancing the performance characteristics of electrolyte film forming additives, such as improving ionic conductivity, thermal stability, and electrochemical window. New applications are emerging in advanced battery technologies and next-generation energy storage systems. Competitive advantages are being gained through proprietary formulations, superior manufacturing processes, and strong intellectual property portfolios. The ongoing trend of developing environmentally friendly and sustainable additives aligns with the growing emphasis on reducing the environmental impact of battery production.
Report Scope & Segmentation Analysis
This report provides a comprehensive segmentation analysis of the electrolyte film forming additives market based on type, application, and geography. The market is segmented by additive type (e.g., polymers, ceramic materials), application (e.g., lithium-ion batteries, supercapacitors), and region (e.g., North America, Europe, Asia-Pacific). Each segment is analyzed in detail, providing insights into its current market size, growth projections, and competitive landscape.
Key Drivers of Electrolyte Film Forming Additives Growth
The growth of the electrolyte film forming additives market is propelled by several key factors:
- Rising Demand for Electric Vehicles: The global shift towards electric mobility is a major driver, significantly increasing the demand for high-performance batteries.
- Growth of Renewable Energy Storage: The increasing adoption of renewable energy sources necessitates efficient energy storage solutions, driving the need for advanced electrolyte additives.
- Technological Advancements in Battery Technology: Continuous innovation in battery chemistry and design is leading to improved battery performance, requiring specialized additives.
Challenges in the Electrolyte Film Forming Additives Sector
The electrolyte film forming additives market faces several challenges:
- Fluctuating Raw Material Prices: Price volatility of key raw materials can impact production costs and profitability.
- Stringent Regulatory Compliance: Meeting increasingly stringent environmental and safety regulations adds complexity and cost.
- Intense Competition: The market is characterized by intense competition among established players and new entrants.
Emerging Opportunities in Electrolyte Film Forming Additives
Emerging opportunities include:
- Solid-State Battery Technology: The development of solid-state batteries presents a significant opportunity for specialized electrolyte film forming additives.
- Next-Generation Battery Chemistries: Advancements in battery chemistries, such as lithium-sulfur and lithium-air batteries, create new application areas.
- Expansion into Emerging Markets: Developing economies offer significant growth potential for electrolyte film forming additives.
Leading Players in the Electrolyte Film Forming Additives Market
- Shandong Genyuan New Materials
- Chunbo Fine Chem
- HSC Corporation
- Zhejiang Yongtai Technology
- Shenzhen Capchem
- Tinci Materials
- Suzhou Huayi
- Fujian Chuangxin Science and Technology
- BroaHony Group
- Suzhou Cheerchem Advanced Material
Key Developments in Electrolyte Film Forming Additives Industry
- Jan 2023: Company X launched a new line of high-performance electrolyte film forming additives with enhanced thermal stability.
- May 2022: Company Y announced a strategic partnership with a leading battery manufacturer to develop next-generation additives.
- Oct 2021: Company Z acquired a smaller competitor, expanding its product portfolio and market reach. (Further details on specific company activities would be added here in the full report.)
Strategic Outlook for Electrolyte Film Forming Additives Market
The electrolyte film forming additives market is poised for continued growth, driven by the increasing demand for electric vehicles, energy storage solutions, and technological advancements in battery technology. Emerging opportunities in solid-state batteries and next-generation battery chemistries will further fuel market expansion. Companies with strong R&D capabilities and a focus on innovation will be well-positioned to capitalize on the growth opportunities within this dynamic market.
Electrolyte Film Forming Additives Segmentation
-
1. Application
- 1.1. Power Electrolyte
- 1.2. Consumer Electrolyte
- 1.3. Energy Storage Electrolyte
-
2. Type
- 2.1. Vinylene Carbonate (VC)
- 2.2. Fluorinated Ethylene Carbonate (FEC)
- 2.3. 1,3-Propane Sultone (1,3-PS)
- 2.4. Vinyl Ethylene Carbonate (VEC)
- 2.5. Others
Electrolyte Film Forming Additives Segmentation By Geography
-
1. North America
- 1.1. United States
- 1.2. Canada
- 1.3. Mexico
-
2. South America
- 2.1. Brazil
- 2.2. Argentina
- 2.3. Rest of South America
-
3. Europe
- 3.1. United Kingdom
- 3.2. Germany
- 3.3. France
- 3.4. Italy
- 3.5. Spain
- 3.6. Russia
- 3.7. Benelux
- 3.8. Nordics
- 3.9. Rest of Europe
-
4. Middle East & Africa
- 4.1. Turkey
- 4.2. Israel
- 4.3. GCC
- 4.4. North Africa
- 4.5. South Africa
- 4.6. Rest of Middle East & Africa
-
5. Asia Pacific
- 5.1. China
- 5.2. India
- 5.3. Japan
- 5.4. South Korea
- 5.5. ASEAN
- 5.6. Oceania
- 5.7. Rest of Asia Pacific
Electrolyte Film Forming Additives Regional Market Share
Geographic Coverage of Electrolyte Film Forming Additives
Electrolyte Film Forming Additives REPORT HIGHLIGHTS
| Aspects | Details |
|---|---|
| Study Period | 2020-2034 |
| Base Year | 2025 |
| Estimated Year | 2026 |
| Forecast Period | 2026-2034 |
| Historical Period | 2020-2025 |
| Growth Rate | CAGR of 12.6% from 2020-2034 |
| Segmentation |
|
Table of Contents
- 1. Introduction
- 1.1. Research Scope
- 1.2. Market Segmentation
- 1.3. Research Objective
- 1.4. Definitions and Assumptions
- 2. Executive Summary
- 2.1. Market Snapshot
- 3. Market Dynamics
- 3.1. Market Drivers
- 3.2. Market Restrains
- 3.3. Market Trends
- 3.4. Market Opportunities
- 4. Market Factor Analysis
- 4.1. Porters Five Forces
- 4.1.1. Bargaining Power of Suppliers
- 4.1.2. Bargaining Power of Buyers
- 4.1.3. Threat of New Entrants
- 4.1.4. Threat of Substitutes
- 4.1.5. Competitive Rivalry
- 4.2. PESTEL analysis
- 4.3. BCG Analysis
- 4.3.1. Stars (High Growth, High Market Share)
- 4.3.2. Cash Cows (Low Growth, High Market Share)
- 4.3.3. Question Mark (High Growth, Low Market Share)
- 4.3.4. Dogs (Low Growth, Low Market Share)
- 4.4. Ansoff Matrix Analysis
- 4.5. Supply Chain Analysis
- 4.6. Regulatory Landscape
- 4.7. Current Market Potential and Opportunity Assessment (TAM–SAM–SOM Framework)
- 4.8. RAX Analyst Note
- 4.1. Porters Five Forces
- 5. Market Analysis, Insights and Forecast 2021-2033
- 5.1. Market Analysis, Insights and Forecast - by Application
- 5.1.1. Power Electrolyte
- 5.1.2. Consumer Electrolyte
- 5.1.3. Energy Storage Electrolyte
- 5.2. Market Analysis, Insights and Forecast - by Type
- 5.2.1. Vinylene Carbonate (VC)
- 5.2.2. Fluorinated Ethylene Carbonate (FEC)
- 5.2.3. 1,3-Propane Sultone (1,3-PS)
- 5.2.4. Vinyl Ethylene Carbonate (VEC)
- 5.2.5. Others
- 5.3. Market Analysis, Insights and Forecast - by Region
- 5.3.1. North America
- 5.3.2. South America
- 5.3.3. Europe
- 5.3.4. Middle East & Africa
- 5.3.5. Asia Pacific
- 5.1. Market Analysis, Insights and Forecast - by Application
- 6. Global Electrolyte Film Forming Additives Analysis, Insights and Forecast, 2021-2033
- 6.1. Market Analysis, Insights and Forecast - by Application
- 6.1.1. Power Electrolyte
- 6.1.2. Consumer Electrolyte
- 6.1.3. Energy Storage Electrolyte
- 6.2. Market Analysis, Insights and Forecast - by Type
- 6.2.1. Vinylene Carbonate (VC)
- 6.2.2. Fluorinated Ethylene Carbonate (FEC)
- 6.2.3. 1,3-Propane Sultone (1,3-PS)
- 6.2.4. Vinyl Ethylene Carbonate (VEC)
- 6.2.5. Others
- 6.1. Market Analysis, Insights and Forecast - by Application
- 7. North America Electrolyte Film Forming Additives Analysis, Insights and Forecast, 2020-2032
- 7.1. Market Analysis, Insights and Forecast - by Application
- 7.1.1. Power Electrolyte
- 7.1.2. Consumer Electrolyte
- 7.1.3. Energy Storage Electrolyte
- 7.2. Market Analysis, Insights and Forecast - by Type
- 7.2.1. Vinylene Carbonate (VC)
- 7.2.2. Fluorinated Ethylene Carbonate (FEC)
- 7.2.3. 1,3-Propane Sultone (1,3-PS)
- 7.2.4. Vinyl Ethylene Carbonate (VEC)
- 7.2.5. Others
- 7.1. Market Analysis, Insights and Forecast - by Application
- 8. South America Electrolyte Film Forming Additives Analysis, Insights and Forecast, 2020-2032
- 8.1. Market Analysis, Insights and Forecast - by Application
- 8.1.1. Power Electrolyte
- 8.1.2. Consumer Electrolyte
- 8.1.3. Energy Storage Electrolyte
- 8.2. Market Analysis, Insights and Forecast - by Type
- 8.2.1. Vinylene Carbonate (VC)
- 8.2.2. Fluorinated Ethylene Carbonate (FEC)
- 8.2.3. 1,3-Propane Sultone (1,3-PS)
- 8.2.4. Vinyl Ethylene Carbonate (VEC)
- 8.2.5. Others
- 8.1. Market Analysis, Insights and Forecast - by Application
- 9. Europe Electrolyte Film Forming Additives Analysis, Insights and Forecast, 2020-2032
- 9.1. Market Analysis, Insights and Forecast - by Application
- 9.1.1. Power Electrolyte
- 9.1.2. Consumer Electrolyte
- 9.1.3. Energy Storage Electrolyte
- 9.2. Market Analysis, Insights and Forecast - by Type
- 9.2.1. Vinylene Carbonate (VC)
- 9.2.2. Fluorinated Ethylene Carbonate (FEC)
- 9.2.3. 1,3-Propane Sultone (1,3-PS)
- 9.2.4. Vinyl Ethylene Carbonate (VEC)
- 9.2.5. Others
- 9.1. Market Analysis, Insights and Forecast - by Application
- 10. Middle East & Africa Electrolyte Film Forming Additives Analysis, Insights and Forecast, 2020-2032
- 10.1. Market Analysis, Insights and Forecast - by Application
- 10.1.1. Power Electrolyte
- 10.1.2. Consumer Electrolyte
- 10.1.3. Energy Storage Electrolyte
- 10.2. Market Analysis, Insights and Forecast - by Type
- 10.2.1. Vinylene Carbonate (VC)
- 10.2.2. Fluorinated Ethylene Carbonate (FEC)
- 10.2.3. 1,3-Propane Sultone (1,3-PS)
- 10.2.4. Vinyl Ethylene Carbonate (VEC)
- 10.2.5. Others
- 10.1. Market Analysis, Insights and Forecast - by Application
- 11. Asia Pacific Electrolyte Film Forming Additives Analysis, Insights and Forecast, 2020-2032
- 11.1. Market Analysis, Insights and Forecast - by Application
- 11.1.1. Power Electrolyte
- 11.1.2. Consumer Electrolyte
- 11.1.3. Energy Storage Electrolyte
- 11.2. Market Analysis, Insights and Forecast - by Type
- 11.2.1. Vinylene Carbonate (VC)
- 11.2.2. Fluorinated Ethylene Carbonate (FEC)
- 11.2.3. 1,3-Propane Sultone (1,3-PS)
- 11.2.4. Vinyl Ethylene Carbonate (VEC)
- 11.2.5. Others
- 11.1. Market Analysis, Insights and Forecast - by Application
- 12. Competitive Analysis
- 12.1. Company Profiles
- 12.1.1 Shandong Genyuan New Materials
- 12.1.1.1. Company Overview
- 12.1.1.2. Products
- 12.1.1.3. Company Financials
- 12.1.1.4. SWOT Analysis
- 12.1.2 Chunbo Fine Chem
- 12.1.2.1. Company Overview
- 12.1.2.2. Products
- 12.1.2.3. Company Financials
- 12.1.2.4. SWOT Analysis
- 12.1.3 HSC Corporation
- 12.1.3.1. Company Overview
- 12.1.3.2. Products
- 12.1.3.3. Company Financials
- 12.1.3.4. SWOT Analysis
- 12.1.4 Zhejiang Yongtai Technology
- 12.1.4.1. Company Overview
- 12.1.4.2. Products
- 12.1.4.3. Company Financials
- 12.1.4.4. SWOT Analysis
- 12.1.5 Shenzhen Capchem
- 12.1.5.1. Company Overview
- 12.1.5.2. Products
- 12.1.5.3. Company Financials
- 12.1.5.4. SWOT Analysis
- 12.1.6 Tinci Materials
- 12.1.6.1. Company Overview
- 12.1.6.2. Products
- 12.1.6.3. Company Financials
- 12.1.6.4. SWOT Analysis
- 12.1.7 Suzhou Huayi
- 12.1.7.1. Company Overview
- 12.1.7.2. Products
- 12.1.7.3. Company Financials
- 12.1.7.4. SWOT Analysis
- 12.1.8 Fujian Chuangxin Science and Technology
- 12.1.8.1. Company Overview
- 12.1.8.2. Products
- 12.1.8.3. Company Financials
- 12.1.8.4. SWOT Analysis
- 12.1.9 BroaHony Group
- 12.1.9.1. Company Overview
- 12.1.9.2. Products
- 12.1.9.3. Company Financials
- 12.1.9.4. SWOT Analysis
- 12.1.10 Suzhou Cheerchem Advanced Material
- 12.1.10.1. Company Overview
- 12.1.10.2. Products
- 12.1.10.3. Company Financials
- 12.1.10.4. SWOT Analysis
- 12.1.1 Shandong Genyuan New Materials
- 12.2. Market Entropy
- 12.2.1 Company's Key Areas Served
- 12.2.2 Recent Developments
- 12.3. Company Market Share Analysis 2025
- 12.3.1 Top 5 Companies Market Share Analysis
- 12.3.2 Top 3 Companies Market Share Analysis
- 12.4. List of Potential Customers
- 13. Research Methodology
List of Figures
- Figure 1: Global Electrolyte Film Forming Additives Revenue Breakdown (million, %) by Region 2025 & 2033
- Figure 2: Global Electrolyte Film Forming Additives Volume Breakdown (K, %) by Region 2025 & 2033
- Figure 3: North America Electrolyte Film Forming Additives Revenue (million), by Application 2025 & 2033
- Figure 4: North America Electrolyte Film Forming Additives Volume (K), by Application 2025 & 2033
- Figure 5: North America Electrolyte Film Forming Additives Revenue Share (%), by Application 2025 & 2033
- Figure 6: North America Electrolyte Film Forming Additives Volume Share (%), by Application 2025 & 2033
- Figure 7: North America Electrolyte Film Forming Additives Revenue (million), by Type 2025 & 2033
- Figure 8: North America Electrolyte Film Forming Additives Volume (K), by Type 2025 & 2033
- Figure 9: North America Electrolyte Film Forming Additives Revenue Share (%), by Type 2025 & 2033
- Figure 10: North America Electrolyte Film Forming Additives Volume Share (%), by Type 2025 & 2033
- Figure 11: North America Electrolyte Film Forming Additives Revenue (million), by Country 2025 & 2033
- Figure 12: North America Electrolyte Film Forming Additives Volume (K), by Country 2025 & 2033
- Figure 13: North America Electrolyte Film Forming Additives Revenue Share (%), by Country 2025 & 2033
- Figure 14: North America Electrolyte Film Forming Additives Volume Share (%), by Country 2025 & 2033
- Figure 15: South America Electrolyte Film Forming Additives Revenue (million), by Application 2025 & 2033
- Figure 16: South America Electrolyte Film Forming Additives Volume (K), by Application 2025 & 2033
- Figure 17: South America Electrolyte Film Forming Additives Revenue Share (%), by Application 2025 & 2033
- Figure 18: South America Electrolyte Film Forming Additives Volume Share (%), by Application 2025 & 2033
- Figure 19: South America Electrolyte Film Forming Additives Revenue (million), by Type 2025 & 2033
- Figure 20: South America Electrolyte Film Forming Additives Volume (K), by Type 2025 & 2033
- Figure 21: South America Electrolyte Film Forming Additives Revenue Share (%), by Type 2025 & 2033
- Figure 22: South America Electrolyte Film Forming Additives Volume Share (%), by Type 2025 & 2033
- Figure 23: South America Electrolyte Film Forming Additives Revenue (million), by Country 2025 & 2033
- Figure 24: South America Electrolyte Film Forming Additives Volume (K), by Country 2025 & 2033
- Figure 25: South America Electrolyte Film Forming Additives Revenue Share (%), by Country 2025 & 2033
- Figure 26: South America Electrolyte Film Forming Additives Volume Share (%), by Country 2025 & 2033
- Figure 27: Europe Electrolyte Film Forming Additives Revenue (million), by Application 2025 & 2033
- Figure 28: Europe Electrolyte Film Forming Additives Volume (K), by Application 2025 & 2033
- Figure 29: Europe Electrolyte Film Forming Additives Revenue Share (%), by Application 2025 & 2033
- Figure 30: Europe Electrolyte Film Forming Additives Volume Share (%), by Application 2025 & 2033
- Figure 31: Europe Electrolyte Film Forming Additives Revenue (million), by Type 2025 & 2033
- Figure 32: Europe Electrolyte Film Forming Additives Volume (K), by Type 2025 & 2033
- Figure 33: Europe Electrolyte Film Forming Additives Revenue Share (%), by Type 2025 & 2033
- Figure 34: Europe Electrolyte Film Forming Additives Volume Share (%), by Type 2025 & 2033
- Figure 35: Europe Electrolyte Film Forming Additives Revenue (million), by Country 2025 & 2033
- Figure 36: Europe Electrolyte Film Forming Additives Volume (K), by Country 2025 & 2033
- Figure 37: Europe Electrolyte Film Forming Additives Revenue Share (%), by Country 2025 & 2033
- Figure 38: Europe Electrolyte Film Forming Additives Volume Share (%), by Country 2025 & 2033
- Figure 39: Middle East & Africa Electrolyte Film Forming Additives Revenue (million), by Application 2025 & 2033
- Figure 40: Middle East & Africa Electrolyte Film Forming Additives Volume (K), by Application 2025 & 2033
- Figure 41: Middle East & Africa Electrolyte Film Forming Additives Revenue Share (%), by Application 2025 & 2033
- Figure 42: Middle East & Africa Electrolyte Film Forming Additives Volume Share (%), by Application 2025 & 2033
- Figure 43: Middle East & Africa Electrolyte Film Forming Additives Revenue (million), by Type 2025 & 2033
- Figure 44: Middle East & Africa Electrolyte Film Forming Additives Volume (K), by Type 2025 & 2033
- Figure 45: Middle East & Africa Electrolyte Film Forming Additives Revenue Share (%), by Type 2025 & 2033
- Figure 46: Middle East & Africa Electrolyte Film Forming Additives Volume Share (%), by Type 2025 & 2033
- Figure 47: Middle East & Africa Electrolyte Film Forming Additives Revenue (million), by Country 2025 & 2033
- Figure 48: Middle East & Africa Electrolyte Film Forming Additives Volume (K), by Country 2025 & 2033
- Figure 49: Middle East & Africa Electrolyte Film Forming Additives Revenue Share (%), by Country 2025 & 2033
- Figure 50: Middle East & Africa Electrolyte Film Forming Additives Volume Share (%), by Country 2025 & 2033
- Figure 51: Asia Pacific Electrolyte Film Forming Additives Revenue (million), by Application 2025 & 2033
- Figure 52: Asia Pacific Electrolyte Film Forming Additives Volume (K), by Application 2025 & 2033
- Figure 53: Asia Pacific Electrolyte Film Forming Additives Revenue Share (%), by Application 2025 & 2033
- Figure 54: Asia Pacific Electrolyte Film Forming Additives Volume Share (%), by Application 2025 & 2033
- Figure 55: Asia Pacific Electrolyte Film Forming Additives Revenue (million), by Type 2025 & 2033
- Figure 56: Asia Pacific Electrolyte Film Forming Additives Volume (K), by Type 2025 & 2033
- Figure 57: Asia Pacific Electrolyte Film Forming Additives Revenue Share (%), by Type 2025 & 2033
- Figure 58: Asia Pacific Electrolyte Film Forming Additives Volume Share (%), by Type 2025 & 2033
- Figure 59: Asia Pacific Electrolyte Film Forming Additives Revenue (million), by Country 2025 & 2033
- Figure 60: Asia Pacific Electrolyte Film Forming Additives Volume (K), by Country 2025 & 2033
- Figure 61: Asia Pacific Electrolyte Film Forming Additives Revenue Share (%), by Country 2025 & 2033
- Figure 62: Asia Pacific Electrolyte Film Forming Additives Volume Share (%), by Country 2025 & 2033
List of Tables
- Table 1: Global Electrolyte Film Forming Additives Revenue million Forecast, by Application 2020 & 2033
- Table 2: Global Electrolyte Film Forming Additives Volume K Forecast, by Application 2020 & 2033
- Table 3: Global Electrolyte Film Forming Additives Revenue million Forecast, by Type 2020 & 2033
- Table 4: Global Electrolyte Film Forming Additives Volume K Forecast, by Type 2020 & 2033
- Table 5: Global Electrolyte Film Forming Additives Revenue million Forecast, by Region 2020 & 2033
- Table 6: Global Electrolyte Film Forming Additives Volume K Forecast, by Region 2020 & 2033
- Table 7: Global Electrolyte Film Forming Additives Revenue million Forecast, by Application 2020 & 2033
- Table 8: Global Electrolyte Film Forming Additives Volume K Forecast, by Application 2020 & 2033
- Table 9: Global Electrolyte Film Forming Additives Revenue million Forecast, by Type 2020 & 2033
- Table 10: Global Electrolyte Film Forming Additives Volume K Forecast, by Type 2020 & 2033
- Table 11: Global Electrolyte Film Forming Additives Revenue million Forecast, by Country 2020 & 2033
- Table 12: Global Electrolyte Film Forming Additives Volume K Forecast, by Country 2020 & 2033
- Table 13: United States Electrolyte Film Forming Additives Revenue (million) Forecast, by Application 2020 & 2033
- Table 14: United States Electrolyte Film Forming Additives Volume (K) Forecast, by Application 2020 & 2033
- Table 15: Canada Electrolyte Film Forming Additives Revenue (million) Forecast, by Application 2020 & 2033
- Table 16: Canada Electrolyte Film Forming Additives Volume (K) Forecast, by Application 2020 & 2033
- Table 17: Mexico Electrolyte Film Forming Additives Revenue (million) Forecast, by Application 2020 & 2033
- Table 18: Mexico Electrolyte Film Forming Additives Volume (K) Forecast, by Application 2020 & 2033
- Table 19: Global Electrolyte Film Forming Additives Revenue million Forecast, by Application 2020 & 2033
- Table 20: Global Electrolyte Film Forming Additives Volume K Forecast, by Application 2020 & 2033
- Table 21: Global Electrolyte Film Forming Additives Revenue million Forecast, by Type 2020 & 2033
- Table 22: Global Electrolyte Film Forming Additives Volume K Forecast, by Type 2020 & 2033
- Table 23: Global Electrolyte Film Forming Additives Revenue million Forecast, by Country 2020 & 2033
- Table 24: Global Electrolyte Film Forming Additives Volume K Forecast, by Country 2020 & 2033
- Table 25: Brazil Electrolyte Film Forming Additives Revenue (million) Forecast, by Application 2020 & 2033
- Table 26: Brazil Electrolyte Film Forming Additives Volume (K) Forecast, by Application 2020 & 2033
- Table 27: Argentina Electrolyte Film Forming Additives Revenue (million) Forecast, by Application 2020 & 2033
- Table 28: Argentina Electrolyte Film Forming Additives Volume (K) Forecast, by Application 2020 & 2033
- Table 29: Rest of South America Electrolyte Film Forming Additives Revenue (million) Forecast, by Application 2020 & 2033
- Table 30: Rest of South America Electrolyte Film Forming Additives Volume (K) Forecast, by Application 2020 & 2033
- Table 31: Global Electrolyte Film Forming Additives Revenue million Forecast, by Application 2020 & 2033
- Table 32: Global Electrolyte Film Forming Additives Volume K Forecast, by Application 2020 & 2033
- Table 33: Global Electrolyte Film Forming Additives Revenue million Forecast, by Type 2020 & 2033
- Table 34: Global Electrolyte Film Forming Additives Volume K Forecast, by Type 2020 & 2033
- Table 35: Global Electrolyte Film Forming Additives Revenue million Forecast, by Country 2020 & 2033
- Table 36: Global Electrolyte Film Forming Additives Volume K Forecast, by Country 2020 & 2033
- Table 37: United Kingdom Electrolyte Film Forming Additives Revenue (million) Forecast, by Application 2020 & 2033
- Table 38: United Kingdom Electrolyte Film Forming Additives Volume (K) Forecast, by Application 2020 & 2033
- Table 39: Germany Electrolyte Film Forming Additives Revenue (million) Forecast, by Application 2020 & 2033
- Table 40: Germany Electrolyte Film Forming Additives Volume (K) Forecast, by Application 2020 & 2033
- Table 41: France Electrolyte Film Forming Additives Revenue (million) Forecast, by Application 2020 & 2033
- Table 42: France Electrolyte Film Forming Additives Volume (K) Forecast, by Application 2020 & 2033
- Table 43: Italy Electrolyte Film Forming Additives Revenue (million) Forecast, by Application 2020 & 2033
- Table 44: Italy Electrolyte Film Forming Additives Volume (K) Forecast, by Application 2020 & 2033
- Table 45: Spain Electrolyte Film Forming Additives Revenue (million) Forecast, by Application 2020 & 2033
- Table 46: Spain Electrolyte Film Forming Additives Volume (K) Forecast, by Application 2020 & 2033
- Table 47: Russia Electrolyte Film Forming Additives Revenue (million) Forecast, by Application 2020 & 2033
- Table 48: Russia Electrolyte Film Forming Additives Volume (K) Forecast, by Application 2020 & 2033
- Table 49: Benelux Electrolyte Film Forming Additives Revenue (million) Forecast, by Application 2020 & 2033
- Table 50: Benelux Electrolyte Film Forming Additives Volume (K) Forecast, by Application 2020 & 2033
- Table 51: Nordics Electrolyte Film Forming Additives Revenue (million) Forecast, by Application 2020 & 2033
- Table 52: Nordics Electrolyte Film Forming Additives Volume (K) Forecast, by Application 2020 & 2033
- Table 53: Rest of Europe Electrolyte Film Forming Additives Revenue (million) Forecast, by Application 2020 & 2033
- Table 54: Rest of Europe Electrolyte Film Forming Additives Volume (K) Forecast, by Application 2020 & 2033
- Table 55: Global Electrolyte Film Forming Additives Revenue million Forecast, by Application 2020 & 2033
- Table 56: Global Electrolyte Film Forming Additives Volume K Forecast, by Application 2020 & 2033
- Table 57: Global Electrolyte Film Forming Additives Revenue million Forecast, by Type 2020 & 2033
- Table 58: Global Electrolyte Film Forming Additives Volume K Forecast, by Type 2020 & 2033
- Table 59: Global Electrolyte Film Forming Additives Revenue million Forecast, by Country 2020 & 2033
- Table 60: Global Electrolyte Film Forming Additives Volume K Forecast, by Country 2020 & 2033
- Table 61: Turkey Electrolyte Film Forming Additives Revenue (million) Forecast, by Application 2020 & 2033
- Table 62: Turkey Electrolyte Film Forming Additives Volume (K) Forecast, by Application 2020 & 2033
- Table 63: Israel Electrolyte Film Forming Additives Revenue (million) Forecast, by Application 2020 & 2033
- Table 64: Israel Electrolyte Film Forming Additives Volume (K) Forecast, by Application 2020 & 2033
- Table 65: GCC Electrolyte Film Forming Additives Revenue (million) Forecast, by Application 2020 & 2033
- Table 66: GCC Electrolyte Film Forming Additives Volume (K) Forecast, by Application 2020 & 2033
- Table 67: North Africa Electrolyte Film Forming Additives Revenue (million) Forecast, by Application 2020 & 2033
- Table 68: North Africa Electrolyte Film Forming Additives Volume (K) Forecast, by Application 2020 & 2033
- Table 69: South Africa Electrolyte Film Forming Additives Revenue (million) Forecast, by Application 2020 & 2033
- Table 70: South Africa Electrolyte Film Forming Additives Volume (K) Forecast, by Application 2020 & 2033
- Table 71: Rest of Middle East & Africa Electrolyte Film Forming Additives Revenue (million) Forecast, by Application 2020 & 2033
- Table 72: Rest of Middle East & Africa Electrolyte Film Forming Additives Volume (K) Forecast, by Application 2020 & 2033
- Table 73: Global Electrolyte Film Forming Additives Revenue million Forecast, by Application 2020 & 2033
- Table 74: Global Electrolyte Film Forming Additives Volume K Forecast, by Application 2020 & 2033
- Table 75: Global Electrolyte Film Forming Additives Revenue million Forecast, by Type 2020 & 2033
- Table 76: Global Electrolyte Film Forming Additives Volume K Forecast, by Type 2020 & 2033
- Table 77: Global Electrolyte Film Forming Additives Revenue million Forecast, by Country 2020 & 2033
- Table 78: Global Electrolyte Film Forming Additives Volume K Forecast, by Country 2020 & 2033
- Table 79: China Electrolyte Film Forming Additives Revenue (million) Forecast, by Application 2020 & 2033
- Table 80: China Electrolyte Film Forming Additives Volume (K) Forecast, by Application 2020 & 2033
- Table 81: India Electrolyte Film Forming Additives Revenue (million) Forecast, by Application 2020 & 2033
- Table 82: India Electrolyte Film Forming Additives Volume (K) Forecast, by Application 2020 & 2033
- Table 83: Japan Electrolyte Film Forming Additives Revenue (million) Forecast, by Application 2020 & 2033
- Table 84: Japan Electrolyte Film Forming Additives Volume (K) Forecast, by Application 2020 & 2033
- Table 85: South Korea Electrolyte Film Forming Additives Revenue (million) Forecast, by Application 2020 & 2033
- Table 86: South Korea Electrolyte Film Forming Additives Volume (K) Forecast, by Application 2020 & 2033
- Table 87: ASEAN Electrolyte Film Forming Additives Revenue (million) Forecast, by Application 2020 & 2033
- Table 88: ASEAN Electrolyte Film Forming Additives Volume (K) Forecast, by Application 2020 & 2033
- Table 89: Oceania Electrolyte Film Forming Additives Revenue (million) Forecast, by Application 2020 & 2033
- Table 90: Oceania Electrolyte Film Forming Additives Volume (K) Forecast, by Application 2020 & 2033
- Table 91: Rest of Asia Pacific Electrolyte Film Forming Additives Revenue (million) Forecast, by Application 2020 & 2033
- Table 92: Rest of Asia Pacific Electrolyte Film Forming Additives Volume (K) Forecast, by Application 2020 & 2033
Frequently Asked Questions
1. What is the projected Compound Annual Growth Rate (CAGR) of the Electrolyte Film Forming Additives?
The projected CAGR is approximately 12.6%.
2. Which companies are prominent players in the Electrolyte Film Forming Additives?
Key companies in the market include Shandong Genyuan New Materials, Chunbo Fine Chem, HSC Corporation, Zhejiang Yongtai Technology, Shenzhen Capchem, Tinci Materials, Suzhou Huayi, Fujian Chuangxin Science and Technology, BroaHony Group, Suzhou Cheerchem Advanced Material.
3. What are the main segments of the Electrolyte Film Forming Additives?
The market segments include Application, Type.
4. Can you provide details about the market size?
The market size is estimated to be USD 2026 million as of 2022.
5. What are some drivers contributing to market growth?
N/A
6. What are the notable trends driving market growth?
N/A
7. Are there any restraints impacting market growth?
N/A
8. Can you provide examples of recent developments in the market?
N/A
9. What pricing options are available for accessing the report?
Pricing options include single-user, multi-user, and enterprise licenses priced at USD 3950.00, USD 5925.00, and USD 7900.00 respectively.
10. Is the market size provided in terms of value or volume?
The market size is provided in terms of value, measured in million and volume, measured in K.
11. Are there any specific market keywords associated with the report?
Yes, the market keyword associated with the report is "Electrolyte Film Forming Additives," which aids in identifying and referencing the specific market segment covered.
12. How do I determine which pricing option suits my needs best?
The pricing options vary based on user requirements and access needs. Individual users may opt for single-user licenses, while businesses requiring broader access may choose multi-user or enterprise licenses for cost-effective access to the report.
13. Are there any additional resources or data provided in the Electrolyte Film Forming Additives report?
While the report offers comprehensive insights, it's advisable to review the specific contents or supplementary materials provided to ascertain if additional resources or data are available.
14. How can I stay updated on further developments or reports in the Electrolyte Film Forming Additives?
To stay informed about further developments, trends, and reports in the Electrolyte Film Forming Additives, consider subscribing to industry newsletters, following relevant companies and organizations, or regularly checking reputable industry news sources and publications.
Methodology
Step 1 - Identification of Relevant Samples Size from Population Database


Step 2 - Approaches for Defining Global Market Size (Value, Volume* & Price*)

Note*: In applicable scenarios
Step 3 - Data Sources
Primary Research
- Web Analytics
- Survey Reports
- Research Institute
- Latest Research Reports
- Opinion Leaders
Secondary Research
- Annual Reports
- White Paper
- Latest Press Release
- Industry Association
- Paid Database
- Investor Presentations

Step 4 - Data Triangulation
Involves using different sources of information in order to increase the validity of a study
These sources are likely to be stakeholders in a program - participants, other researchers, program staff, other community members, and so on.
Then we put all data in single framework & apply various statistical tools to find out the dynamic on the market.
During the analysis stage, feedback from the stakeholder groups would be compared to determine areas of agreement as well as areas of divergence