


Key Insights
The global electronic and electrical thermal conductive silicone sheet market is poised for significant expansion, driven by the escalating need for sophisticated thermal management in electronic and electrical devices. The ongoing trend of electronic miniaturization and the increasing power density of components necessitate effective heat dissipation to prevent overheating, ensuring optimal performance and extended product lifespan. This demand is particularly strong in rapidly growing sectors including consumer electronics (smartphones, laptops, tablets), electric vehicles (EVs), and data centers, where efficient thermal control is paramount. The market is segmented by application (consumer electronics, automotive, industrial), material type (silicone rubber, silicone gel), and region. Leading companies like Shin-Etsu Chemical, Sekisui Polymatech, and 3M are actively investing in research and development to enhance the thermal conductivity, flexibility, and durability of their silicone sheet products. This competitive environment fosters innovation and accelerates the adoption of advanced materials with superior thermal properties.
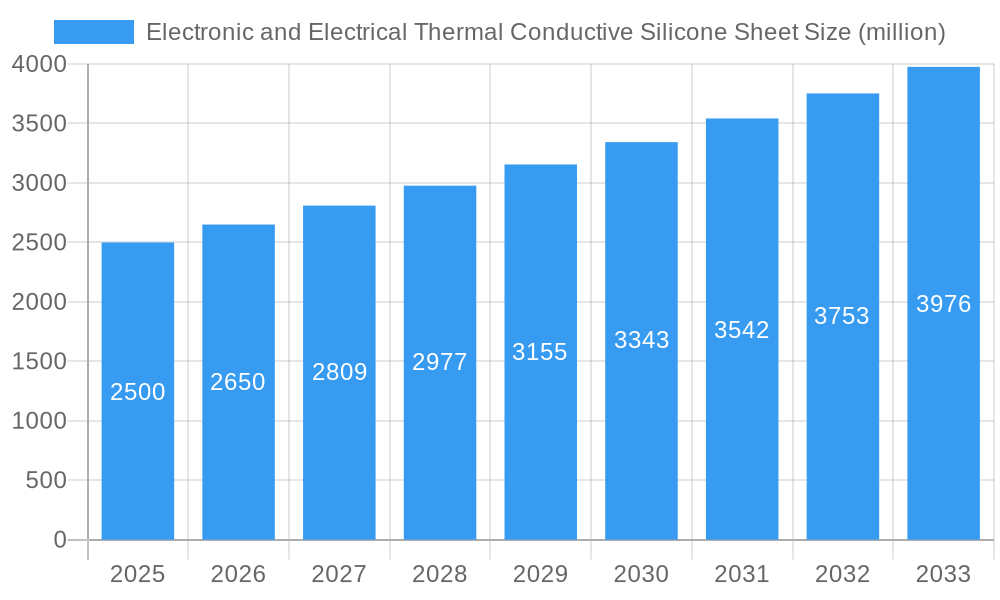
Electronic and Electrical Thermal Conductive Silicone Sheet Market Size (In Billion)

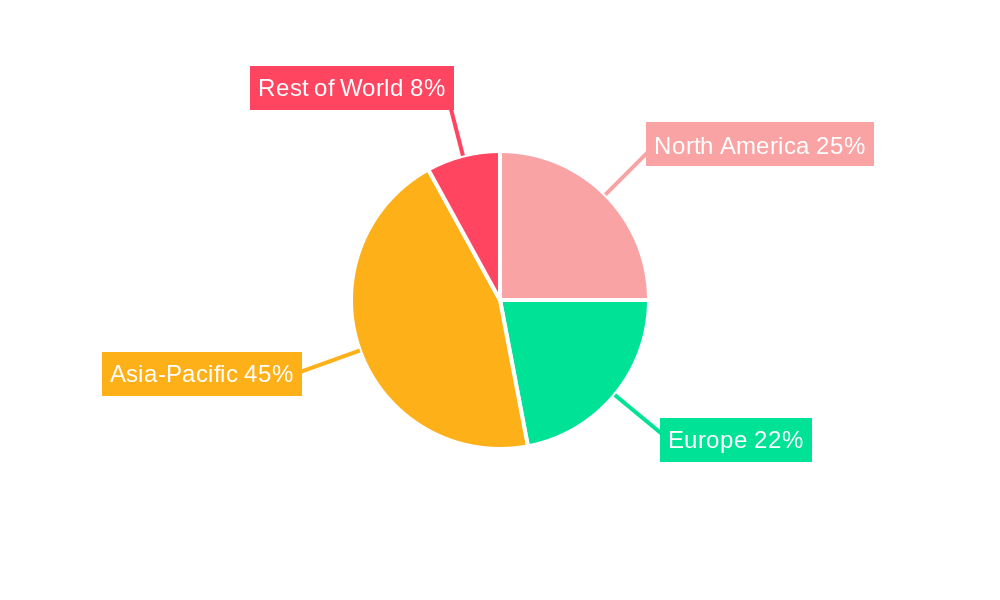
The market is projected to achieve a Compound Annual Growth Rate (CAGR) of 7%, with an estimated market size of 11210 million in the 2025 base year. While challenges such as fluctuating material costs and the availability of alternative thermal management solutions persist, the overall market trajectory is highly positive. The persistent demand for high-performance electronic devices and the stringent thermal management requirements for next-generation technologies are expected to counterbalance these challenges, sustaining robust market growth. Asia-Pacific is anticipated to lead the market due to the concentration of electronics manufacturing and the rapid expansion of consumer electronics markets in the region. North America and Europe are also expected to experience substantial growth, driven by technological advancements and stringent environmental regulations.
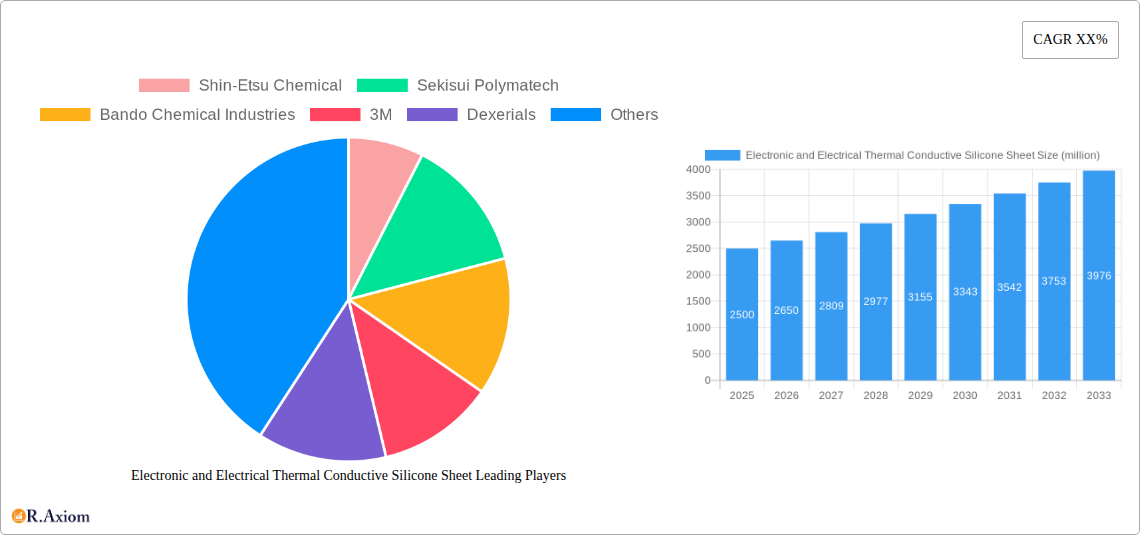
Electronic and Electrical Thermal Conductive Silicone Sheet Company Market Share
Electronic and Electrical Thermal Conductive Silicone Sheet Market Report: 2019-2033
This comprehensive report provides an in-depth analysis of the global Electronic and Electrical Thermal Conductive Silicone Sheet market, offering invaluable insights for stakeholders across the value chain. The study covers the period from 2019 to 2033, with 2025 as the base year and estimated year. The report meticulously examines market size, growth drivers, challenges, opportunities, and competitive dynamics, providing a 360-degree view of this crucial sector. The total market size is projected to reach xx million by 2033.
Electronic and Electrical Thermal Conductive Silicone Sheet Market Concentration & Innovation
This section analyzes the level of market concentration, identifying key players and their market share. Innovation drivers, including advancements in material science and manufacturing techniques, are explored, along with their impact on market growth. The regulatory landscape and its influence on product development and market access are also examined. The report assesses the presence of substitute products and their competitive threat. Finally, it analyzes end-user trends and their effect on demand, alongside a review of recent mergers and acquisitions (M&A) activities within the industry.
- Market Concentration: The market is moderately concentrated, with the top 5 players holding approximately xx% of the market share in 2025.
- Innovation Drivers: Advancements in silicone formulation for improved thermal conductivity, the development of thinner and more flexible sheets, and integration with other materials are key drivers of innovation.
- Regulatory Framework: Compliance with RoHS and REACH regulations significantly impacts material selection and manufacturing processes.
- Product Substitutes: Other thermal interface materials (TIMs) such as thermal pads and greases pose competitive pressure.
- M&A Activities: The past five years have witnessed xx million in M&A activity, primarily focused on expanding product portfolios and geographic reach. Specific deals include [mention specific deals if available, otherwise state "Details unavailable"].
Electronic and Electrical Thermal Conductive Silicone Sheet Industry Trends & Insights
This section delves into the key trends shaping the market's trajectory. The report analyzes market growth drivers, technological disruptions, evolving consumer preferences (e.g., demand for thinner and more efficient products), and the complex interplay of competitive dynamics. Specific metrics, including the Compound Annual Growth Rate (CAGR) and market penetration rates for key segments, are provided to quantify these trends. The forecast period CAGR is estimated at xx%. Market penetration in the electronics sector is expected to reach xx% by 2033.
Dominant Markets & Segments in Electronic and Electrical Thermal Conductive Silicone Sheet
This section pinpoints the leading regions, countries, and segments within the Electronic and Electrical Thermal Conductive Silicone Sheet market. A detailed dominance analysis is presented, supported by specific data and insights.
- Dominant Region: Asia-Pacific is currently the dominant region, driven by the burgeoning electronics manufacturing sector in countries like China and South Korea.
- Key Drivers (Asia-Pacific):
- Rapid growth of the consumer electronics industry.
- Significant investments in renewable energy infrastructure.
- Government initiatives promoting technological advancement.
- Favorable economic conditions.
Electronic and Electrical Thermal Conductive Silicone Sheet Product Developments
This section summarizes recent product innovations, highlighting their applications and competitive advantages. It emphasizes technological trends impacting the market and assesses the market fit of new products. The development of higher thermal conductivity materials, thinner profiles for space-saving applications in compact devices, and improved adhesion properties are key areas of focus. XX million has been invested in R&D in 2024.
Report Scope & Segmentation Analysis
This report provides a detailed segmentation of the Electronic and Electrical Thermal Conductive Silicone Sheet market based on [mention segmentation criteria like material type, thickness, application, end-use industry etc.]. Growth projections, market sizes, and competitive dynamics are provided for each segment. For example, the high-performance segment is projected to experience significant growth due to [mention specific reasons].
Key Drivers of Electronic and Electrical Thermal Conductive Silicone Sheet Growth
Several factors are driving the growth of the Electronic and Electrical Thermal Conductive Silicone Sheet market. These include the increasing demand for heat dissipation solutions in high-power electronic devices, the miniaturization of electronics leading to higher power densities, and the growing adoption of renewable energy technologies. Furthermore, stringent regulatory requirements regarding energy efficiency are pushing market expansion.
Challenges in the Electronic and Electrical Thermal Conductive Silicone Sheet Sector
The market faces challenges such as fluctuations in raw material prices, the complexity of manufacturing high-performance materials, and intense competition from alternative thermal management solutions. Supply chain disruptions can also significantly impact production and availability, leading to potential price increases. The overall impact of these challenges on market growth is estimated to be xx%.
Emerging Opportunities in Electronic and Electrical Thermal Conductive Silicone Sheet
Emerging opportunities include the growth of electric vehicles, the expansion of 5G infrastructure, and the rising adoption of advanced manufacturing technologies. The development of novel materials with enhanced thermal properties and the exploration of new applications in diverse industries present substantial growth prospects.
Leading Players in the Electronic and Electrical Thermal Conductive Silicone Sheet Market
- Shin-Etsu Chemical
- Sekisui Polymatech
- Bando Chemical Industries
- 3M
- Dexerials
- Qanta Group
- Shenzhen Sancos Electronic Materials
- Du Rui New Materials
Key Developments in Electronic and Electrical Thermal Conductive Silicone Sheet Industry
- 2023 Q4: Shin-Etsu Chemical launched a new high-thermal conductivity silicone sheet with improved adhesion.
- 2022 Q3: Sekisui Polymatech acquired a smaller competitor, expanding its market share.
- 2021 Q1: 3M introduced a thinner silicone sheet for use in smaller electronic devices.
- [Add more key developments with specific dates if available. Otherwise, use "Further details unavailable."]
Strategic Outlook for Electronic and Electrical Thermal Conductive Silicone Sheet Market
The Electronic and Electrical Thermal Conductive Silicone Sheet market is poised for continued growth, driven by technological advancements and increasing demand from various industries. Focus on innovation, strategic partnerships, and expansion into new markets will be crucial for companies to succeed in this dynamic landscape. The market's future potential is significant, with opportunities for substantial market share gains for companies that can effectively address the challenges and capitalize on the emerging trends.
Electronic and Electrical Thermal Conductive Silicone Sheet Segmentation
-
1. Application
- 1.1. Power Cooling
- 1.2. Chip Cooling
- 1.3. Others
-
2. Types
- 2.1. Thermal Conductivity 2-5W/m·K
- 2.2. Thermal Conductivity 5-8W/m·K
- 2.3. Thermal Conductivity 8-12W/m·K
- 2.4. Others
Electronic and Electrical Thermal Conductive Silicone Sheet Segmentation By Geography
-
1. North America
- 1.1. United States
- 1.2. Canada
- 1.3. Mexico
-
2. South America
- 2.1. Brazil
- 2.2. Argentina
- 2.3. Rest of South America
-
3. Europe
- 3.1. United Kingdom
- 3.2. Germany
- 3.3. France
- 3.4. Italy
- 3.5. Spain
- 3.6. Russia
- 3.7. Benelux
- 3.8. Nordics
- 3.9. Rest of Europe
-
4. Middle East & Africa
- 4.1. Turkey
- 4.2. Israel
- 4.3. GCC
- 4.4. North Africa
- 4.5. South Africa
- 4.6. Rest of Middle East & Africa
-
5. Asia Pacific
- 5.1. China
- 5.2. India
- 5.3. Japan
- 5.4. South Korea
- 5.5. ASEAN
- 5.6. Oceania
- 5.7. Rest of Asia Pacific
Electronic and Electrical Thermal Conductive Silicone Sheet Regional Market Share
Geographic Coverage of Electronic and Electrical Thermal Conductive Silicone Sheet
Electronic and Electrical Thermal Conductive Silicone Sheet REPORT HIGHLIGHTS
| Aspects | Details |
|---|---|
| Study Period | 2020-2034 |
| Base Year | 2025 |
| Estimated Year | 2026 |
| Forecast Period | 2026-2034 |
| Historical Period | 2020-2025 |
| Growth Rate | CAGR of 7% from 2020-2034 |
| Segmentation |
|
Table of Contents
- 1. Introduction
- 1.1. Research Scope
- 1.2. Market Segmentation
- 1.3. Research Methodology
- 1.4. Definitions and Assumptions
- 2. Executive Summary
- 2.1. Introduction
- 3. Market Dynamics
- 3.1. Introduction
- 3.2. Market Drivers
- 3.3. Market Restrains
- 3.4. Market Trends
- 4. Market Factor Analysis
- 4.1. Porters Five Forces
- 4.2. Supply/Value Chain
- 4.3. PESTEL analysis
- 4.4. Market Entropy
- 4.5. Patent/Trademark Analysis
- 5. Global Electronic and Electrical Thermal Conductive Silicone Sheet Analysis, Insights and Forecast, 2020-2032
- 5.1. Market Analysis, Insights and Forecast - by Application
- 5.1.1. Power Cooling
- 5.1.2. Chip Cooling
- 5.1.3. Others
- 5.2. Market Analysis, Insights and Forecast - by Types
- 5.2.1. Thermal Conductivity 2-5W/m·K
- 5.2.2. Thermal Conductivity 5-8W/m·K
- 5.2.3. Thermal Conductivity 8-12W/m·K
- 5.2.4. Others
- 5.3. Market Analysis, Insights and Forecast - by Region
- 5.3.1. North America
- 5.3.2. South America
- 5.3.3. Europe
- 5.3.4. Middle East & Africa
- 5.3.5. Asia Pacific
- 5.1. Market Analysis, Insights and Forecast - by Application
- 6. North America Electronic and Electrical Thermal Conductive Silicone Sheet Analysis, Insights and Forecast, 2020-2032
- 6.1. Market Analysis, Insights and Forecast - by Application
- 6.1.1. Power Cooling
- 6.1.2. Chip Cooling
- 6.1.3. Others
- 6.2. Market Analysis, Insights and Forecast - by Types
- 6.2.1. Thermal Conductivity 2-5W/m·K
- 6.2.2. Thermal Conductivity 5-8W/m·K
- 6.2.3. Thermal Conductivity 8-12W/m·K
- 6.2.4. Others
- 6.1. Market Analysis, Insights and Forecast - by Application
- 7. South America Electronic and Electrical Thermal Conductive Silicone Sheet Analysis, Insights and Forecast, 2020-2032
- 7.1. Market Analysis, Insights and Forecast - by Application
- 7.1.1. Power Cooling
- 7.1.2. Chip Cooling
- 7.1.3. Others
- 7.2. Market Analysis, Insights and Forecast - by Types
- 7.2.1. Thermal Conductivity 2-5W/m·K
- 7.2.2. Thermal Conductivity 5-8W/m·K
- 7.2.3. Thermal Conductivity 8-12W/m·K
- 7.2.4. Others
- 7.1. Market Analysis, Insights and Forecast - by Application
- 8. Europe Electronic and Electrical Thermal Conductive Silicone Sheet Analysis, Insights and Forecast, 2020-2032
- 8.1. Market Analysis, Insights and Forecast - by Application
- 8.1.1. Power Cooling
- 8.1.2. Chip Cooling
- 8.1.3. Others
- 8.2. Market Analysis, Insights and Forecast - by Types
- 8.2.1. Thermal Conductivity 2-5W/m·K
- 8.2.2. Thermal Conductivity 5-8W/m·K
- 8.2.3. Thermal Conductivity 8-12W/m·K
- 8.2.4. Others
- 8.1. Market Analysis, Insights and Forecast - by Application
- 9. Middle East & Africa Electronic and Electrical Thermal Conductive Silicone Sheet Analysis, Insights and Forecast, 2020-2032
- 9.1. Market Analysis, Insights and Forecast - by Application
- 9.1.1. Power Cooling
- 9.1.2. Chip Cooling
- 9.1.3. Others
- 9.2. Market Analysis, Insights and Forecast - by Types
- 9.2.1. Thermal Conductivity 2-5W/m·K
- 9.2.2. Thermal Conductivity 5-8W/m·K
- 9.2.3. Thermal Conductivity 8-12W/m·K
- 9.2.4. Others
- 9.1. Market Analysis, Insights and Forecast - by Application
- 10. Asia Pacific Electronic and Electrical Thermal Conductive Silicone Sheet Analysis, Insights and Forecast, 2020-2032
- 10.1. Market Analysis, Insights and Forecast - by Application
- 10.1.1. Power Cooling
- 10.1.2. Chip Cooling
- 10.1.3. Others
- 10.2. Market Analysis, Insights and Forecast - by Types
- 10.2.1. Thermal Conductivity 2-5W/m·K
- 10.2.2. Thermal Conductivity 5-8W/m·K
- 10.2.3. Thermal Conductivity 8-12W/m·K
- 10.2.4. Others
- 10.1. Market Analysis, Insights and Forecast - by Application
- 11. Competitive Analysis
- 11.1. Global Market Share Analysis 2025
- 11.2. Company Profiles
- 11.2.1 Shin-Etsu Chemical
- 11.2.1.1. Overview
- 11.2.1.2. Products
- 11.2.1.3. SWOT Analysis
- 11.2.1.4. Recent Developments
- 11.2.1.5. Financials (Based on Availability)
- 11.2.2 Sekisui Polymatech
- 11.2.2.1. Overview
- 11.2.2.2. Products
- 11.2.2.3. SWOT Analysis
- 11.2.2.4. Recent Developments
- 11.2.2.5. Financials (Based on Availability)
- 11.2.3 Bando Chemical Industries
- 11.2.3.1. Overview
- 11.2.3.2. Products
- 11.2.3.3. SWOT Analysis
- 11.2.3.4. Recent Developments
- 11.2.3.5. Financials (Based on Availability)
- 11.2.4 3M
- 11.2.4.1. Overview
- 11.2.4.2. Products
- 11.2.4.3. SWOT Analysis
- 11.2.4.4. Recent Developments
- 11.2.4.5. Financials (Based on Availability)
- 11.2.5 Dexerials
- 11.2.5.1. Overview
- 11.2.5.2. Products
- 11.2.5.3. SWOT Analysis
- 11.2.5.4. Recent Developments
- 11.2.5.5. Financials (Based on Availability)
- 11.2.6 Qanta Group
- 11.2.6.1. Overview
- 11.2.6.2. Products
- 11.2.6.3. SWOT Analysis
- 11.2.6.4. Recent Developments
- 11.2.6.5. Financials (Based on Availability)
- 11.2.7 Shenzhen Sancos Electronic Materials
- 11.2.7.1. Overview
- 11.2.7.2. Products
- 11.2.7.3. SWOT Analysis
- 11.2.7.4. Recent Developments
- 11.2.7.5. Financials (Based on Availability)
- 11.2.8 Du Rui New Materials
- 11.2.8.1. Overview
- 11.2.8.2. Products
- 11.2.8.3. SWOT Analysis
- 11.2.8.4. Recent Developments
- 11.2.8.5. Financials (Based on Availability)
- 11.2.1 Shin-Etsu Chemical
List of Figures
- Figure 1: Global Electronic and Electrical Thermal Conductive Silicone Sheet Revenue Breakdown (million, %) by Region 2025 & 2033
- Figure 2: Global Electronic and Electrical Thermal Conductive Silicone Sheet Volume Breakdown (K, %) by Region 2025 & 2033
- Figure 3: North America Electronic and Electrical Thermal Conductive Silicone Sheet Revenue (million), by Application 2025 & 2033
- Figure 4: North America Electronic and Electrical Thermal Conductive Silicone Sheet Volume (K), by Application 2025 & 2033
- Figure 5: North America Electronic and Electrical Thermal Conductive Silicone Sheet Revenue Share (%), by Application 2025 & 2033
- Figure 6: North America Electronic and Electrical Thermal Conductive Silicone Sheet Volume Share (%), by Application 2025 & 2033
- Figure 7: North America Electronic and Electrical Thermal Conductive Silicone Sheet Revenue (million), by Types 2025 & 2033
- Figure 8: North America Electronic and Electrical Thermal Conductive Silicone Sheet Volume (K), by Types 2025 & 2033
- Figure 9: North America Electronic and Electrical Thermal Conductive Silicone Sheet Revenue Share (%), by Types 2025 & 2033
- Figure 10: North America Electronic and Electrical Thermal Conductive Silicone Sheet Volume Share (%), by Types 2025 & 2033
- Figure 11: North America Electronic and Electrical Thermal Conductive Silicone Sheet Revenue (million), by Country 2025 & 2033
- Figure 12: North America Electronic and Electrical Thermal Conductive Silicone Sheet Volume (K), by Country 2025 & 2033
- Figure 13: North America Electronic and Electrical Thermal Conductive Silicone Sheet Revenue Share (%), by Country 2025 & 2033
- Figure 14: North America Electronic and Electrical Thermal Conductive Silicone Sheet Volume Share (%), by Country 2025 & 2033
- Figure 15: South America Electronic and Electrical Thermal Conductive Silicone Sheet Revenue (million), by Application 2025 & 2033
- Figure 16: South America Electronic and Electrical Thermal Conductive Silicone Sheet Volume (K), by Application 2025 & 2033
- Figure 17: South America Electronic and Electrical Thermal Conductive Silicone Sheet Revenue Share (%), by Application 2025 & 2033
- Figure 18: South America Electronic and Electrical Thermal Conductive Silicone Sheet Volume Share (%), by Application 2025 & 2033
- Figure 19: South America Electronic and Electrical Thermal Conductive Silicone Sheet Revenue (million), by Types 2025 & 2033
- Figure 20: South America Electronic and Electrical Thermal Conductive Silicone Sheet Volume (K), by Types 2025 & 2033
- Figure 21: South America Electronic and Electrical Thermal Conductive Silicone Sheet Revenue Share (%), by Types 2025 & 2033
- Figure 22: South America Electronic and Electrical Thermal Conductive Silicone Sheet Volume Share (%), by Types 2025 & 2033
- Figure 23: South America Electronic and Electrical Thermal Conductive Silicone Sheet Revenue (million), by Country 2025 & 2033
- Figure 24: South America Electronic and Electrical Thermal Conductive Silicone Sheet Volume (K), by Country 2025 & 2033
- Figure 25: South America Electronic and Electrical Thermal Conductive Silicone Sheet Revenue Share (%), by Country 2025 & 2033
- Figure 26: South America Electronic and Electrical Thermal Conductive Silicone Sheet Volume Share (%), by Country 2025 & 2033
- Figure 27: Europe Electronic and Electrical Thermal Conductive Silicone Sheet Revenue (million), by Application 2025 & 2033
- Figure 28: Europe Electronic and Electrical Thermal Conductive Silicone Sheet Volume (K), by Application 2025 & 2033
- Figure 29: Europe Electronic and Electrical Thermal Conductive Silicone Sheet Revenue Share (%), by Application 2025 & 2033
- Figure 30: Europe Electronic and Electrical Thermal Conductive Silicone Sheet Volume Share (%), by Application 2025 & 2033
- Figure 31: Europe Electronic and Electrical Thermal Conductive Silicone Sheet Revenue (million), by Types 2025 & 2033
- Figure 32: Europe Electronic and Electrical Thermal Conductive Silicone Sheet Volume (K), by Types 2025 & 2033
- Figure 33: Europe Electronic and Electrical Thermal Conductive Silicone Sheet Revenue Share (%), by Types 2025 & 2033
- Figure 34: Europe Electronic and Electrical Thermal Conductive Silicone Sheet Volume Share (%), by Types 2025 & 2033
- Figure 35: Europe Electronic and Electrical Thermal Conductive Silicone Sheet Revenue (million), by Country 2025 & 2033
- Figure 36: Europe Electronic and Electrical Thermal Conductive Silicone Sheet Volume (K), by Country 2025 & 2033
- Figure 37: Europe Electronic and Electrical Thermal Conductive Silicone Sheet Revenue Share (%), by Country 2025 & 2033
- Figure 38: Europe Electronic and Electrical Thermal Conductive Silicone Sheet Volume Share (%), by Country 2025 & 2033
- Figure 39: Middle East & Africa Electronic and Electrical Thermal Conductive Silicone Sheet Revenue (million), by Application 2025 & 2033
- Figure 40: Middle East & Africa Electronic and Electrical Thermal Conductive Silicone Sheet Volume (K), by Application 2025 & 2033
- Figure 41: Middle East & Africa Electronic and Electrical Thermal Conductive Silicone Sheet Revenue Share (%), by Application 2025 & 2033
- Figure 42: Middle East & Africa Electronic and Electrical Thermal Conductive Silicone Sheet Volume Share (%), by Application 2025 & 2033
- Figure 43: Middle East & Africa Electronic and Electrical Thermal Conductive Silicone Sheet Revenue (million), by Types 2025 & 2033
- Figure 44: Middle East & Africa Electronic and Electrical Thermal Conductive Silicone Sheet Volume (K), by Types 2025 & 2033
- Figure 45: Middle East & Africa Electronic and Electrical Thermal Conductive Silicone Sheet Revenue Share (%), by Types 2025 & 2033
- Figure 46: Middle East & Africa Electronic and Electrical Thermal Conductive Silicone Sheet Volume Share (%), by Types 2025 & 2033
- Figure 47: Middle East & Africa Electronic and Electrical Thermal Conductive Silicone Sheet Revenue (million), by Country 2025 & 2033
- Figure 48: Middle East & Africa Electronic and Electrical Thermal Conductive Silicone Sheet Volume (K), by Country 2025 & 2033
- Figure 49: Middle East & Africa Electronic and Electrical Thermal Conductive Silicone Sheet Revenue Share (%), by Country 2025 & 2033
- Figure 50: Middle East & Africa Electronic and Electrical Thermal Conductive Silicone Sheet Volume Share (%), by Country 2025 & 2033
- Figure 51: Asia Pacific Electronic and Electrical Thermal Conductive Silicone Sheet Revenue (million), by Application 2025 & 2033
- Figure 52: Asia Pacific Electronic and Electrical Thermal Conductive Silicone Sheet Volume (K), by Application 2025 & 2033
- Figure 53: Asia Pacific Electronic and Electrical Thermal Conductive Silicone Sheet Revenue Share (%), by Application 2025 & 2033
- Figure 54: Asia Pacific Electronic and Electrical Thermal Conductive Silicone Sheet Volume Share (%), by Application 2025 & 2033
- Figure 55: Asia Pacific Electronic and Electrical Thermal Conductive Silicone Sheet Revenue (million), by Types 2025 & 2033
- Figure 56: Asia Pacific Electronic and Electrical Thermal Conductive Silicone Sheet Volume (K), by Types 2025 & 2033
- Figure 57: Asia Pacific Electronic and Electrical Thermal Conductive Silicone Sheet Revenue Share (%), by Types 2025 & 2033
- Figure 58: Asia Pacific Electronic and Electrical Thermal Conductive Silicone Sheet Volume Share (%), by Types 2025 & 2033
- Figure 59: Asia Pacific Electronic and Electrical Thermal Conductive Silicone Sheet Revenue (million), by Country 2025 & 2033
- Figure 60: Asia Pacific Electronic and Electrical Thermal Conductive Silicone Sheet Volume (K), by Country 2025 & 2033
- Figure 61: Asia Pacific Electronic and Electrical Thermal Conductive Silicone Sheet Revenue Share (%), by Country 2025 & 2033
- Figure 62: Asia Pacific Electronic and Electrical Thermal Conductive Silicone Sheet Volume Share (%), by Country 2025 & 2033
List of Tables
- Table 1: Global Electronic and Electrical Thermal Conductive Silicone Sheet Revenue million Forecast, by Application 2020 & 2033
- Table 2: Global Electronic and Electrical Thermal Conductive Silicone Sheet Volume K Forecast, by Application 2020 & 2033
- Table 3: Global Electronic and Electrical Thermal Conductive Silicone Sheet Revenue million Forecast, by Types 2020 & 2033
- Table 4: Global Electronic and Electrical Thermal Conductive Silicone Sheet Volume K Forecast, by Types 2020 & 2033
- Table 5: Global Electronic and Electrical Thermal Conductive Silicone Sheet Revenue million Forecast, by Region 2020 & 2033
- Table 6: Global Electronic and Electrical Thermal Conductive Silicone Sheet Volume K Forecast, by Region 2020 & 2033
- Table 7: Global Electronic and Electrical Thermal Conductive Silicone Sheet Revenue million Forecast, by Application 2020 & 2033
- Table 8: Global Electronic and Electrical Thermal Conductive Silicone Sheet Volume K Forecast, by Application 2020 & 2033
- Table 9: Global Electronic and Electrical Thermal Conductive Silicone Sheet Revenue million Forecast, by Types 2020 & 2033
- Table 10: Global Electronic and Electrical Thermal Conductive Silicone Sheet Volume K Forecast, by Types 2020 & 2033
- Table 11: Global Electronic and Electrical Thermal Conductive Silicone Sheet Revenue million Forecast, by Country 2020 & 2033
- Table 12: Global Electronic and Electrical Thermal Conductive Silicone Sheet Volume K Forecast, by Country 2020 & 2033
- Table 13: United States Electronic and Electrical Thermal Conductive Silicone Sheet Revenue (million) Forecast, by Application 2020 & 2033
- Table 14: United States Electronic and Electrical Thermal Conductive Silicone Sheet Volume (K) Forecast, by Application 2020 & 2033
- Table 15: Canada Electronic and Electrical Thermal Conductive Silicone Sheet Revenue (million) Forecast, by Application 2020 & 2033
- Table 16: Canada Electronic and Electrical Thermal Conductive Silicone Sheet Volume (K) Forecast, by Application 2020 & 2033
- Table 17: Mexico Electronic and Electrical Thermal Conductive Silicone Sheet Revenue (million) Forecast, by Application 2020 & 2033
- Table 18: Mexico Electronic and Electrical Thermal Conductive Silicone Sheet Volume (K) Forecast, by Application 2020 & 2033
- Table 19: Global Electronic and Electrical Thermal Conductive Silicone Sheet Revenue million Forecast, by Application 2020 & 2033
- Table 20: Global Electronic and Electrical Thermal Conductive Silicone Sheet Volume K Forecast, by Application 2020 & 2033
- Table 21: Global Electronic and Electrical Thermal Conductive Silicone Sheet Revenue million Forecast, by Types 2020 & 2033
- Table 22: Global Electronic and Electrical Thermal Conductive Silicone Sheet Volume K Forecast, by Types 2020 & 2033
- Table 23: Global Electronic and Electrical Thermal Conductive Silicone Sheet Revenue million Forecast, by Country 2020 & 2033
- Table 24: Global Electronic and Electrical Thermal Conductive Silicone Sheet Volume K Forecast, by Country 2020 & 2033
- Table 25: Brazil Electronic and Electrical Thermal Conductive Silicone Sheet Revenue (million) Forecast, by Application 2020 & 2033
- Table 26: Brazil Electronic and Electrical Thermal Conductive Silicone Sheet Volume (K) Forecast, by Application 2020 & 2033
- Table 27: Argentina Electronic and Electrical Thermal Conductive Silicone Sheet Revenue (million) Forecast, by Application 2020 & 2033
- Table 28: Argentina Electronic and Electrical Thermal Conductive Silicone Sheet Volume (K) Forecast, by Application 2020 & 2033
- Table 29: Rest of South America Electronic and Electrical Thermal Conductive Silicone Sheet Revenue (million) Forecast, by Application 2020 & 2033
- Table 30: Rest of South America Electronic and Electrical Thermal Conductive Silicone Sheet Volume (K) Forecast, by Application 2020 & 2033
- Table 31: Global Electronic and Electrical Thermal Conductive Silicone Sheet Revenue million Forecast, by Application 2020 & 2033
- Table 32: Global Electronic and Electrical Thermal Conductive Silicone Sheet Volume K Forecast, by Application 2020 & 2033
- Table 33: Global Electronic and Electrical Thermal Conductive Silicone Sheet Revenue million Forecast, by Types 2020 & 2033
- Table 34: Global Electronic and Electrical Thermal Conductive Silicone Sheet Volume K Forecast, by Types 2020 & 2033
- Table 35: Global Electronic and Electrical Thermal Conductive Silicone Sheet Revenue million Forecast, by Country 2020 & 2033
- Table 36: Global Electronic and Electrical Thermal Conductive Silicone Sheet Volume K Forecast, by Country 2020 & 2033
- Table 37: United Kingdom Electronic and Electrical Thermal Conductive Silicone Sheet Revenue (million) Forecast, by Application 2020 & 2033
- Table 38: United Kingdom Electronic and Electrical Thermal Conductive Silicone Sheet Volume (K) Forecast, by Application 2020 & 2033
- Table 39: Germany Electronic and Electrical Thermal Conductive Silicone Sheet Revenue (million) Forecast, by Application 2020 & 2033
- Table 40: Germany Electronic and Electrical Thermal Conductive Silicone Sheet Volume (K) Forecast, by Application 2020 & 2033
- Table 41: France Electronic and Electrical Thermal Conductive Silicone Sheet Revenue (million) Forecast, by Application 2020 & 2033
- Table 42: France Electronic and Electrical Thermal Conductive Silicone Sheet Volume (K) Forecast, by Application 2020 & 2033
- Table 43: Italy Electronic and Electrical Thermal Conductive Silicone Sheet Revenue (million) Forecast, by Application 2020 & 2033
- Table 44: Italy Electronic and Electrical Thermal Conductive Silicone Sheet Volume (K) Forecast, by Application 2020 & 2033
- Table 45: Spain Electronic and Electrical Thermal Conductive Silicone Sheet Revenue (million) Forecast, by Application 2020 & 2033
- Table 46: Spain Electronic and Electrical Thermal Conductive Silicone Sheet Volume (K) Forecast, by Application 2020 & 2033
- Table 47: Russia Electronic and Electrical Thermal Conductive Silicone Sheet Revenue (million) Forecast, by Application 2020 & 2033
- Table 48: Russia Electronic and Electrical Thermal Conductive Silicone Sheet Volume (K) Forecast, by Application 2020 & 2033
- Table 49: Benelux Electronic and Electrical Thermal Conductive Silicone Sheet Revenue (million) Forecast, by Application 2020 & 2033
- Table 50: Benelux Electronic and Electrical Thermal Conductive Silicone Sheet Volume (K) Forecast, by Application 2020 & 2033
- Table 51: Nordics Electronic and Electrical Thermal Conductive Silicone Sheet Revenue (million) Forecast, by Application 2020 & 2033
- Table 52: Nordics Electronic and Electrical Thermal Conductive Silicone Sheet Volume (K) Forecast, by Application 2020 & 2033
- Table 53: Rest of Europe Electronic and Electrical Thermal Conductive Silicone Sheet Revenue (million) Forecast, by Application 2020 & 2033
- Table 54: Rest of Europe Electronic and Electrical Thermal Conductive Silicone Sheet Volume (K) Forecast, by Application 2020 & 2033
- Table 55: Global Electronic and Electrical Thermal Conductive Silicone Sheet Revenue million Forecast, by Application 2020 & 2033
- Table 56: Global Electronic and Electrical Thermal Conductive Silicone Sheet Volume K Forecast, by Application 2020 & 2033
- Table 57: Global Electronic and Electrical Thermal Conductive Silicone Sheet Revenue million Forecast, by Types 2020 & 2033
- Table 58: Global Electronic and Electrical Thermal Conductive Silicone Sheet Volume K Forecast, by Types 2020 & 2033
- Table 59: Global Electronic and Electrical Thermal Conductive Silicone Sheet Revenue million Forecast, by Country 2020 & 2033
- Table 60: Global Electronic and Electrical Thermal Conductive Silicone Sheet Volume K Forecast, by Country 2020 & 2033
- Table 61: Turkey Electronic and Electrical Thermal Conductive Silicone Sheet Revenue (million) Forecast, by Application 2020 & 2033
- Table 62: Turkey Electronic and Electrical Thermal Conductive Silicone Sheet Volume (K) Forecast, by Application 2020 & 2033
- Table 63: Israel Electronic and Electrical Thermal Conductive Silicone Sheet Revenue (million) Forecast, by Application 2020 & 2033
- Table 64: Israel Electronic and Electrical Thermal Conductive Silicone Sheet Volume (K) Forecast, by Application 2020 & 2033
- Table 65: GCC Electronic and Electrical Thermal Conductive Silicone Sheet Revenue (million) Forecast, by Application 2020 & 2033
- Table 66: GCC Electronic and Electrical Thermal Conductive Silicone Sheet Volume (K) Forecast, by Application 2020 & 2033
- Table 67: North Africa Electronic and Electrical Thermal Conductive Silicone Sheet Revenue (million) Forecast, by Application 2020 & 2033
- Table 68: North Africa Electronic and Electrical Thermal Conductive Silicone Sheet Volume (K) Forecast, by Application 2020 & 2033
- Table 69: South Africa Electronic and Electrical Thermal Conductive Silicone Sheet Revenue (million) Forecast, by Application 2020 & 2033
- Table 70: South Africa Electronic and Electrical Thermal Conductive Silicone Sheet Volume (K) Forecast, by Application 2020 & 2033
- Table 71: Rest of Middle East & Africa Electronic and Electrical Thermal Conductive Silicone Sheet Revenue (million) Forecast, by Application 2020 & 2033
- Table 72: Rest of Middle East & Africa Electronic and Electrical Thermal Conductive Silicone Sheet Volume (K) Forecast, by Application 2020 & 2033
- Table 73: Global Electronic and Electrical Thermal Conductive Silicone Sheet Revenue million Forecast, by Application 2020 & 2033
- Table 74: Global Electronic and Electrical Thermal Conductive Silicone Sheet Volume K Forecast, by Application 2020 & 2033
- Table 75: Global Electronic and Electrical Thermal Conductive Silicone Sheet Revenue million Forecast, by Types 2020 & 2033
- Table 76: Global Electronic and Electrical Thermal Conductive Silicone Sheet Volume K Forecast, by Types 2020 & 2033
- Table 77: Global Electronic and Electrical Thermal Conductive Silicone Sheet Revenue million Forecast, by Country 2020 & 2033
- Table 78: Global Electronic and Electrical Thermal Conductive Silicone Sheet Volume K Forecast, by Country 2020 & 2033
- Table 79: China Electronic and Electrical Thermal Conductive Silicone Sheet Revenue (million) Forecast, by Application 2020 & 2033
- Table 80: China Electronic and Electrical Thermal Conductive Silicone Sheet Volume (K) Forecast, by Application 2020 & 2033
- Table 81: India Electronic and Electrical Thermal Conductive Silicone Sheet Revenue (million) Forecast, by Application 2020 & 2033
- Table 82: India Electronic and Electrical Thermal Conductive Silicone Sheet Volume (K) Forecast, by Application 2020 & 2033
- Table 83: Japan Electronic and Electrical Thermal Conductive Silicone Sheet Revenue (million) Forecast, by Application 2020 & 2033
- Table 84: Japan Electronic and Electrical Thermal Conductive Silicone Sheet Volume (K) Forecast, by Application 2020 & 2033
- Table 85: South Korea Electronic and Electrical Thermal Conductive Silicone Sheet Revenue (million) Forecast, by Application 2020 & 2033
- Table 86: South Korea Electronic and Electrical Thermal Conductive Silicone Sheet Volume (K) Forecast, by Application 2020 & 2033
- Table 87: ASEAN Electronic and Electrical Thermal Conductive Silicone Sheet Revenue (million) Forecast, by Application 2020 & 2033
- Table 88: ASEAN Electronic and Electrical Thermal Conductive Silicone Sheet Volume (K) Forecast, by Application 2020 & 2033
- Table 89: Oceania Electronic and Electrical Thermal Conductive Silicone Sheet Revenue (million) Forecast, by Application 2020 & 2033
- Table 90: Oceania Electronic and Electrical Thermal Conductive Silicone Sheet Volume (K) Forecast, by Application 2020 & 2033
- Table 91: Rest of Asia Pacific Electronic and Electrical Thermal Conductive Silicone Sheet Revenue (million) Forecast, by Application 2020 & 2033
- Table 92: Rest of Asia Pacific Electronic and Electrical Thermal Conductive Silicone Sheet Volume (K) Forecast, by Application 2020 & 2033
Frequently Asked Questions
1. What is the projected Compound Annual Growth Rate (CAGR) of the Electronic and Electrical Thermal Conductive Silicone Sheet?
The projected CAGR is approximately 7%.
2. Which companies are prominent players in the Electronic and Electrical Thermal Conductive Silicone Sheet?
Key companies in the market include Shin-Etsu Chemical, Sekisui Polymatech, Bando Chemical Industries, 3M, Dexerials, Qanta Group, Shenzhen Sancos Electronic Materials, Du Rui New Materials.
3. What are the main segments of the Electronic and Electrical Thermal Conductive Silicone Sheet?
The market segments include Application, Types.
4. Can you provide details about the market size?
The market size is estimated to be USD 11210 million as of 2022.
5. What are some drivers contributing to market growth?
N/A
6. What are the notable trends driving market growth?
N/A
7. Are there any restraints impacting market growth?
N/A
8. Can you provide examples of recent developments in the market?
N/A
9. What pricing options are available for accessing the report?
Pricing options include single-user, multi-user, and enterprise licenses priced at USD 4350.00, USD 6525.00, and USD 8700.00 respectively.
10. Is the market size provided in terms of value or volume?
The market size is provided in terms of value, measured in million and volume, measured in K.
11. Are there any specific market keywords associated with the report?
Yes, the market keyword associated with the report is "Electronic and Electrical Thermal Conductive Silicone Sheet," which aids in identifying and referencing the specific market segment covered.
12. How do I determine which pricing option suits my needs best?
The pricing options vary based on user requirements and access needs. Individual users may opt for single-user licenses, while businesses requiring broader access may choose multi-user or enterprise licenses for cost-effective access to the report.
13. Are there any additional resources or data provided in the Electronic and Electrical Thermal Conductive Silicone Sheet report?
While the report offers comprehensive insights, it's advisable to review the specific contents or supplementary materials provided to ascertain if additional resources or data are available.
14. How can I stay updated on further developments or reports in the Electronic and Electrical Thermal Conductive Silicone Sheet?
To stay informed about further developments, trends, and reports in the Electronic and Electrical Thermal Conductive Silicone Sheet, consider subscribing to industry newsletters, following relevant companies and organizations, or regularly checking reputable industry news sources and publications.
Methodology
Step 1 - Identification of Relevant Samples Size from Population Database


Step 2 - Approaches for Defining Global Market Size (Value, Volume* & Price*)

Note*: In applicable scenarios
Step 3 - Data Sources
Primary Research
- Web Analytics
- Survey Reports
- Research Institute
- Latest Research Reports
- Opinion Leaders
Secondary Research
- Annual Reports
- White Paper
- Latest Press Release
- Industry Association
- Paid Database
- Investor Presentations

Step 4 - Data Triangulation
Involves using different sources of information in order to increase the validity of a study
These sources are likely to be stakeholders in a program - participants, other researchers, program staff, other community members, and so on.
Then we put all data in single framework & apply various statistical tools to find out the dynamic on the market.
During the analysis stage, feedback from the stakeholder groups would be compared to determine areas of agreement as well as areas of divergence