

Key Insights
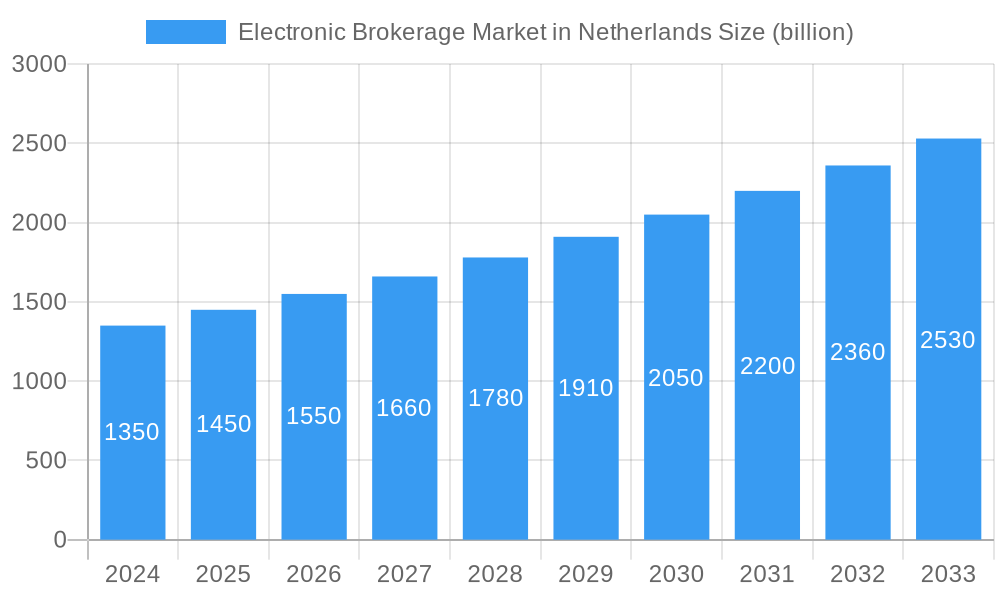
The Electronic Brokerage Market in the Netherlands is poised for significant expansion, driven by increasing digital adoption and a growing appetite for investment opportunities among both retail and institutional investors. With a projected market size of approximately $1.35 billion in 2024 and an estimated Compound Annual Growth Rate (CAGR) of 7.3% from 2025 to 2033, the market is on a robust growth trajectory. This expansion is underpinned by the increasing accessibility of trading platforms, enhanced user experiences, and a surge in financial literacy, encouraging more individuals to participate in the stock market. The proliferation of user-friendly mobile trading applications, coupled with the availability of educational resources, further democratizes investment, making it easier for a broader demographic to engage with electronic brokerage services.
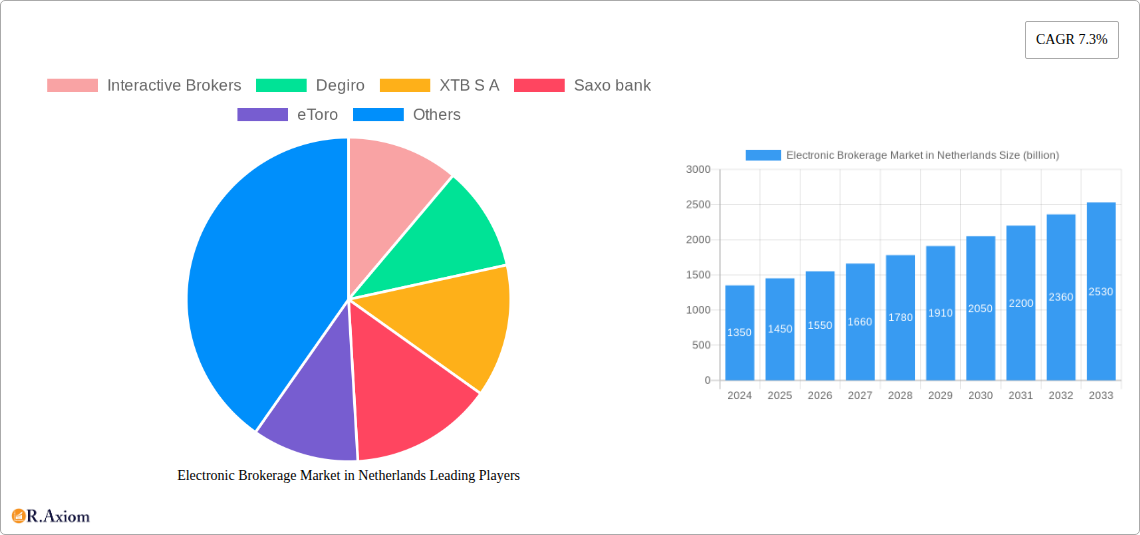
Electronic Brokerage Market in Netherlands Market Size (In Billion)
The market's dynamism is further shaped by evolving investor preferences and technological advancements. While traditional full-time brokers continue to offer comprehensive services, the rise of discount brokers and the integration of advanced trading tools, including sophisticated analytics and algorithmic trading capabilities, are reshaping the competitive landscape. The Netherlands, with its strong technological infrastructure and an investment-savvy population, is a prime market for these innovations. Key growth drivers include the increasing adoption of online trading platforms, a preference for lower commission fees, and the demand for diverse investment products. However, challenges such as regulatory complexities and the need for enhanced cybersecurity measures remain critical considerations for market participants and investors alike. The market is expected to witness continued innovation in product offerings and service delivery to cater to the evolving needs of its expanding user base.
Electronic Brokerage Market in Netherlands Company Market Share
This detailed report offers an in-depth analysis of the Electronic Brokerage Market in the Netherlands, encompassing a study period from 2019 to 2033, with a base and estimated year of 2025. Delving into historical trends from 2019-2024 and projecting future growth through 2025-2033, this report provides critical insights for industry stakeholders. We analyze market concentration, innovation drivers, regulatory frameworks, product substitutes, end-user trends, and M&A activities. The report explores key industry trends, technological disruptions, consumer preferences, and competitive dynamics, highlighting dominant markets and segments across investor types, services, and operational scopes. Crucially, it examines product developments, growth drivers, challenges, emerging opportunities, and the strategies of leading players. This comprehensive report is designed to empower investors, financial institutions, technology providers, and regulatory bodies with actionable intelligence for strategic decision-making in the dynamic Dutch electronic brokerage landscape. The estimated market size is projected to reach several hundred billion dollars by 2033, with a Compound Annual Growth Rate (CAGR) of approximately 12-15%.
Electronic Brokerage Market in Netherlands Market Concentration & Innovation
The Electronic Brokerage Market in the Netherlands exhibits a moderate to high level of concentration, with a few prominent players holding significant market share, such as Interactive Brokers and Degiro. Innovation is a key differentiator, driven by advancements in user interface design, algorithmic trading tools, and the integration of AI-powered advisory services. Regulatory frameworks, including those set by the Dutch Authority for the Financial Markets (AFM) and De Nederlandsche Bank (DNB), play a crucial role in shaping market practices and ensuring investor protection, influencing innovation by setting compliance standards. Product substitutes, such as traditional financial advisors and direct investment platforms, exert competitive pressure, pushing electronic brokers to enhance their offerings in terms of cost-effectiveness and accessibility. End-user trends lean towards digital-first solutions, demanding intuitive platforms and a wide range of tradable assets. Mergers and acquisitions (M&A) are a significant factor in market consolidation and expansion. For instance, the acquisition of DEGIRO by flatex in 2020, valued at EUR 23.6 million for an initial stake and a further EUR 36.4 million for the remaining shares, demonstrates a substantial M&A activity aimed at capturing a larger market share and synergistic benefits.
- Market Concentration: Dominated by a few key players, with significant market share held by established platforms.
- Innovation Drivers: User experience, AI integration, cost reduction, and expanded product offerings (e.g., cryptocurrencies, ETFs).
- Regulatory Frameworks: Strict adherence to AFM and DNB regulations, ensuring market integrity and investor safety.
- Product Substitutes: Traditional advisory services and alternative investment platforms.
- End-User Trends: Demand for mobile accessibility, low fees, diverse asset classes, and educational resources.
- M&A Activities: Strategic acquisitions to gain market share and enhance service portfolios, exemplified by the flatex-DEGIRO transaction.
Electronic Brokerage Market in Netherlands Industry Trends & Insights
The electronic brokerage market in the Netherlands is experiencing robust growth, propelled by several interconnected trends and insights. A primary growth driver is the increasing adoption of digital investment platforms by a broadening spectrum of the population, particularly younger demographics who are more comfortable with online transactions and mobile-first experiences. Technological disruptions are continuously reshaping the industry, with advancements in AI, machine learning, and blockchain technology offering new avenues for enhanced trading analytics, personalized investment advice, and secure transaction processing. For instance, the rise of robo-advisors has democratized access to sophisticated portfolio management, catering to investors with varying risk appetites and capital levels. Consumer preferences are rapidly evolving, with a strong emphasis on low-cost trading, user-friendly interfaces, and access to a diverse range of financial products, including stocks, bonds, ETFs, cryptocurrencies, and derivatives. The demand for fractional shares and commission-free trading models has become a significant competitive factor, pushing traditional brokers to adapt their fee structures and service models. Competitive dynamics are intensifying, with both established European players and emerging fintech companies vying for market dominance. This competitive pressure fuels innovation and leads to continuous improvements in platform features and customer service. The market penetration of electronic brokerage services is steadily increasing, indicating a significant shift from traditional banking and investment channels. The Dutch market, with its technologically savvy population and favorable regulatory environment, is poised for continued expansion. The CAGR of this market is projected to remain strong, estimated between 12-15% over the forecast period, driven by ongoing digitalization trends and a growing interest in wealth creation among Dutch citizens. The accessibility and affordability offered by electronic brokers are key to this sustained growth.
Dominant Markets & Segments in Electronic Brokerage Market in Netherlands
Within the electronic brokerage market in the Netherlands, several segments demonstrate significant dominance and growth potential. The Retail Investor segment is by far the largest and fastest-growing, fueled by increased financial literacy, a desire for self-directed investing, and the accessibility of user-friendly online platforms. Dutch retail investors are increasingly seeking cost-effective ways to grow their wealth, making discount brokers highly popular.
- Investor Type: Retail
- Key Drivers: Growing financial awareness, demand for accessible investment tools, lower entry barriers, and the influence of digital-native generations.
- Dominance Analysis: Retail investors constitute the majority of active users on electronic brokerage platforms, driving trading volumes and product demand. Platforms offering intuitive interfaces, educational resources, and low fees are particularly attractive to this demographic. The preference for trading stocks, ETFs, and increasingly, cryptocurrencies, underscores their dominance.
The Institutional Investor segment, while smaller in terms of the number of accounts, represents a substantial portion of the overall market value due to the high volume of trades and capital deployed. These investors require advanced trading tools, robust data analytics, and institutional-grade execution capabilities.
- Investor Type: Institutional
- Key Drivers: Need for sophisticated trading infrastructure, regulatory compliance tools, algorithmic trading capabilities, and efficient execution for large portfolios.
- Dominance Analysis: Institutional investors, including asset managers and hedge funds, rely on electronic brokers for efficient portfolio management and execution. While they may not drive the sheer volume of individual accounts, their capital deployment significantly impacts overall market size and revenue. Access to real-time market data and institutional research is critical.
In terms of Services Provided, Discount Brokers are currently dominating the Dutch market due to their cost-competitive fee structures and focus on providing core trading functionalities without extensive advisory services. However, Full Time Brokers are evolving, integrating more digital tools to cater to a hybrid client base.
Services Provided: Discount Brokers
- Key Drivers: Low commission fees, accessibility, self-service model, and a wide range of tradable instruments.
- Dominance Analysis: The popularity of discount brokers like Degiro has reshaped the competitive landscape, forcing other players to reduce fees. This segment caters to a broad range of investors seeking cost-effectiveness above all else.
Services Provided: Full Time Brokers
- Key Drivers: Comprehensive service offerings, including research, advisory, and dedicated client support, alongside advanced trading platforms.
- Dominance Analysis: While discount brokers lead in volume, full-time brokers still hold a strong position, particularly for more complex investment needs and for clients who value personalized guidance. The trend is towards hybrid models that blend digital efficiency with human expertise.
Regarding Operation, the International operational scope of electronic brokerage firms plays a crucial role in their dominance, allowing them to access a wider client base and offer a broader array of global financial products.
- Operation: International
- Key Drivers: Access to global markets, diverse product offerings, ability to attract cross-border clients, and economies of scale.
- Dominance Analysis: International operations enable Dutch electronic brokers to compete effectively on a global stage, offering clients access to markets beyond the Netherlands. This expands their product portfolio and client acquisition potential, driving significant market growth.
Electronic Brokerage Market in Netherlands Product Developments
The Dutch electronic brokerage market is characterized by continuous product innovation, driven by technological advancements and evolving investor demands. Key developments include the integration of AI-powered trading tools, offering predictive analytics and personalized investment recommendations. Enhanced user interfaces and mobile applications prioritize intuitive navigation and seamless trading experiences. The expansion of asset classes, with a growing focus on cryptocurrencies, ETFs, and sustainable investment options (ESG), is a significant trend. Furthermore, the introduction of fractional share trading and commission-free models has made investing more accessible to a wider audience, fostering greater market participation. These product developments are crucial for maintaining a competitive edge and attracting new investors.
Report Scope & Segmentation Analysis
This report provides a comprehensive analysis of the Electronic Brokerage Market in the Netherlands, segmented by Investor Type, Services Provided, and Operation.
- Investor Type: The market is segmented into Retail and Institutional investors. The retail segment is anticipated to continue its robust growth, driven by increasing digital adoption and a desire for accessible investment solutions. The institutional segment, while smaller in account numbers, represents significant trading volumes and capital.
- Services Provided: The segmentation includes Full Time Brokers and Discount Brokers. Discount brokers are expected to maintain their popularity due to cost-effectiveness, while full-time brokers are increasingly integrating digital tools to offer hybrid services, catering to a wider range of investor needs and projected to experience steady growth.
- Operation: The market is analyzed based on Domestic and International operations. The international scope of operations is a significant driver for growth, enabling firms to reach a broader client base and offer a more diverse product range, with international operations projected to contribute more significantly to market expansion.
Key Drivers of Electronic Brokerage Market in Netherlands Growth
Several key factors are propelling the growth of the Electronic Brokerage Market in the Netherlands. The increasing digitalization of financial services and the widespread adoption of smartphones and high-speed internet have made online trading more accessible and convenient. A growing interest in personal finance management and wealth creation among Dutch citizens, particularly younger demographics, is a significant driver. Favorable economic conditions, including a stable economic environment and low interest rates on traditional savings accounts, encourage investment in the stock market. Furthermore, regulatory bodies are generally supportive of innovation in financial technology, creating a conducive environment for the growth of electronic brokerage platforms. The expanding array of available investment products, from traditional stocks and bonds to alternative assets like cryptocurrencies and ETFs, also attracts a diverse investor base.
- Digitalization and Accessibility: Widespread internet access and smartphone penetration facilitate easy access to trading platforms.
- Investor Demographics and Financial Literacy: A younger, tech-savvy population increasingly engaged in self-directed investing.
- Economic Environment: Low-interest rates on savings push individuals towards higher-yield investment opportunities.
- Regulatory Support: A generally favorable regulatory landscape encourages FinTech innovation.
- Product Diversification: A wide range of investable assets caters to varied risk appetites.
Challenges in the Electronic Brokerage Market in Netherlands Sector
Despite its strong growth trajectory, the electronic brokerage market in the Netherlands faces several challenges. Intense competition among numerous platforms can lead to price wars, potentially impacting profit margins for smaller players. The evolving regulatory landscape, while generally supportive, can also impose complex compliance requirements and introduce new costs for businesses. Cybersecurity threats remain a significant concern, requiring substantial investment in robust security infrastructure to protect client data and assets from breaches. Furthermore, maintaining customer trust and engagement in a highly digital environment, where personal interaction is limited, presents an ongoing challenge. The potential for market volatility and economic downturns can also deter retail investors, leading to reduced trading volumes.
- Intense Competition: High number of players leads to price pressures and difficulty in differentiation.
- Evolving Regulatory Compliance: Keeping pace with new regulations and ensuring adherence requires ongoing investment.
- Cybersecurity Threats: Protecting sensitive client data and financial assets from sophisticated cyberattacks.
- Customer Trust and Engagement: Building and maintaining loyalty in a digital-first, often impersonal environment.
- Market Volatility and Investor Sentiment: Economic downturns can lead to reduced trading activity and investor caution.
Emerging Opportunities in Electronic Brokerage Market in Netherlands
The electronic brokerage market in the Netherlands presents numerous emerging opportunities for growth and innovation. The increasing demand for sustainable and ESG (Environmental, Social, and Governance) investing offers a significant avenue for differentiation. The development and integration of advanced AI and machine learning capabilities for personalized financial advice and automated trading strategies present substantial potential. Expanding the offerings to include alternative investments, such as private equity and real estate crowdfunding platforms, can attract a broader investor base. Furthermore, partnerships with other FinTech companies and traditional financial institutions can create synergistic opportunities and expand service reach. The ongoing digital transformation of financial services continues to create a fertile ground for new business models and innovative product development.
- Sustainable and ESG Investing: Growing investor interest in ethically aligned investment options.
- AI and Machine Learning Integration: Enhancing personalized advice, predictive analytics, and automated trading.
- Alternative Investment Platforms: Expanding into areas like private equity and real estate crowdfunding.
- FinTech Partnerships: Collaborations to leverage complementary services and technologies.
- Digital Wealth Management: Further integration of digital tools for comprehensive financial planning.
Leading Players in the Electronic Brokerage Market in Netherlands Market
- Interactive Brokers
- Degiro
- XTB S A
- Saxo Bank
- eToro
- Euronext Group
- LYNX
- IC Markets
- RoboForex
- FP Markets
Key Developments in Electronic Brokerage Market in Netherlands Industry
- September 2022: Scalable Capital, a leading European digital investment platform, expanded its presence in the Netherlands, offering cost-effective trading and saving plans for Dutch retail clients through its subsidiaries Scalable Crypto and Scalable Broker. Products include ETFs, stocks, cryptocurrencies, and mutual funds.
- 2020: Flatex acquired 9.4% of DEGIRO for EUR 23.6 million in cash, with the subsequent acquisition of the remaining 90.6% subject to regulatory approval. De Nederlandsche Bank (DNB) granted approval, allowing flatex to proceed with the purchase of DEGIRO B.V. This acquisition was financed through a capital increase against contribution in kind, involving the issuance of up to 7.5 million new flatex shares to current DEGIRO shareholders and an additional cash payment of EUR 36.4 million.
Strategic Outlook for Electronic Brokerage Market in Netherlands Market
The strategic outlook for the electronic brokerage market in the Netherlands is overwhelmingly positive, driven by sustained technological innovation and an expanding investor base. Key growth catalysts include the continued digitalization of financial services, leading to increased adoption of mobile-first platforms and user-friendly interfaces. The growing demand for personalized investment solutions, powered by AI and data analytics, will be crucial for competitive differentiation. Furthermore, the increasing focus on sustainable investing (ESG) presents a significant opportunity for firms to attract environmentally and socially conscious investors. Strategic partnerships and potential mergers will likely continue as companies seek to consolidate market share, expand their service offerings, and achieve economies of scale. The Dutch market's inherent technological infrastructure and receptive consumer base position it for continued robust growth, making it an attractive environment for both established players and emerging FinTech innovators aiming to capture a share of the projected several hundred billion dollar market value.
Electronic Brokerage Market in Netherlands Segmentation
-
1. Investor Type
- 1.1. Retail
- 1.2. Institutional
-
2. Services Provided
- 2.1. Full Time Brokers
- 2.2. Discount Brokers
-
3. Operation
- 3.1. Domestic
- 3.2. International
Electronic Brokerage Market in Netherlands Segmentation By Geography
-
1. North America
- 1.1. United States
- 1.2. Canada
- 1.3. Mexico
-
2. South America
- 2.1. Brazil
- 2.2. Argentina
- 2.3. Rest of South America
-
3. Europe
- 3.1. United Kingdom
- 3.2. Germany
- 3.3. France
- 3.4. Italy
- 3.5. Spain
- 3.6. Russia
- 3.7. Benelux
- 3.8. Nordics
- 3.9. Rest of Europe
-
4. Middle East & Africa
- 4.1. Turkey
- 4.2. Israel
- 4.3. GCC
- 4.4. North Africa
- 4.5. South Africa
- 4.6. Rest of Middle East & Africa
-
5. Asia Pacific
- 5.1. China
- 5.2. India
- 5.3. Japan
- 5.4. South Korea
- 5.5. ASEAN
- 5.6. Oceania
- 5.7. Rest of Asia Pacific
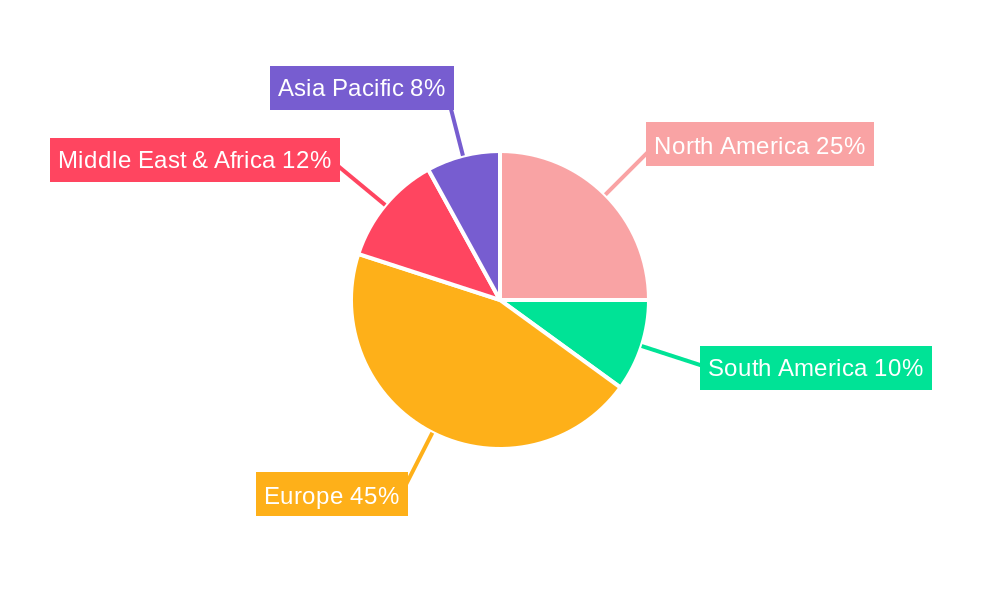
Electronic Brokerage Market in Netherlands Regional Market Share
Geographic Coverage of Electronic Brokerage Market in Netherlands
Electronic Brokerage Market in Netherlands REPORT HIGHLIGHTS
| Aspects | Details |
|---|---|
| Study Period | 2020-2034 |
| Base Year | 2025 |
| Estimated Year | 2026 |
| Forecast Period | 2026-2034 |
| Historical Period | 2020-2025 |
| Growth Rate | CAGR of 7.3% from 2020-2034 |
| Segmentation |
|
Table of Contents
- 1. Introduction
- 1.1. Research Scope
- 1.2. Market Segmentation
- 1.3. Research Objective
- 1.4. Definitions and Assumptions
- 2. Executive Summary
- 2.1. Market Snapshot
- 3. Market Dynamics
- 3.1. Market Drivers
- 3.2. Market Restrains
- 3.3. Market Trends
- 3.4. Market Opportunities
- 4. Market Factor Analysis
- 4.1. Porters Five Forces
- 4.1.1. Bargaining Power of Suppliers
- 4.1.2. Bargaining Power of Buyers
- 4.1.3. Threat of New Entrants
- 4.1.4. Threat of Substitutes
- 4.1.5. Competitive Rivalry
- 4.2. PESTEL analysis
- 4.3. BCG Analysis
- 4.3.1. Stars (High Growth, High Market Share)
- 4.3.2. Cash Cows (Low Growth, High Market Share)
- 4.3.3. Question Mark (High Growth, Low Market Share)
- 4.3.4. Dogs (Low Growth, Low Market Share)
- 4.4. Ansoff Matrix Analysis
- 4.5. Supply Chain Analysis
- 4.6. Regulatory Landscape
- 4.7. Current Market Potential and Opportunity Assessment (TAM–SAM–SOM Framework)
- 4.8. RAX Analyst Note
- 4.1. Porters Five Forces
- 5. Market Analysis, Insights and Forecast 2021-2033
- 5.1. Market Analysis, Insights and Forecast - by Investor Type
- 5.1.1. Retail
- 5.1.2. Institutional
- 5.2. Market Analysis, Insights and Forecast - by Services Provided
- 5.2.1. Full Time Brokers
- 5.2.2. Discount Brokers
- 5.3. Market Analysis, Insights and Forecast - by Operation
- 5.3.1. Domestic
- 5.3.2. International
- 5.4. Market Analysis, Insights and Forecast - by Region
- 5.4.1. North America
- 5.4.2. South America
- 5.4.3. Europe
- 5.4.4. Middle East & Africa
- 5.4.5. Asia Pacific
- 5.1. Market Analysis, Insights and Forecast - by Investor Type
- 6. Global Electronic Brokerage Market in Netherlands Analysis, Insights and Forecast, 2021-2033
- 6.1. Market Analysis, Insights and Forecast - by Investor Type
- 6.1.1. Retail
- 6.1.2. Institutional
- 6.2. Market Analysis, Insights and Forecast - by Services Provided
- 6.2.1. Full Time Brokers
- 6.2.2. Discount Brokers
- 6.3. Market Analysis, Insights and Forecast - by Operation
- 6.3.1. Domestic
- 6.3.2. International
- 6.1. Market Analysis, Insights and Forecast - by Investor Type
- 7. North America Electronic Brokerage Market in Netherlands Analysis, Insights and Forecast, 2020-2032
- 7.1. Market Analysis, Insights and Forecast - by Investor Type
- 7.1.1. Retail
- 7.1.2. Institutional
- 7.2. Market Analysis, Insights and Forecast - by Services Provided
- 7.2.1. Full Time Brokers
- 7.2.2. Discount Brokers
- 7.3. Market Analysis, Insights and Forecast - by Operation
- 7.3.1. Domestic
- 7.3.2. International
- 7.1. Market Analysis, Insights and Forecast - by Investor Type
- 8. South America Electronic Brokerage Market in Netherlands Analysis, Insights and Forecast, 2020-2032
- 8.1. Market Analysis, Insights and Forecast - by Investor Type
- 8.1.1. Retail
- 8.1.2. Institutional
- 8.2. Market Analysis, Insights and Forecast - by Services Provided
- 8.2.1. Full Time Brokers
- 8.2.2. Discount Brokers
- 8.3. Market Analysis, Insights and Forecast - by Operation
- 8.3.1. Domestic
- 8.3.2. International
- 8.1. Market Analysis, Insights and Forecast - by Investor Type
- 9. Europe Electronic Brokerage Market in Netherlands Analysis, Insights and Forecast, 2020-2032
- 9.1. Market Analysis, Insights and Forecast - by Investor Type
- 9.1.1. Retail
- 9.1.2. Institutional
- 9.2. Market Analysis, Insights and Forecast - by Services Provided
- 9.2.1. Full Time Brokers
- 9.2.2. Discount Brokers
- 9.3. Market Analysis, Insights and Forecast - by Operation
- 9.3.1. Domestic
- 9.3.2. International
- 9.1. Market Analysis, Insights and Forecast - by Investor Type
- 10. Middle East & Africa Electronic Brokerage Market in Netherlands Analysis, Insights and Forecast, 2020-2032
- 10.1. Market Analysis, Insights and Forecast - by Investor Type
- 10.1.1. Retail
- 10.1.2. Institutional
- 10.2. Market Analysis, Insights and Forecast - by Services Provided
- 10.2.1. Full Time Brokers
- 10.2.2. Discount Brokers
- 10.3. Market Analysis, Insights and Forecast - by Operation
- 10.3.1. Domestic
- 10.3.2. International
- 10.1. Market Analysis, Insights and Forecast - by Investor Type
- 11. Asia Pacific Electronic Brokerage Market in Netherlands Analysis, Insights and Forecast, 2020-2032
- 11.1. Market Analysis, Insights and Forecast - by Investor Type
- 11.1.1. Retail
- 11.1.2. Institutional
- 11.2. Market Analysis, Insights and Forecast - by Services Provided
- 11.2.1. Full Time Brokers
- 11.2.2. Discount Brokers
- 11.3. Market Analysis, Insights and Forecast - by Operation
- 11.3.1. Domestic
- 11.3.2. International
- 11.1. Market Analysis, Insights and Forecast - by Investor Type
- 12. Competitive Analysis
- 12.1. Company Profiles
- 12.1.1 Interactive Brokers
- 12.1.1.1. Company Overview
- 12.1.1.2. Products
- 12.1.1.3. Company Financials
- 12.1.1.4. SWOT Analysis
- 12.1.2 Degiro
- 12.1.2.1. Company Overview
- 12.1.2.2. Products
- 12.1.2.3. Company Financials
- 12.1.2.4. SWOT Analysis
- 12.1.3 XTB S A
- 12.1.3.1. Company Overview
- 12.1.3.2. Products
- 12.1.3.3. Company Financials
- 12.1.3.4. SWOT Analysis
- 12.1.4 Saxo bank
- 12.1.4.1. Company Overview
- 12.1.4.2. Products
- 12.1.4.3. Company Financials
- 12.1.4.4. SWOT Analysis
- 12.1.5 eToro
- 12.1.5.1. Company Overview
- 12.1.5.2. Products
- 12.1.5.3. Company Financials
- 12.1.5.4. SWOT Analysis
- 12.1.6 Euronext Group
- 12.1.6.1. Company Overview
- 12.1.6.2. Products
- 12.1.6.3. Company Financials
- 12.1.6.4. SWOT Analysis
- 12.1.7 LYNX
- 12.1.7.1. Company Overview
- 12.1.7.2. Products
- 12.1.7.3. Company Financials
- 12.1.7.4. SWOT Analysis
- 12.1.8 IC Markets
- 12.1.8.1. Company Overview
- 12.1.8.2. Products
- 12.1.8.3. Company Financials
- 12.1.8.4. SWOT Analysis
- 12.1.9 RoboForex
- 12.1.9.1. Company Overview
- 12.1.9.2. Products
- 12.1.9.3. Company Financials
- 12.1.9.4. SWOT Analysis
- 12.1.10 FP Markets**List Not Exhaustive
- 12.1.10.1. Company Overview
- 12.1.10.2. Products
- 12.1.10.3. Company Financials
- 12.1.10.4. SWOT Analysis
- 12.1.1 Interactive Brokers
- 12.2. Market Entropy
- 12.2.1 Company's Key Areas Served
- 12.2.2 Recent Developments
- 12.3. Company Market Share Analysis 2025
- 12.3.1 Top 5 Companies Market Share Analysis
- 12.3.2 Top 3 Companies Market Share Analysis
- 12.4. List of Potential Customers
- 13. Research Methodology
List of Figures
- Figure 1: Global Electronic Brokerage Market in Netherlands Revenue Breakdown (billion, %) by Region 2025 & 2033
- Figure 2: North America Electronic Brokerage Market in Netherlands Revenue (billion), by Investor Type 2025 & 2033
- Figure 3: North America Electronic Brokerage Market in Netherlands Revenue Share (%), by Investor Type 2025 & 2033
- Figure 4: North America Electronic Brokerage Market in Netherlands Revenue (billion), by Services Provided 2025 & 2033
- Figure 5: North America Electronic Brokerage Market in Netherlands Revenue Share (%), by Services Provided 2025 & 2033
- Figure 6: North America Electronic Brokerage Market in Netherlands Revenue (billion), by Operation 2025 & 2033
- Figure 7: North America Electronic Brokerage Market in Netherlands Revenue Share (%), by Operation 2025 & 2033
- Figure 8: North America Electronic Brokerage Market in Netherlands Revenue (billion), by Country 2025 & 2033
- Figure 9: North America Electronic Brokerage Market in Netherlands Revenue Share (%), by Country 2025 & 2033
- Figure 10: South America Electronic Brokerage Market in Netherlands Revenue (billion), by Investor Type 2025 & 2033
- Figure 11: South America Electronic Brokerage Market in Netherlands Revenue Share (%), by Investor Type 2025 & 2033
- Figure 12: South America Electronic Brokerage Market in Netherlands Revenue (billion), by Services Provided 2025 & 2033
- Figure 13: South America Electronic Brokerage Market in Netherlands Revenue Share (%), by Services Provided 2025 & 2033
- Figure 14: South America Electronic Brokerage Market in Netherlands Revenue (billion), by Operation 2025 & 2033
- Figure 15: South America Electronic Brokerage Market in Netherlands Revenue Share (%), by Operation 2025 & 2033
- Figure 16: South America Electronic Brokerage Market in Netherlands Revenue (billion), by Country 2025 & 2033
- Figure 17: South America Electronic Brokerage Market in Netherlands Revenue Share (%), by Country 2025 & 2033
- Figure 18: Europe Electronic Brokerage Market in Netherlands Revenue (billion), by Investor Type 2025 & 2033
- Figure 19: Europe Electronic Brokerage Market in Netherlands Revenue Share (%), by Investor Type 2025 & 2033
- Figure 20: Europe Electronic Brokerage Market in Netherlands Revenue (billion), by Services Provided 2025 & 2033
- Figure 21: Europe Electronic Brokerage Market in Netherlands Revenue Share (%), by Services Provided 2025 & 2033
- Figure 22: Europe Electronic Brokerage Market in Netherlands Revenue (billion), by Operation 2025 & 2033
- Figure 23: Europe Electronic Brokerage Market in Netherlands Revenue Share (%), by Operation 2025 & 2033
- Figure 24: Europe Electronic Brokerage Market in Netherlands Revenue (billion), by Country 2025 & 2033
- Figure 25: Europe Electronic Brokerage Market in Netherlands Revenue Share (%), by Country 2025 & 2033
- Figure 26: Middle East & Africa Electronic Brokerage Market in Netherlands Revenue (billion), by Investor Type 2025 & 2033
- Figure 27: Middle East & Africa Electronic Brokerage Market in Netherlands Revenue Share (%), by Investor Type 2025 & 2033
- Figure 28: Middle East & Africa Electronic Brokerage Market in Netherlands Revenue (billion), by Services Provided 2025 & 2033
- Figure 29: Middle East & Africa Electronic Brokerage Market in Netherlands Revenue Share (%), by Services Provided 2025 & 2033
- Figure 30: Middle East & Africa Electronic Brokerage Market in Netherlands Revenue (billion), by Operation 2025 & 2033
- Figure 31: Middle East & Africa Electronic Brokerage Market in Netherlands Revenue Share (%), by Operation 2025 & 2033
- Figure 32: Middle East & Africa Electronic Brokerage Market in Netherlands Revenue (billion), by Country 2025 & 2033
- Figure 33: Middle East & Africa Electronic Brokerage Market in Netherlands Revenue Share (%), by Country 2025 & 2033
- Figure 34: Asia Pacific Electronic Brokerage Market in Netherlands Revenue (billion), by Investor Type 2025 & 2033
- Figure 35: Asia Pacific Electronic Brokerage Market in Netherlands Revenue Share (%), by Investor Type 2025 & 2033
- Figure 36: Asia Pacific Electronic Brokerage Market in Netherlands Revenue (billion), by Services Provided 2025 & 2033
- Figure 37: Asia Pacific Electronic Brokerage Market in Netherlands Revenue Share (%), by Services Provided 2025 & 2033
- Figure 38: Asia Pacific Electronic Brokerage Market in Netherlands Revenue (billion), by Operation 2025 & 2033
- Figure 39: Asia Pacific Electronic Brokerage Market in Netherlands Revenue Share (%), by Operation 2025 & 2033
- Figure 40: Asia Pacific Electronic Brokerage Market in Netherlands Revenue (billion), by Country 2025 & 2033
- Figure 41: Asia Pacific Electronic Brokerage Market in Netherlands Revenue Share (%), by Country 2025 & 2033
List of Tables
- Table 1: Global Electronic Brokerage Market in Netherlands Revenue billion Forecast, by Investor Type 2020 & 2033
- Table 2: Global Electronic Brokerage Market in Netherlands Revenue billion Forecast, by Services Provided 2020 & 2033
- Table 3: Global Electronic Brokerage Market in Netherlands Revenue billion Forecast, by Operation 2020 & 2033
- Table 4: Global Electronic Brokerage Market in Netherlands Revenue billion Forecast, by Region 2020 & 2033
- Table 5: Global Electronic Brokerage Market in Netherlands Revenue billion Forecast, by Investor Type 2020 & 2033
- Table 6: Global Electronic Brokerage Market in Netherlands Revenue billion Forecast, by Services Provided 2020 & 2033
- Table 7: Global Electronic Brokerage Market in Netherlands Revenue billion Forecast, by Operation 2020 & 2033
- Table 8: Global Electronic Brokerage Market in Netherlands Revenue billion Forecast, by Country 2020 & 2033
- Table 9: United States Electronic Brokerage Market in Netherlands Revenue (billion) Forecast, by Application 2020 & 2033
- Table 10: Canada Electronic Brokerage Market in Netherlands Revenue (billion) Forecast, by Application 2020 & 2033
- Table 11: Mexico Electronic Brokerage Market in Netherlands Revenue (billion) Forecast, by Application 2020 & 2033
- Table 12: Global Electronic Brokerage Market in Netherlands Revenue billion Forecast, by Investor Type 2020 & 2033
- Table 13: Global Electronic Brokerage Market in Netherlands Revenue billion Forecast, by Services Provided 2020 & 2033
- Table 14: Global Electronic Brokerage Market in Netherlands Revenue billion Forecast, by Operation 2020 & 2033
- Table 15: Global Electronic Brokerage Market in Netherlands Revenue billion Forecast, by Country 2020 & 2033
- Table 16: Brazil Electronic Brokerage Market in Netherlands Revenue (billion) Forecast, by Application 2020 & 2033
- Table 17: Argentina Electronic Brokerage Market in Netherlands Revenue (billion) Forecast, by Application 2020 & 2033
- Table 18: Rest of South America Electronic Brokerage Market in Netherlands Revenue (billion) Forecast, by Application 2020 & 2033
- Table 19: Global Electronic Brokerage Market in Netherlands Revenue billion Forecast, by Investor Type 2020 & 2033
- Table 20: Global Electronic Brokerage Market in Netherlands Revenue billion Forecast, by Services Provided 2020 & 2033
- Table 21: Global Electronic Brokerage Market in Netherlands Revenue billion Forecast, by Operation 2020 & 2033
- Table 22: Global Electronic Brokerage Market in Netherlands Revenue billion Forecast, by Country 2020 & 2033
- Table 23: United Kingdom Electronic Brokerage Market in Netherlands Revenue (billion) Forecast, by Application 2020 & 2033
- Table 24: Germany Electronic Brokerage Market in Netherlands Revenue (billion) Forecast, by Application 2020 & 2033
- Table 25: France Electronic Brokerage Market in Netherlands Revenue (billion) Forecast, by Application 2020 & 2033
- Table 26: Italy Electronic Brokerage Market in Netherlands Revenue (billion) Forecast, by Application 2020 & 2033
- Table 27: Spain Electronic Brokerage Market in Netherlands Revenue (billion) Forecast, by Application 2020 & 2033
- Table 28: Russia Electronic Brokerage Market in Netherlands Revenue (billion) Forecast, by Application 2020 & 2033
- Table 29: Benelux Electronic Brokerage Market in Netherlands Revenue (billion) Forecast, by Application 2020 & 2033
- Table 30: Nordics Electronic Brokerage Market in Netherlands Revenue (billion) Forecast, by Application 2020 & 2033
- Table 31: Rest of Europe Electronic Brokerage Market in Netherlands Revenue (billion) Forecast, by Application 2020 & 2033
- Table 32: Global Electronic Brokerage Market in Netherlands Revenue billion Forecast, by Investor Type 2020 & 2033
- Table 33: Global Electronic Brokerage Market in Netherlands Revenue billion Forecast, by Services Provided 2020 & 2033
- Table 34: Global Electronic Brokerage Market in Netherlands Revenue billion Forecast, by Operation 2020 & 2033
- Table 35: Global Electronic Brokerage Market in Netherlands Revenue billion Forecast, by Country 2020 & 2033
- Table 36: Turkey Electronic Brokerage Market in Netherlands Revenue (billion) Forecast, by Application 2020 & 2033
- Table 37: Israel Electronic Brokerage Market in Netherlands Revenue (billion) Forecast, by Application 2020 & 2033
- Table 38: GCC Electronic Brokerage Market in Netherlands Revenue (billion) Forecast, by Application 2020 & 2033
- Table 39: North Africa Electronic Brokerage Market in Netherlands Revenue (billion) Forecast, by Application 2020 & 2033
- Table 40: South Africa Electronic Brokerage Market in Netherlands Revenue (billion) Forecast, by Application 2020 & 2033
- Table 41: Rest of Middle East & Africa Electronic Brokerage Market in Netherlands Revenue (billion) Forecast, by Application 2020 & 2033
- Table 42: Global Electronic Brokerage Market in Netherlands Revenue billion Forecast, by Investor Type 2020 & 2033
- Table 43: Global Electronic Brokerage Market in Netherlands Revenue billion Forecast, by Services Provided 2020 & 2033
- Table 44: Global Electronic Brokerage Market in Netherlands Revenue billion Forecast, by Operation 2020 & 2033
- Table 45: Global Electronic Brokerage Market in Netherlands Revenue billion Forecast, by Country 2020 & 2033
- Table 46: China Electronic Brokerage Market in Netherlands Revenue (billion) Forecast, by Application 2020 & 2033
- Table 47: India Electronic Brokerage Market in Netherlands Revenue (billion) Forecast, by Application 2020 & 2033
- Table 48: Japan Electronic Brokerage Market in Netherlands Revenue (billion) Forecast, by Application 2020 & 2033
- Table 49: South Korea Electronic Brokerage Market in Netherlands Revenue (billion) Forecast, by Application 2020 & 2033
- Table 50: ASEAN Electronic Brokerage Market in Netherlands Revenue (billion) Forecast, by Application 2020 & 2033
- Table 51: Oceania Electronic Brokerage Market in Netherlands Revenue (billion) Forecast, by Application 2020 & 2033
- Table 52: Rest of Asia Pacific Electronic Brokerage Market in Netherlands Revenue (billion) Forecast, by Application 2020 & 2033
Frequently Asked Questions
1. What is the projected Compound Annual Growth Rate (CAGR) of the Electronic Brokerage Market in Netherlands?
The projected CAGR is approximately 7.3%.
2. Which companies are prominent players in the Electronic Brokerage Market in Netherlands?
Key companies in the market include Interactive Brokers, Degiro, XTB S A, Saxo bank, eToro, Euronext Group, LYNX, IC Markets, RoboForex, FP Markets**List Not Exhaustive.
3. What are the main segments of the Electronic Brokerage Market in Netherlands?
The market segments include Investor Type, Services Provided, Operation.
4. Can you provide details about the market size?
The market size is estimated to be USD 1.12 billion as of 2022.
5. What are some drivers contributing to market growth?
N/A
6. What are the notable trends driving market growth?
Growing Investing Household Signifying Rising E-Brokerage in Netherlands.
7. Are there any restraints impacting market growth?
N/A
8. Can you provide examples of recent developments in the market?
In September 2022, the leading European digital invetment platform, Scalable Capital expanded its presence in the Netherlands. Its subsidiaries Scalable Crypto and Scalable Broker are providing cost-effective and convenient trading and saving plans for Dutch retail clients with products like exchange traded funds (ETFs), stocks, cryptocurrencies, and mutual funds.
9. What pricing options are available for accessing the report?
Pricing options include single-user, multi-user, and enterprise licenses priced at USD 3800, USD 4500, and USD 5800 respectively.
10. Is the market size provided in terms of value or volume?
The market size is provided in terms of value, measured in billion.
11. Are there any specific market keywords associated with the report?
Yes, the market keyword associated with the report is "Electronic Brokerage Market in Netherlands," which aids in identifying and referencing the specific market segment covered.
12. How do I determine which pricing option suits my needs best?
The pricing options vary based on user requirements and access needs. Individual users may opt for single-user licenses, while businesses requiring broader access may choose multi-user or enterprise licenses for cost-effective access to the report.
13. Are there any additional resources or data provided in the Electronic Brokerage Market in Netherlands report?
While the report offers comprehensive insights, it's advisable to review the specific contents or supplementary materials provided to ascertain if additional resources or data are available.
14. How can I stay updated on further developments or reports in the Electronic Brokerage Market in Netherlands?
To stay informed about further developments, trends, and reports in the Electronic Brokerage Market in Netherlands, consider subscribing to industry newsletters, following relevant companies and organizations, or regularly checking reputable industry news sources and publications.
Methodology
Step 1 - Identification of Relevant Samples Size from Population Database


Step 2 - Approaches for Defining Global Market Size (Value, Volume* & Price*)

Note*: In applicable scenarios
Step 3 - Data Sources
Primary Research
- Web Analytics
- Survey Reports
- Research Institute
- Latest Research Reports
- Opinion Leaders
Secondary Research
- Annual Reports
- White Paper
- Latest Press Release
- Industry Association
- Paid Database
- Investor Presentations

Step 4 - Data Triangulation
Involves using different sources of information in order to increase the validity of a study
These sources are likely to be stakeholders in a program - participants, other researchers, program staff, other community members, and so on.
Then we put all data in single framework & apply various statistical tools to find out the dynamic on the market.
During the analysis stage, feedback from the stakeholder groups would be compared to determine areas of agreement as well as areas of divergence