

Key Insights
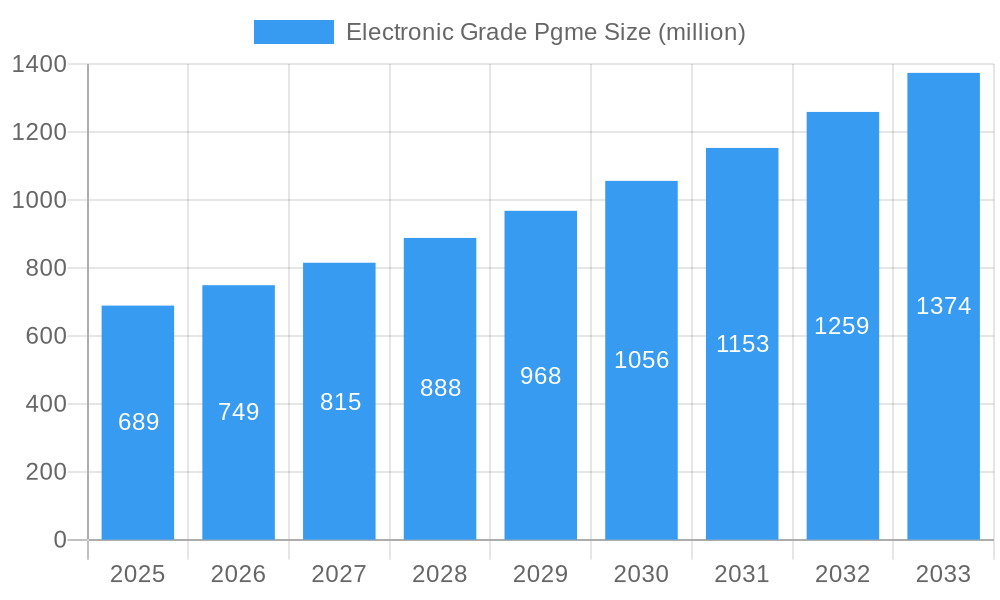
The Electronic Grade PGME market, valued at $689 million in 2025, is projected to experience robust growth, driven by the burgeoning electronics industry and the increasing demand for high-performance electronic devices. A compound annual growth rate (CAGR) of 8.8% from 2025 to 2033 indicates a significant expansion in market size, reaching an estimated $1.4 billion by 2033. This growth is fueled by several key factors. The miniaturization of electronics necessitates the use of high-purity PGME in various manufacturing processes, particularly in the production of advanced semiconductors and flexible displays. Furthermore, the rising adoption of 5G technology and the expansion of the Internet of Things (IoT) are expected to further stimulate demand for Electronic Grade PGME. Stringent regulatory requirements concerning the purity and safety of electronic materials are also influencing market dynamics, pushing manufacturers to invest in advanced production methods and quality control. Competitive intensity within the market is moderate, with key players such as Daicel, Dow Inc, KH Neochem, Shiny Chemical Industrial, Chemtronics, Jiangsu Mingfeng Electronic Materials, and Jiangsu Yida Chemical vying for market share through product innovation and strategic partnerships.
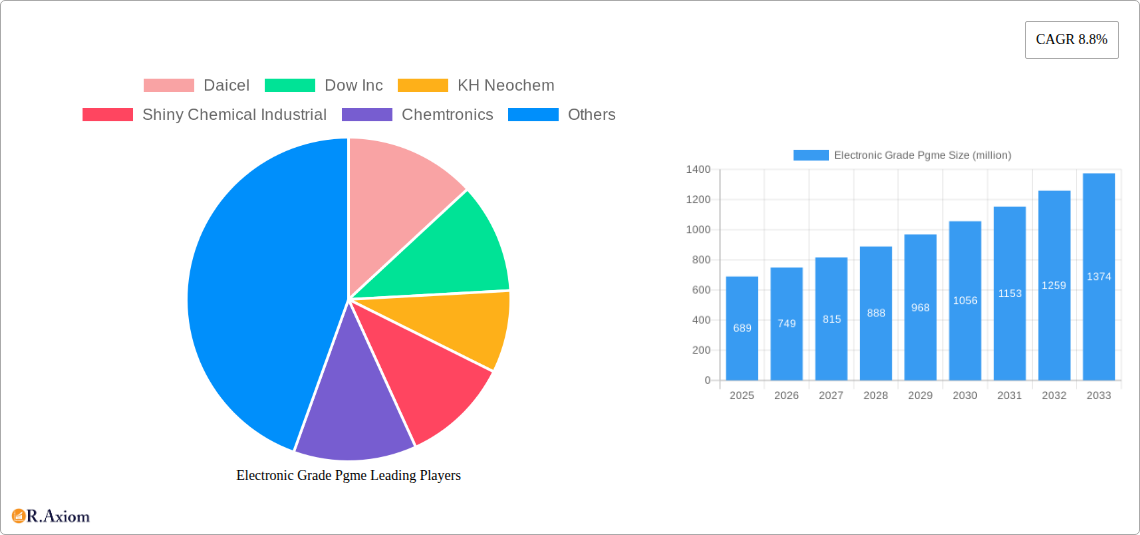
Electronic Grade Pgme Market Size (In Million)
While the market exhibits strong growth potential, certain challenges remain. Fluctuations in raw material prices and potential supply chain disruptions could impact profitability and product availability. Additionally, the development of alternative materials with comparable or superior performance characteristics presents a potential threat to PGME's market share. However, ongoing research and development efforts focused on improving the efficiency and cost-effectiveness of PGME production are likely to mitigate these challenges and sustain the market's positive trajectory. Regional variations in market growth are anticipated, with regions like Asia-Pacific and North America expected to be key contributors due to their concentrated electronics manufacturing hubs and high technological adoption rates. The market segmentation, while not explicitly defined, likely includes distinctions based on purity levels, application types (e.g., semiconductor manufacturing, display manufacturing), and packaging.
Electronic Grade Pgme Company Market Share
Electronic Grade PGME Market Report: 2019-2033 Forecast
This comprehensive report provides a detailed analysis of the global Electronic Grade PGME market, offering invaluable insights for industry stakeholders, investors, and strategic decision-makers. The report covers the period from 2019 to 2033, with a base year of 2025 and a forecast period spanning 2025-2033. This in-depth study examines market dynamics, key players, emerging trends, and future growth potential, providing actionable intelligence for navigating this evolving landscape. The report leverages extensive primary and secondary research, offering a robust understanding of the Electronic Grade PGME market valued at xx million in 2025, projected to reach xx million by 2033, exhibiting a CAGR of xx% during the forecast period.
Electronic Grade PGME Market Concentration & Innovation
The Electronic Grade PGME market exhibits a moderately concentrated landscape, with key players like Daicel, Dow Inc, KH Neochem, Shiny Chemical Industrial, Chemtronics, Jiangsu Mingfeng Electronic Materials, and Jiangsu Yida Chemical holding significant market share. However, the market is witnessing increasing competition from new entrants, driven by technological advancements and rising demand.
- Market Concentration: The top 5 players account for approximately xx% of the global market share in 2025.
- Innovation Drivers: R&D investments in novel PGME formulations with improved purity and performance characteristics are key drivers. The push for miniaturization in electronics is demanding higher-grade materials.
- Regulatory Frameworks: Stringent environmental regulations are impacting production processes and driving innovation towards more sustainable PGME manufacturing methods.
- Product Substitutes: Limited viable substitutes exist for Electronic Grade PGME in its core applications, making the market relatively resilient to substitution pressures.
- End-User Trends: The increasing demand for advanced electronic devices, particularly smartphones, high-performance computing, and 5G infrastructure, fuels market growth.
- M&A Activities: In recent years, there have been xx M&A deals valued at approximately xx million, indicating consolidation within the market. These deals largely focused on expanding geographical reach and product portfolios.
Electronic Grade PGME Industry Trends & Insights
The Electronic Grade PGME market is experiencing significant growth, driven by several key factors. The robust growth of the electronics industry is the primary engine, particularly within the semiconductor and display manufacturing sectors. Technological advancements such as the development of advanced lithographic techniques and the miniaturization of electronic components are continuously driving demand. Increased consumer demand for high-performance electronics is further accelerating market growth. Competitive dynamics are shaped by continuous innovation in PGME formulations to meet evolving industry needs and increasing regulatory scrutiny. The market penetration of Electronic Grade PGME in specialized applications, like flexible electronics, is also increasing. The projected CAGR reflects the collective impact of these factors.
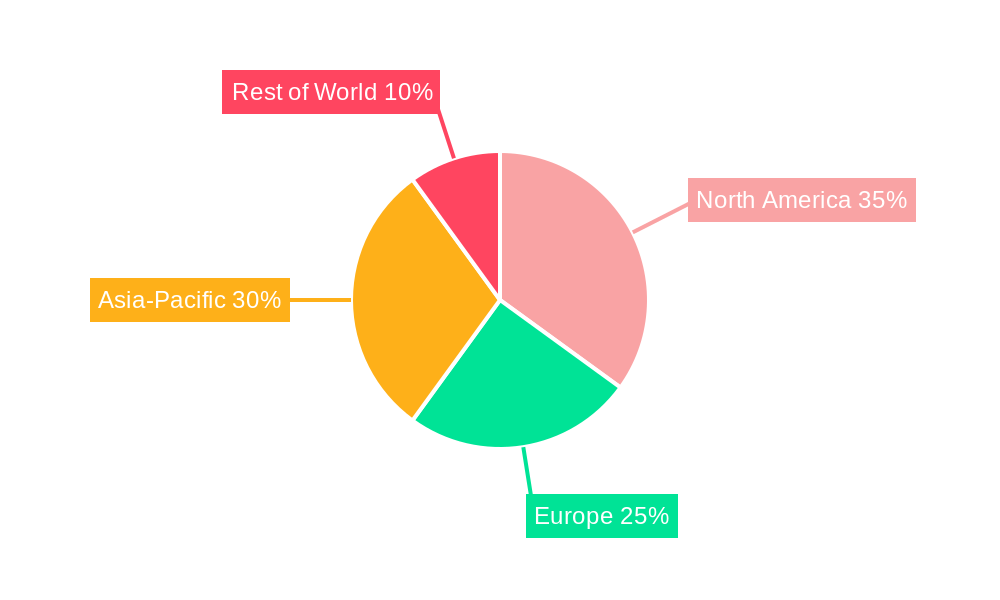
Dominant Markets & Segments in Electronic Grade PGME
The Asia-Pacific region dominates the global Electronic Grade PGME market, driven by the concentration of electronics manufacturing hubs in China, South Korea, Taiwan, and Japan. This dominance is attributed to various factors:
- Key Drivers in Asia-Pacific:
- Large and rapidly growing electronics manufacturing base
- Favorable government policies supporting the semiconductor and display industries
- Significant investments in R&D and infrastructure
- High demand for advanced electronic devices
- Dominance Analysis: The robust growth of the electronics sector in this region directly translates into a higher demand for high-quality Electronic Grade PGME. The presence of major PGME manufacturers within the region further strengthens its market position. While other regions are showing growth, the Asia-Pacific region is expected to maintain its lead throughout the forecast period.
Electronic Grade PGME Product Developments
Recent advancements focus on developing PGME with enhanced purity, lower viscosity, and improved compatibility with advanced lithographic techniques. These improvements are crucial for achieving finer feature sizes and higher yields in semiconductor manufacturing. The emphasis is on developing environmentally friendly PGME formulations that meet increasingly stringent regulations. New applications in emerging fields like flexible electronics are also driving product development. The competitive advantage lies in providing high-purity PGME with consistent quality and reliable supply.
Report Scope & Segmentation Analysis
The report segments the Electronic Grade PGME market based on several factors: By Grade: (e.g., High Purity, Ultra-High Purity); By Application: (e.g., Semiconductor Manufacturing, Display Manufacturing, Other Applications); By Region: (e.g., Asia-Pacific, North America, Europe, Rest of the World). Each segment provides detailed market size estimations and growth projections. The competitive landscape within each segment is also analyzed, highlighting key players, their market shares, and competitive strategies.
Key Drivers of Electronic Grade PGME Growth
The growth of the Electronic Grade PGME market is driven by several key factors. The increasing demand for advanced electronic devices, particularly smartphones and high-performance computers, is a major driver. Technological advancements such as the development of more efficient and advanced lithographic techniques are also contributing to the market's growth. Government incentives and supportive regulations in several key regions further fuel market expansion. The trend towards miniaturization in electronics requires higher-grade materials, creating a strong demand for Electronic Grade PGME.
Challenges in the Electronic Grade PGME Sector
The Electronic Grade PGME sector faces challenges including fluctuating raw material prices, stringent environmental regulations requiring costly upgrades to manufacturing processes, and intense competition among established and emerging players. Supply chain disruptions can significantly impact production and pricing. The need to continuously invest in R&D to develop advanced PGME formulations represents a significant cost for manufacturers.
Emerging Opportunities in Electronic Grade PGME
Emerging opportunities exist in the development of sustainable and environmentally friendly PGME formulations. Growing demand for advanced electronic components in diverse sectors, like automotive and healthcare, presents significant expansion opportunities. The rising adoption of flexible electronics and advancements in 3D printing technology create new applications for specialized PGME grades.
Key Developments in Electronic Grade PGME Industry
- January 2023: Dow Inc announces the launch of a new, high-purity PGME formulation for advanced lithography applications.
- June 2022: Daicel invests xx million in expanding its PGME production capacity in Japan.
- September 2021: A merger between two smaller PGME manufacturers results in a combined entity with expanded market reach. (Further details would be added in the full report if available)
Strategic Outlook for Electronic Grade PGME Market
The Electronic Grade PGME market is poised for sustained growth, fueled by ongoing advancements in electronics technology and the continuous miniaturization of electronic components. The increasing demand for high-performance electronics and the expansion of application areas will drive market expansion throughout the forecast period. Strategic partnerships and investments in R&D will play crucial roles in maintaining competitiveness and capturing market share. Sustainable manufacturing practices will be essential for long-term success in this sector.
Electronic Grade Pgme Segmentation
-
1. Application
- 1.1. Semiconductor
- 1.2. Panel
- 1.3. Others
-
2. Type
- 2.1. 99.90% Purity
- 2.2. 99.95% Purity
- 2.3. Others
Electronic Grade Pgme Segmentation By Geography
-
1. North America
- 1.1. United States
- 1.2. Canada
- 1.3. Mexico
-
2. South America
- 2.1. Brazil
- 2.2. Argentina
- 2.3. Rest of South America
-
3. Europe
- 3.1. United Kingdom
- 3.2. Germany
- 3.3. France
- 3.4. Italy
- 3.5. Spain
- 3.6. Russia
- 3.7. Benelux
- 3.8. Nordics
- 3.9. Rest of Europe
-
4. Middle East & Africa
- 4.1. Turkey
- 4.2. Israel
- 4.3. GCC
- 4.4. North Africa
- 4.5. South Africa
- 4.6. Rest of Middle East & Africa
-
5. Asia Pacific
- 5.1. China
- 5.2. India
- 5.3. Japan
- 5.4. South Korea
- 5.5. ASEAN
- 5.6. Oceania
- 5.7. Rest of Asia Pacific
Electronic Grade Pgme Regional Market Share
Geographic Coverage of Electronic Grade Pgme
Electronic Grade Pgme REPORT HIGHLIGHTS
| Aspects | Details |
|---|---|
| Study Period | 2020-2034 |
| Base Year | 2025 |
| Estimated Year | 2026 |
| Forecast Period | 2026-2034 |
| Historical Period | 2020-2025 |
| Growth Rate | CAGR of 8.8% from 2020-2034 |
| Segmentation |
|
Table of Contents
- 1. Introduction
- 1.1. Research Scope
- 1.2. Market Segmentation
- 1.3. Research Objective
- 1.4. Definitions and Assumptions
- 2. Executive Summary
- 2.1. Market Snapshot
- 3. Market Dynamics
- 3.1. Market Drivers
- 3.2. Market Restrains
- 3.3. Market Trends
- 3.4. Market Opportunities
- 4. Market Factor Analysis
- 4.1. Porters Five Forces
- 4.1.1. Bargaining Power of Suppliers
- 4.1.2. Bargaining Power of Buyers
- 4.1.3. Threat of New Entrants
- 4.1.4. Threat of Substitutes
- 4.1.5. Competitive Rivalry
- 4.2. PESTEL analysis
- 4.3. BCG Analysis
- 4.3.1. Stars (High Growth, High Market Share)
- 4.3.2. Cash Cows (Low Growth, High Market Share)
- 4.3.3. Question Mark (High Growth, Low Market Share)
- 4.3.4. Dogs (Low Growth, Low Market Share)
- 4.4. Ansoff Matrix Analysis
- 4.5. Supply Chain Analysis
- 4.6. Regulatory Landscape
- 4.7. Current Market Potential and Opportunity Assessment (TAM–SAM–SOM Framework)
- 4.8. RAX Analyst Note
- 4.1. Porters Five Forces
- 5. Market Analysis, Insights and Forecast 2021-2033
- 5.1. Market Analysis, Insights and Forecast - by Application
- 5.1.1. Semiconductor
- 5.1.2. Panel
- 5.1.3. Others
- 5.2. Market Analysis, Insights and Forecast - by Type
- 5.2.1. 99.90% Purity
- 5.2.2. 99.95% Purity
- 5.2.3. Others
- 5.3. Market Analysis, Insights and Forecast - by Region
- 5.3.1. North America
- 5.3.2. South America
- 5.3.3. Europe
- 5.3.4. Middle East & Africa
- 5.3.5. Asia Pacific
- 5.1. Market Analysis, Insights and Forecast - by Application
- 6. Global Electronic Grade Pgme Analysis, Insights and Forecast, 2021-2033
- 6.1. Market Analysis, Insights and Forecast - by Application
- 6.1.1. Semiconductor
- 6.1.2. Panel
- 6.1.3. Others
- 6.2. Market Analysis, Insights and Forecast - by Type
- 6.2.1. 99.90% Purity
- 6.2.2. 99.95% Purity
- 6.2.3. Others
- 6.1. Market Analysis, Insights and Forecast - by Application
- 7. North America Electronic Grade Pgme Analysis, Insights and Forecast, 2020-2032
- 7.1. Market Analysis, Insights and Forecast - by Application
- 7.1.1. Semiconductor
- 7.1.2. Panel
- 7.1.3. Others
- 7.2. Market Analysis, Insights and Forecast - by Type
- 7.2.1. 99.90% Purity
- 7.2.2. 99.95% Purity
- 7.2.3. Others
- 7.1. Market Analysis, Insights and Forecast - by Application
- 8. South America Electronic Grade Pgme Analysis, Insights and Forecast, 2020-2032
- 8.1. Market Analysis, Insights and Forecast - by Application
- 8.1.1. Semiconductor
- 8.1.2. Panel
- 8.1.3. Others
- 8.2. Market Analysis, Insights and Forecast - by Type
- 8.2.1. 99.90% Purity
- 8.2.2. 99.95% Purity
- 8.2.3. Others
- 8.1. Market Analysis, Insights and Forecast - by Application
- 9. Europe Electronic Grade Pgme Analysis, Insights and Forecast, 2020-2032
- 9.1. Market Analysis, Insights and Forecast - by Application
- 9.1.1. Semiconductor
- 9.1.2. Panel
- 9.1.3. Others
- 9.2. Market Analysis, Insights and Forecast - by Type
- 9.2.1. 99.90% Purity
- 9.2.2. 99.95% Purity
- 9.2.3. Others
- 9.1. Market Analysis, Insights and Forecast - by Application
- 10. Middle East & Africa Electronic Grade Pgme Analysis, Insights and Forecast, 2020-2032
- 10.1. Market Analysis, Insights and Forecast - by Application
- 10.1.1. Semiconductor
- 10.1.2. Panel
- 10.1.3. Others
- 10.2. Market Analysis, Insights and Forecast - by Type
- 10.2.1. 99.90% Purity
- 10.2.2. 99.95% Purity
- 10.2.3. Others
- 10.1. Market Analysis, Insights and Forecast - by Application
- 11. Asia Pacific Electronic Grade Pgme Analysis, Insights and Forecast, 2020-2032
- 11.1. Market Analysis, Insights and Forecast - by Application
- 11.1.1. Semiconductor
- 11.1.2. Panel
- 11.1.3. Others
- 11.2. Market Analysis, Insights and Forecast - by Type
- 11.2.1. 99.90% Purity
- 11.2.2. 99.95% Purity
- 11.2.3. Others
- 11.1. Market Analysis, Insights and Forecast - by Application
- 12. Competitive Analysis
- 12.1. Company Profiles
- 12.1.1 Daicel
- 12.1.1.1. Company Overview
- 12.1.1.2. Products
- 12.1.1.3. Company Financials
- 12.1.1.4. SWOT Analysis
- 12.1.2 Dow Inc
- 12.1.2.1. Company Overview
- 12.1.2.2. Products
- 12.1.2.3. Company Financials
- 12.1.2.4. SWOT Analysis
- 12.1.3 KH Neochem
- 12.1.3.1. Company Overview
- 12.1.3.2. Products
- 12.1.3.3. Company Financials
- 12.1.3.4. SWOT Analysis
- 12.1.4 Shiny Chemical Industrial
- 12.1.4.1. Company Overview
- 12.1.4.2. Products
- 12.1.4.3. Company Financials
- 12.1.4.4. SWOT Analysis
- 12.1.5 Chemtronics
- 12.1.5.1. Company Overview
- 12.1.5.2. Products
- 12.1.5.3. Company Financials
- 12.1.5.4. SWOT Analysis
- 12.1.6 Jiangsu Mingfeng Electronic Materials
- 12.1.6.1. Company Overview
- 12.1.6.2. Products
- 12.1.6.3. Company Financials
- 12.1.6.4. SWOT Analysis
- 12.1.7 Jiangsu Yida Chemical
- 12.1.7.1. Company Overview
- 12.1.7.2. Products
- 12.1.7.3. Company Financials
- 12.1.7.4. SWOT Analysis
- 12.1.1 Daicel
- 12.2. Market Entropy
- 12.2.1 Company's Key Areas Served
- 12.2.2 Recent Developments
- 12.3. Company Market Share Analysis 2025
- 12.3.1 Top 5 Companies Market Share Analysis
- 12.3.2 Top 3 Companies Market Share Analysis
- 12.4. List of Potential Customers
- 13. Research Methodology
List of Figures
- Figure 1: Global Electronic Grade Pgme Revenue Breakdown (million, %) by Region 2025 & 2033
- Figure 2: North America Electronic Grade Pgme Revenue (million), by Application 2025 & 2033
- Figure 3: North America Electronic Grade Pgme Revenue Share (%), by Application 2025 & 2033
- Figure 4: North America Electronic Grade Pgme Revenue (million), by Type 2025 & 2033
- Figure 5: North America Electronic Grade Pgme Revenue Share (%), by Type 2025 & 2033
- Figure 6: North America Electronic Grade Pgme Revenue (million), by Country 2025 & 2033
- Figure 7: North America Electronic Grade Pgme Revenue Share (%), by Country 2025 & 2033
- Figure 8: South America Electronic Grade Pgme Revenue (million), by Application 2025 & 2033
- Figure 9: South America Electronic Grade Pgme Revenue Share (%), by Application 2025 & 2033
- Figure 10: South America Electronic Grade Pgme Revenue (million), by Type 2025 & 2033
- Figure 11: South America Electronic Grade Pgme Revenue Share (%), by Type 2025 & 2033
- Figure 12: South America Electronic Grade Pgme Revenue (million), by Country 2025 & 2033
- Figure 13: South America Electronic Grade Pgme Revenue Share (%), by Country 2025 & 2033
- Figure 14: Europe Electronic Grade Pgme Revenue (million), by Application 2025 & 2033
- Figure 15: Europe Electronic Grade Pgme Revenue Share (%), by Application 2025 & 2033
- Figure 16: Europe Electronic Grade Pgme Revenue (million), by Type 2025 & 2033
- Figure 17: Europe Electronic Grade Pgme Revenue Share (%), by Type 2025 & 2033
- Figure 18: Europe Electronic Grade Pgme Revenue (million), by Country 2025 & 2033
- Figure 19: Europe Electronic Grade Pgme Revenue Share (%), by Country 2025 & 2033
- Figure 20: Middle East & Africa Electronic Grade Pgme Revenue (million), by Application 2025 & 2033
- Figure 21: Middle East & Africa Electronic Grade Pgme Revenue Share (%), by Application 2025 & 2033
- Figure 22: Middle East & Africa Electronic Grade Pgme Revenue (million), by Type 2025 & 2033
- Figure 23: Middle East & Africa Electronic Grade Pgme Revenue Share (%), by Type 2025 & 2033
- Figure 24: Middle East & Africa Electronic Grade Pgme Revenue (million), by Country 2025 & 2033
- Figure 25: Middle East & Africa Electronic Grade Pgme Revenue Share (%), by Country 2025 & 2033
- Figure 26: Asia Pacific Electronic Grade Pgme Revenue (million), by Application 2025 & 2033
- Figure 27: Asia Pacific Electronic Grade Pgme Revenue Share (%), by Application 2025 & 2033
- Figure 28: Asia Pacific Electronic Grade Pgme Revenue (million), by Type 2025 & 2033
- Figure 29: Asia Pacific Electronic Grade Pgme Revenue Share (%), by Type 2025 & 2033
- Figure 30: Asia Pacific Electronic Grade Pgme Revenue (million), by Country 2025 & 2033
- Figure 31: Asia Pacific Electronic Grade Pgme Revenue Share (%), by Country 2025 & 2033
List of Tables
- Table 1: Global Electronic Grade Pgme Revenue million Forecast, by Application 2020 & 2033
- Table 2: Global Electronic Grade Pgme Revenue million Forecast, by Type 2020 & 2033
- Table 3: Global Electronic Grade Pgme Revenue million Forecast, by Region 2020 & 2033
- Table 4: Global Electronic Grade Pgme Revenue million Forecast, by Application 2020 & 2033
- Table 5: Global Electronic Grade Pgme Revenue million Forecast, by Type 2020 & 2033
- Table 6: Global Electronic Grade Pgme Revenue million Forecast, by Country 2020 & 2033
- Table 7: United States Electronic Grade Pgme Revenue (million) Forecast, by Application 2020 & 2033
- Table 8: Canada Electronic Grade Pgme Revenue (million) Forecast, by Application 2020 & 2033
- Table 9: Mexico Electronic Grade Pgme Revenue (million) Forecast, by Application 2020 & 2033
- Table 10: Global Electronic Grade Pgme Revenue million Forecast, by Application 2020 & 2033
- Table 11: Global Electronic Grade Pgme Revenue million Forecast, by Type 2020 & 2033
- Table 12: Global Electronic Grade Pgme Revenue million Forecast, by Country 2020 & 2033
- Table 13: Brazil Electronic Grade Pgme Revenue (million) Forecast, by Application 2020 & 2033
- Table 14: Argentina Electronic Grade Pgme Revenue (million) Forecast, by Application 2020 & 2033
- Table 15: Rest of South America Electronic Grade Pgme Revenue (million) Forecast, by Application 2020 & 2033
- Table 16: Global Electronic Grade Pgme Revenue million Forecast, by Application 2020 & 2033
- Table 17: Global Electronic Grade Pgme Revenue million Forecast, by Type 2020 & 2033
- Table 18: Global Electronic Grade Pgme Revenue million Forecast, by Country 2020 & 2033
- Table 19: United Kingdom Electronic Grade Pgme Revenue (million) Forecast, by Application 2020 & 2033
- Table 20: Germany Electronic Grade Pgme Revenue (million) Forecast, by Application 2020 & 2033
- Table 21: France Electronic Grade Pgme Revenue (million) Forecast, by Application 2020 & 2033
- Table 22: Italy Electronic Grade Pgme Revenue (million) Forecast, by Application 2020 & 2033
- Table 23: Spain Electronic Grade Pgme Revenue (million) Forecast, by Application 2020 & 2033
- Table 24: Russia Electronic Grade Pgme Revenue (million) Forecast, by Application 2020 & 2033
- Table 25: Benelux Electronic Grade Pgme Revenue (million) Forecast, by Application 2020 & 2033
- Table 26: Nordics Electronic Grade Pgme Revenue (million) Forecast, by Application 2020 & 2033
- Table 27: Rest of Europe Electronic Grade Pgme Revenue (million) Forecast, by Application 2020 & 2033
- Table 28: Global Electronic Grade Pgme Revenue million Forecast, by Application 2020 & 2033
- Table 29: Global Electronic Grade Pgme Revenue million Forecast, by Type 2020 & 2033
- Table 30: Global Electronic Grade Pgme Revenue million Forecast, by Country 2020 & 2033
- Table 31: Turkey Electronic Grade Pgme Revenue (million) Forecast, by Application 2020 & 2033
- Table 32: Israel Electronic Grade Pgme Revenue (million) Forecast, by Application 2020 & 2033
- Table 33: GCC Electronic Grade Pgme Revenue (million) Forecast, by Application 2020 & 2033
- Table 34: North Africa Electronic Grade Pgme Revenue (million) Forecast, by Application 2020 & 2033
- Table 35: South Africa Electronic Grade Pgme Revenue (million) Forecast, by Application 2020 & 2033
- Table 36: Rest of Middle East & Africa Electronic Grade Pgme Revenue (million) Forecast, by Application 2020 & 2033
- Table 37: Global Electronic Grade Pgme Revenue million Forecast, by Application 2020 & 2033
- Table 38: Global Electronic Grade Pgme Revenue million Forecast, by Type 2020 & 2033
- Table 39: Global Electronic Grade Pgme Revenue million Forecast, by Country 2020 & 2033
- Table 40: China Electronic Grade Pgme Revenue (million) Forecast, by Application 2020 & 2033
- Table 41: India Electronic Grade Pgme Revenue (million) Forecast, by Application 2020 & 2033
- Table 42: Japan Electronic Grade Pgme Revenue (million) Forecast, by Application 2020 & 2033
- Table 43: South Korea Electronic Grade Pgme Revenue (million) Forecast, by Application 2020 & 2033
- Table 44: ASEAN Electronic Grade Pgme Revenue (million) Forecast, by Application 2020 & 2033
- Table 45: Oceania Electronic Grade Pgme Revenue (million) Forecast, by Application 2020 & 2033
- Table 46: Rest of Asia Pacific Electronic Grade Pgme Revenue (million) Forecast, by Application 2020 & 2033
Frequently Asked Questions
1. What is the projected Compound Annual Growth Rate (CAGR) of the Electronic Grade Pgme?
The projected CAGR is approximately 8.8%.
2. Which companies are prominent players in the Electronic Grade Pgme?
Key companies in the market include Daicel, Dow Inc, KH Neochem, Shiny Chemical Industrial, Chemtronics, Jiangsu Mingfeng Electronic Materials, Jiangsu Yida Chemical.
3. What are the main segments of the Electronic Grade Pgme?
The market segments include Application, Type.
4. Can you provide details about the market size?
The market size is estimated to be USD 689 million as of 2022.
5. What are some drivers contributing to market growth?
N/A
6. What are the notable trends driving market growth?
N/A
7. Are there any restraints impacting market growth?
N/A
8. Can you provide examples of recent developments in the market?
N/A
9. What pricing options are available for accessing the report?
Pricing options include single-user, multi-user, and enterprise licenses priced at USD 4900.00, USD 7350.00, and USD 9800.00 respectively.
10. Is the market size provided in terms of value or volume?
The market size is provided in terms of value, measured in million.
11. Are there any specific market keywords associated with the report?
Yes, the market keyword associated with the report is "Electronic Grade Pgme," which aids in identifying and referencing the specific market segment covered.
12. How do I determine which pricing option suits my needs best?
The pricing options vary based on user requirements and access needs. Individual users may opt for single-user licenses, while businesses requiring broader access may choose multi-user or enterprise licenses for cost-effective access to the report.
13. Are there any additional resources or data provided in the Electronic Grade Pgme report?
While the report offers comprehensive insights, it's advisable to review the specific contents or supplementary materials provided to ascertain if additional resources or data are available.
14. How can I stay updated on further developments or reports in the Electronic Grade Pgme?
To stay informed about further developments, trends, and reports in the Electronic Grade Pgme, consider subscribing to industry newsletters, following relevant companies and organizations, or regularly checking reputable industry news sources and publications.
Methodology
Step 1 - Identification of Relevant Samples Size from Population Database


Step 2 - Approaches for Defining Global Market Size (Value, Volume* & Price*)

Note*: In applicable scenarios
Step 3 - Data Sources
Primary Research
- Web Analytics
- Survey Reports
- Research Institute
- Latest Research Reports
- Opinion Leaders
Secondary Research
- Annual Reports
- White Paper
- Latest Press Release
- Industry Association
- Paid Database
- Investor Presentations

Step 4 - Data Triangulation
Involves using different sources of information in order to increase the validity of a study
These sources are likely to be stakeholders in a program - participants, other researchers, program staff, other community members, and so on.
Then we put all data in single framework & apply various statistical tools to find out the dynamic on the market.
During the analysis stage, feedback from the stakeholder groups would be compared to determine areas of agreement as well as areas of divergence