Key Insights
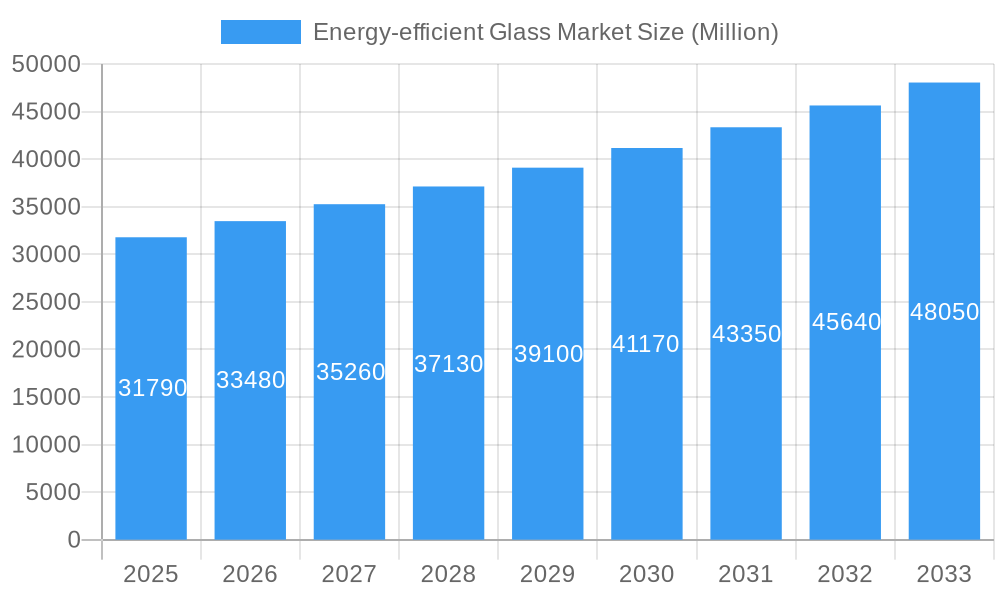
The energy-efficient glass market, valued at $31.79 billion in 2025, is projected to experience robust growth, exceeding a 5% CAGR from 2025 to 2033. This expansion is fueled by several key drivers. Increasing concerns about climate change and rising energy costs are prompting governments and consumers to adopt energy-saving technologies, making energy-efficient glass a highly sought-after building material. The construction industry, particularly in the residential and commercial sectors, is a major contributor to market growth, with the rising adoption of green building practices further accelerating demand. Technological advancements in glazing types, including the proliferation of triple-glazed windows and coatings that optimize insulation, are also significant drivers. Furthermore, the automotive and solar panel industries are increasingly incorporating energy-efficient glass to enhance their products' performance and reduce their environmental footprint. The market segmentation reveals significant opportunities across various coating types (hard and soft), glazing configurations (single, double, and triple), and end-user industries. Growth is anticipated to be particularly strong in regions like Asia Pacific, driven by rapid urbanization and infrastructure development in countries such as China and India.
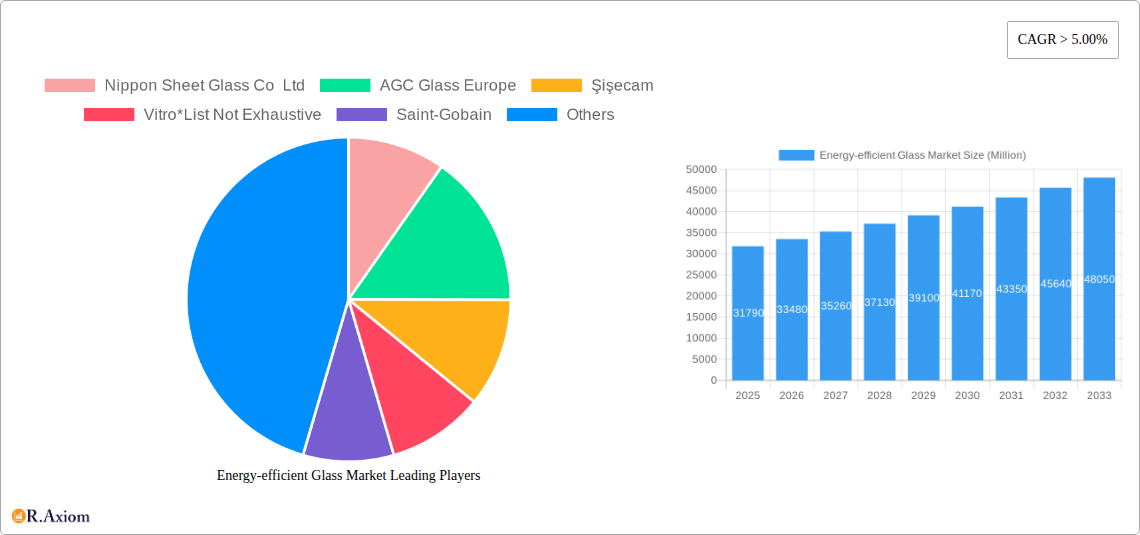
Energy-efficient Glass Market Market Size (In Billion)
Despite these positive trends, the market faces some challenges. Fluctuations in raw material prices, especially those of glass and coating materials, can impact profitability. Moreover, the high initial cost of energy-efficient glass compared to conventional glass might restrain widespread adoption, particularly in developing economies. However, the long-term cost savings associated with reduced energy consumption are expected to outweigh the initial investment, fueling market growth in the long run. Competitive pressures from established players like Nippon Sheet Glass, AGC Glass Europe, and Saint-Gobain are also present, necessitating continuous innovation and strategic positioning to secure market share. The market's future trajectory strongly depends on continued technological innovation, supportive government policies, and increasing consumer awareness of the long-term benefits of energy efficiency.
Energy-efficient Glass Market Company Market Share
Energy-Efficient Glass Market: A Comprehensive Report (2019-2033)
This in-depth report provides a comprehensive analysis of the energy-efficient glass market, covering market size, segmentation, key players, growth drivers, challenges, and future opportunities. The study period spans from 2019 to 2033, with 2025 serving as the base and estimated year. The report leverages extensive data analysis and industry insights to deliver actionable intelligence for stakeholders across the value chain.
Energy-efficient Glass Market Concentration & Innovation
The energy-efficient glass market exhibits a moderately concentrated landscape, with several major players commanding significant market share. Nippon Sheet Glass Co Ltd, AGC Glass Europe, Şişecam, Vitro, Saint-Gobain, and other key players compete fiercely, driving innovation and shaping market dynamics. Market share data for 2024 indicates that the top 5 players hold approximately xx% of the global market, while the remaining share is distributed among numerous smaller regional and specialized manufacturers. The average M&A deal value in the sector from 2019-2024 was approximately $xx Million, reflecting consolidation trends and strategic investments.
- Innovation Drivers: Stringent energy efficiency regulations, growing awareness of sustainable building practices, and advancements in coating technologies are major drivers of innovation. The development of self-cleaning, electrochromic, and other advanced glass types are reshaping the market landscape.
- Regulatory Frameworks: Government policies promoting energy conservation and sustainable construction play a crucial role in shaping market growth. Building codes and energy efficiency standards in various regions significantly influence product demand and adoption.
- Product Substitutes: While energy-efficient glass enjoys a competitive advantage, alternatives like advanced window films and insulated panels pose a degree of competition, particularly in cost-sensitive applications.
- End-User Trends: A shift towards eco-conscious construction, increasing demand for energy-efficient buildings, and the adoption of smart technologies in the building and automotive sectors are significantly impacting market demand.
- M&A Activities: Consolidation through mergers and acquisitions is a recurring trend, with larger players strategically acquiring smaller companies to expand their product portfolios, geographic reach, and technological capabilities.
Energy-efficient Glass Market Industry Trends & Insights
The energy-efficient glass market is experiencing robust growth, driven by several key factors. The global market size reached $xx Million in 2024 and is projected to reach $xx Million by 2033, exhibiting a Compound Annual Growth Rate (CAGR) of xx% during the forecast period (2025-2033). Market penetration of energy-efficient glass in new constructions is increasing steadily, especially in developed regions. Technological advancements such as improved Low-E coatings and the integration of smart features are propelling market growth. Consumer preferences are shifting towards sustainable and energy-efficient solutions, further boosting demand. However, price fluctuations in raw materials and the competitive landscape pose challenges to sustained high growth rates. The increasing integration of energy-efficient glass in the automotive and solar energy sectors is also contributing to market expansion.
Dominant Markets & Segments in Energy-efficient Glass Market
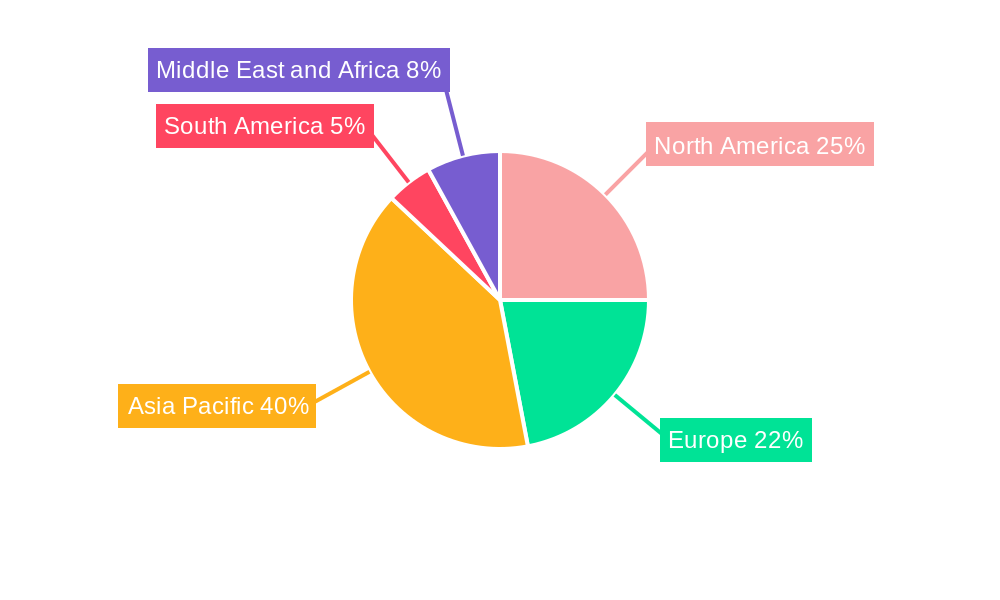
The building and construction sector remains the dominant end-user industry for energy-efficient glass, accounting for approximately xx% of the total market in 2024. This sector is primarily driven by increasing construction activity, especially in emerging economies. The double glazing segment holds a substantial share within the glazing type segment, owing to its cost-effectiveness and relatively high energy-saving capabilities. Within coating types, Low-E (Low-emissivity) coatings are the most prevalent, followed by hard coatings for enhanced durability. Geographically, North America and Europe are leading markets due to stringent building codes and high awareness of energy efficiency. Asia-Pacific is experiencing rapid growth, driven by increasing urbanization and infrastructure development.
Key Drivers for Building and Construction Segment:
- Stringent building codes and energy efficiency regulations.
- Growing focus on green building certifications (LEED, BREEAM).
- Rising construction activity in both developed and developing economies.
- Increasing demand for energy-efficient and comfortable buildings.
Dominance Analysis: The dominance of the building and construction sector stems from its substantial size and the direct correlation between energy-efficient glass and reduced energy consumption in buildings. The popularity of double glazing reflects a balance between cost and performance, while the widespread use of Low-E coatings underscores their proven effectiveness in reducing heat transfer. The regional dominance of North America and Europe is attributable to advanced building technologies and stringent regulations, while the rapid growth in Asia-Pacific reflects significant ongoing construction.
Energy-efficient Glass Market Product Developments
Recent innovations in energy-efficient glass focus on enhancing performance, durability, and functionality. Products with self-cleaning properties, integrated solar control technologies, and improved insulation capabilities are gaining traction. Manufacturers are actively developing advanced coatings to optimize solar heat gain control, reduce thermal transmittance, and improve sound insulation. These developments cater to the growing demand for sustainable, comfortable, and energy-efficient buildings and vehicles.
Report Scope & Segmentation Analysis
This comprehensive report meticulously segments the dynamic energy-efficient glass market. Our analysis is structured around key categories including coating type (differentiating between durable hard coatings and advanced soft coatings), glazing type (exploring the performance benefits of single, double, and triple glazing configurations), and the diverse end-user industries (with a deep dive into building and construction, automotive applications, solar panel manufacturing, and other niche sectors). For each identified segment, we provide an in-depth quantitative analysis, encompassing current market size, robust growth projections, and a thorough examination of the competitive dynamics. We anticipate particularly robust growth trajectories for double glazing and advanced Low-E (low-emissivity) coatings, reflecting their superior performance and energy-saving capabilities. The competitive landscape is a vibrant ecosystem, featuring established global giants alongside agile, specialized manufacturers. Market share distribution is observed to vary significantly across different segments and geographical regions, underscoring the localized nature of certain market strengths.
Key Drivers of Energy-efficient Glass Market Growth
The burgeoning expansion of the energy-efficient glass market is intrinsically linked to a confluence of powerful and persistent drivers:
- Stringent and Evolving Energy Efficiency Regulations: A primary catalyst is the relentless enforcement and continuous tightening of government mandates and building codes globally. These regulations are specifically designed to drive significant energy conservation efforts across residential, commercial, and industrial buildings, as well as within the automotive sector, compelling the adoption of more energy-efficient materials.
- Escalating Global Energy Costs: The persistent upward trend in electricity, gas, and fuel prices directly incentivizes consumers and businesses alike to invest in energy-saving solutions. Energy-efficient glass offers a tangible and cost-effective means to reduce heating, ventilation, and air conditioning (HVAC) loads, leading to substantial long-term operational cost savings.
- Heightened Environmental Consciousness and Sustainability Imperatives: A growing global awareness of climate change and the imperative for sustainable practices is reshaping consumer preferences and corporate responsibility. This surge in environmental consciousness translates into increased demand for green building materials and products that minimize a building's carbon footprint.
- Pioneering Technological Advancements and Innovations: The market is continuously fueled by ongoing research and development, leading to groundbreaking advancements in coating technologies. These innovations not only enhance the thermal performance and solar control properties of glass but also introduce new functionalities and improve the overall durability and longevity of the products.
Challenges in the Energy-efficient Glass Market Sector
The energy-efficient glass market faces certain challenges:
- Fluctuations in raw material prices: Price volatility can impact production costs and profitability.
- Intense competition: The market is characterized by strong competition among established players.
- Supply chain disruptions: Global events can disrupt the supply of raw materials and components.
- High initial investment costs: The higher upfront cost of energy-efficient glass can deter some customers.
Emerging Opportunities in Energy-efficient Glass Market
The horizon for the energy-efficient glass market is bright with a spectrum of exciting and transformative emerging opportunities:
- Seamless Integration of Smart Glass Technologies: The next frontier involves the sophisticated integration of smart features, enabling dynamic control over light transmission, heat gain, and glare. This allows buildings and vehicles to adapt automatically to changing environmental conditions, optimizing occupant comfort and energy usage.
- Advancements in Electrochromic and Thermochromic Glass: Significant potential lies in the further development and widespread adoption of electrochromic (electronically tintable) and thermochromic (heat-activated tinting) glass. These technologies offer unprecedented control over transparency and light, allowing for on-demand adjustment of solar heat gain and visual comfort.
- Strategic Expansion into Emerging and Developing Economies: As developing economies experience rapid urbanization and increased construction activity, there is a substantial untapped market potential. Addressing the growing demand for modern, sustainable infrastructure in these regions presents a significant growth avenue.
- Development and Commercialization of Novel, High-Performance Coatings: Continuous innovation in coating formulations is paramount. Opportunities exist in developing next-generation coatings that offer enhanced thermal insulation, superior UV protection, self-cleaning properties, and improved durability, all while maintaining aesthetic appeal.
- Focus on Renewable Energy Integration: The increasing reliance on solar energy presents opportunities for specialized energy-efficient glass solutions tailored for photovoltaic (PV) panels and solar thermal systems, optimizing energy capture and system efficiency.
Leading Players in the Energy-efficient Glass Market Market
- Nippon Sheet Glass Co Ltd
- AGC Glass Europe
- Şişecam
- Vitro
- Saint-Gobain
- Morley Glass & Glazing Ltd
- Tuffx Glass
- Cardinal Glass Industries Inc
- Abrisa Technologies
- SCHOTT AG
- Guardian Industries Holdings
- Central Glass Co Ltd
Key Developments in Energy-efficient Glass Market Industry
August 2022: NSG Group announced its expansion plan for TCO (transparent conductive oxide) coated glass production in Malaysia, significantly increasing capacity for solar panel manufacturers by late 2024. This expansion demonstrates a clear focus on the growing renewable energy sector and indicates significant future growth in this area.
May 2022: AGC Inc.'s development and implementation of a light-control panoramic roof glass with Low-E coating in the Lexus RZ demonstrates the growing integration of energy-efficient glass into the automotive industry, particularly in electric vehicles where weight reduction and thermal comfort are crucial factors. This highlights a shift towards advanced functionalities and broader applications beyond traditional construction.
Strategic Outlook for Energy-efficient Glass Market Market
The energy-efficient glass market is poised for continued growth, driven by increasing demand for sustainable building materials and technological advancements. Government regulations promoting energy efficiency and the rising awareness of climate change will further accelerate market expansion. Focus on innovation and the development of advanced products with enhanced functionalities will be crucial for success in this competitive market. Companies are expected to prioritize strategic partnerships and M&A activities to expand their market presence and technological capabilities. The integration of smart technologies and the penetration into emerging markets will present significant opportunities for growth in the coming years.
Energy-efficient Glass Market Segmentation
-
1. Coating Type
- 1.1. Hard
- 1.2. Soft
-
2. Glazing Type
- 2.1. Single
- 2.2. Double
- 2.3. Triple
-
3. End-user Industry
- 3.1. Building and Construction
- 3.2. Automotive
- 3.3. Solar Panel
- 3.4. Other End-user Industries (Industrial, etc.)
Energy-efficient Glass Market Segmentation By Geography
-
1. Asia Pacific
- 1.1. China
- 1.2. India
- 1.3. Japan
- 1.4. South Korea
- 1.5. Rest of Asia Pacific
-
2. North America
- 2.1. United States
- 2.2. Canada
- 2.3. Mexico
-
3. Europe
- 3.1. Germany
- 3.2. United Kingdom
- 3.3. France
- 3.4. Italy
- 3.5. Rest of Europe
-
4. South America
- 4.1. Brazil
- 4.2. Argentina
- 4.3. Rest of South America
-
5. Middle East and Africa
- 5.1. Saudi Arabia
- 5.2. South Africa
- 5.3. Rest of Middle East and Africa
Energy-efficient Glass Market Regional Market Share
Geographic Coverage of Energy-efficient Glass Market
Energy-efficient Glass Market REPORT HIGHLIGHTS
| Aspects | Details |
|---|---|
| Study Period | 2020-2034 |
| Base Year | 2025 |
| Estimated Year | 2026 |
| Forecast Period | 2026-2034 |
| Historical Period | 2020-2025 |
| Growth Rate | CAGR of > 5.00% from 2020-2034 |
| Segmentation |
|
Table of Contents
- 1. Introduction
- 1.1. Research Scope
- 1.2. Market Segmentation
- 1.3. Research Objective
- 1.4. Definitions and Assumptions
- 2. Executive Summary
- 2.1. Market Snapshot
- 3. Market Dynamics
- 3.1. Market Drivers
- 3.2. Market Restrains
- 3.3. Market Trends
- 3.4. Market Opportunities
- 4. Market Factor Analysis
- 4.1. Porters Five Forces
- 4.1.1. Bargaining Power of Suppliers
- 4.1.2. Bargaining Power of Buyers
- 4.1.3. Threat of New Entrants
- 4.1.4. Threat of Substitutes
- 4.1.5. Competitive Rivalry
- 4.2. PESTEL analysis
- 4.3. BCG Analysis
- 4.3.1. Stars (High Growth, High Market Share)
- 4.3.2. Cash Cows (Low Growth, High Market Share)
- 4.3.3. Question Mark (High Growth, Low Market Share)
- 4.3.4. Dogs (Low Growth, Low Market Share)
- 4.4. Ansoff Matrix Analysis
- 4.5. Supply Chain Analysis
- 4.6. Regulatory Landscape
- 4.7. Current Market Potential and Opportunity Assessment (TAM–SAM–SOM Framework)
- 4.8. RAX Analyst Note
- 4.1. Porters Five Forces
- 5. Market Analysis, Insights and Forecast 2021-2033
- 5.1. Market Analysis, Insights and Forecast - by Coating Type
- 5.1.1. Hard
- 5.1.2. Soft
- 5.2. Market Analysis, Insights and Forecast - by Glazing Type
- 5.2.1. Single
- 5.2.2. Double
- 5.2.3. Triple
- 5.3. Market Analysis, Insights and Forecast - by End-user Industry
- 5.3.1. Building and Construction
- 5.3.2. Automotive
- 5.3.3. Solar Panel
- 5.3.4. Other End-user Industries (Industrial, etc.)
- 5.4. Market Analysis, Insights and Forecast - by Region
- 5.4.1. Asia Pacific
- 5.4.2. North America
- 5.4.3. Europe
- 5.4.4. South America
- 5.4.5. Middle East and Africa
- 5.1. Market Analysis, Insights and Forecast - by Coating Type
- 6. Global Energy-efficient Glass Market Analysis, Insights and Forecast, 2021-2033
- 6.1. Market Analysis, Insights and Forecast - by Coating Type
- 6.1.1. Hard
- 6.1.2. Soft
- 6.2. Market Analysis, Insights and Forecast - by Glazing Type
- 6.2.1. Single
- 6.2.2. Double
- 6.2.3. Triple
- 6.3. Market Analysis, Insights and Forecast - by End-user Industry
- 6.3.1. Building and Construction
- 6.3.2. Automotive
- 6.3.3. Solar Panel
- 6.3.4. Other End-user Industries (Industrial, etc.)
- 6.1. Market Analysis, Insights and Forecast - by Coating Type
- 7. Asia Pacific Energy-efficient Glass Market Analysis, Insights and Forecast, 2020-2032
- 7.1. Market Analysis, Insights and Forecast - by Coating Type
- 7.1.1. Hard
- 7.1.2. Soft
- 7.2. Market Analysis, Insights and Forecast - by Glazing Type
- 7.2.1. Single
- 7.2.2. Double
- 7.2.3. Triple
- 7.3. Market Analysis, Insights and Forecast - by End-user Industry
- 7.3.1. Building and Construction
- 7.3.2. Automotive
- 7.3.3. Solar Panel
- 7.3.4. Other End-user Industries (Industrial, etc.)
- 7.1. Market Analysis, Insights and Forecast - by Coating Type
- 8. North America Energy-efficient Glass Market Analysis, Insights and Forecast, 2020-2032
- 8.1. Market Analysis, Insights and Forecast - by Coating Type
- 8.1.1. Hard
- 8.1.2. Soft
- 8.2. Market Analysis, Insights and Forecast - by Glazing Type
- 8.2.1. Single
- 8.2.2. Double
- 8.2.3. Triple
- 8.3. Market Analysis, Insights and Forecast - by End-user Industry
- 8.3.1. Building and Construction
- 8.3.2. Automotive
- 8.3.3. Solar Panel
- 8.3.4. Other End-user Industries (Industrial, etc.)
- 8.1. Market Analysis, Insights and Forecast - by Coating Type
- 9. Europe Energy-efficient Glass Market Analysis, Insights and Forecast, 2020-2032
- 9.1. Market Analysis, Insights and Forecast - by Coating Type
- 9.1.1. Hard
- 9.1.2. Soft
- 9.2. Market Analysis, Insights and Forecast - by Glazing Type
- 9.2.1. Single
- 9.2.2. Double
- 9.2.3. Triple
- 9.3. Market Analysis, Insights and Forecast - by End-user Industry
- 9.3.1. Building and Construction
- 9.3.2. Automotive
- 9.3.3. Solar Panel
- 9.3.4. Other End-user Industries (Industrial, etc.)
- 9.1. Market Analysis, Insights and Forecast - by Coating Type
- 10. South America Energy-efficient Glass Market Analysis, Insights and Forecast, 2020-2032
- 10.1. Market Analysis, Insights and Forecast - by Coating Type
- 10.1.1. Hard
- 10.1.2. Soft
- 10.2. Market Analysis, Insights and Forecast - by Glazing Type
- 10.2.1. Single
- 10.2.2. Double
- 10.2.3. Triple
- 10.3. Market Analysis, Insights and Forecast - by End-user Industry
- 10.3.1. Building and Construction
- 10.3.2. Automotive
- 10.3.3. Solar Panel
- 10.3.4. Other End-user Industries (Industrial, etc.)
- 10.1. Market Analysis, Insights and Forecast - by Coating Type
- 11. Middle East and Africa Energy-efficient Glass Market Analysis, Insights and Forecast, 2020-2032
- 11.1. Market Analysis, Insights and Forecast - by Coating Type
- 11.1.1. Hard
- 11.1.2. Soft
- 11.2. Market Analysis, Insights and Forecast - by Glazing Type
- 11.2.1. Single
- 11.2.2. Double
- 11.2.3. Triple
- 11.3. Market Analysis, Insights and Forecast - by End-user Industry
- 11.3.1. Building and Construction
- 11.3.2. Automotive
- 11.3.3. Solar Panel
- 11.3.4. Other End-user Industries (Industrial, etc.)
- 11.1. Market Analysis, Insights and Forecast - by Coating Type
- 12. Competitive Analysis
- 12.1. Company Profiles
- 12.1.1 Nippon Sheet Glass Co Ltd
- 12.1.1.1. Company Overview
- 12.1.1.2. Products
- 12.1.1.3. Company Financials
- 12.1.1.4. SWOT Analysis
- 12.1.2 AGC Glass Europe
- 12.1.2.1. Company Overview
- 12.1.2.2. Products
- 12.1.2.3. Company Financials
- 12.1.2.4. SWOT Analysis
- 12.1.3 Şişecam
- 12.1.3.1. Company Overview
- 12.1.3.2. Products
- 12.1.3.3. Company Financials
- 12.1.3.4. SWOT Analysis
- 12.1.4 Vitro*List Not Exhaustive
- 12.1.4.1. Company Overview
- 12.1.4.2. Products
- 12.1.4.3. Company Financials
- 12.1.4.4. SWOT Analysis
- 12.1.5 Saint-Gobain
- 12.1.5.1. Company Overview
- 12.1.5.2. Products
- 12.1.5.3. Company Financials
- 12.1.5.4. SWOT Analysis
- 12.1.6 Morley Glass & Glazing Ltd
- 12.1.6.1. Company Overview
- 12.1.6.2. Products
- 12.1.6.3. Company Financials
- 12.1.6.4. SWOT Analysis
- 12.1.7 Tuffx Glass
- 12.1.7.1. Company Overview
- 12.1.7.2. Products
- 12.1.7.3. Company Financials
- 12.1.7.4. SWOT Analysis
- 12.1.8 Cardinal Glass Industries Inc
- 12.1.8.1. Company Overview
- 12.1.8.2. Products
- 12.1.8.3. Company Financials
- 12.1.8.4. SWOT Analysis
- 12.1.9 Abrisa Technologies
- 12.1.9.1. Company Overview
- 12.1.9.2. Products
- 12.1.9.3. Company Financials
- 12.1.9.4. SWOT Analysis
- 12.1.10 SCHOTT AG
- 12.1.10.1. Company Overview
- 12.1.10.2. Products
- 12.1.10.3. Company Financials
- 12.1.10.4. SWOT Analysis
- 12.1.11 Guardian Industries Holdings
- 12.1.11.1. Company Overview
- 12.1.11.2. Products
- 12.1.11.3. Company Financials
- 12.1.11.4. SWOT Analysis
- 12.1.12 Central Glass Co Ltd
- 12.1.12.1. Company Overview
- 12.1.12.2. Products
- 12.1.12.3. Company Financials
- 12.1.12.4. SWOT Analysis
- 12.1.1 Nippon Sheet Glass Co Ltd
- 12.2. Market Entropy
- 12.2.1 Company's Key Areas Served
- 12.2.2 Recent Developments
- 12.3. Company Market Share Analysis 2025
- 12.3.1 Top 5 Companies Market Share Analysis
- 12.3.2 Top 3 Companies Market Share Analysis
- 12.4. List of Potential Customers
- 13. Research Methodology
List of Figures
- Figure 1: Global Energy-efficient Glass Market Revenue Breakdown (Million, %) by Region 2025 & 2033
- Figure 2: Global Energy-efficient Glass Market Volume Breakdown (Kiloton, %) by Region 2025 & 2033
- Figure 3: Asia Pacific Energy-efficient Glass Market Revenue (Million), by Coating Type 2025 & 2033
- Figure 4: Asia Pacific Energy-efficient Glass Market Volume (Kiloton), by Coating Type 2025 & 2033
- Figure 5: Asia Pacific Energy-efficient Glass Market Revenue Share (%), by Coating Type 2025 & 2033
- Figure 6: Asia Pacific Energy-efficient Glass Market Volume Share (%), by Coating Type 2025 & 2033
- Figure 7: Asia Pacific Energy-efficient Glass Market Revenue (Million), by Glazing Type 2025 & 2033
- Figure 8: Asia Pacific Energy-efficient Glass Market Volume (Kiloton), by Glazing Type 2025 & 2033
- Figure 9: Asia Pacific Energy-efficient Glass Market Revenue Share (%), by Glazing Type 2025 & 2033
- Figure 10: Asia Pacific Energy-efficient Glass Market Volume Share (%), by Glazing Type 2025 & 2033
- Figure 11: Asia Pacific Energy-efficient Glass Market Revenue (Million), by End-user Industry 2025 & 2033
- Figure 12: Asia Pacific Energy-efficient Glass Market Volume (Kiloton), by End-user Industry 2025 & 2033
- Figure 13: Asia Pacific Energy-efficient Glass Market Revenue Share (%), by End-user Industry 2025 & 2033
- Figure 14: Asia Pacific Energy-efficient Glass Market Volume Share (%), by End-user Industry 2025 & 2033
- Figure 15: Asia Pacific Energy-efficient Glass Market Revenue (Million), by Country 2025 & 2033
- Figure 16: Asia Pacific Energy-efficient Glass Market Volume (Kiloton), by Country 2025 & 2033
- Figure 17: Asia Pacific Energy-efficient Glass Market Revenue Share (%), by Country 2025 & 2033
- Figure 18: Asia Pacific Energy-efficient Glass Market Volume Share (%), by Country 2025 & 2033
- Figure 19: North America Energy-efficient Glass Market Revenue (Million), by Coating Type 2025 & 2033
- Figure 20: North America Energy-efficient Glass Market Volume (Kiloton), by Coating Type 2025 & 2033
- Figure 21: North America Energy-efficient Glass Market Revenue Share (%), by Coating Type 2025 & 2033
- Figure 22: North America Energy-efficient Glass Market Volume Share (%), by Coating Type 2025 & 2033
- Figure 23: North America Energy-efficient Glass Market Revenue (Million), by Glazing Type 2025 & 2033
- Figure 24: North America Energy-efficient Glass Market Volume (Kiloton), by Glazing Type 2025 & 2033
- Figure 25: North America Energy-efficient Glass Market Revenue Share (%), by Glazing Type 2025 & 2033
- Figure 26: North America Energy-efficient Glass Market Volume Share (%), by Glazing Type 2025 & 2033
- Figure 27: North America Energy-efficient Glass Market Revenue (Million), by End-user Industry 2025 & 2033
- Figure 28: North America Energy-efficient Glass Market Volume (Kiloton), by End-user Industry 2025 & 2033
- Figure 29: North America Energy-efficient Glass Market Revenue Share (%), by End-user Industry 2025 & 2033
- Figure 30: North America Energy-efficient Glass Market Volume Share (%), by End-user Industry 2025 & 2033
- Figure 31: North America Energy-efficient Glass Market Revenue (Million), by Country 2025 & 2033
- Figure 32: North America Energy-efficient Glass Market Volume (Kiloton), by Country 2025 & 2033
- Figure 33: North America Energy-efficient Glass Market Revenue Share (%), by Country 2025 & 2033
- Figure 34: North America Energy-efficient Glass Market Volume Share (%), by Country 2025 & 2033
- Figure 35: Europe Energy-efficient Glass Market Revenue (Million), by Coating Type 2025 & 2033
- Figure 36: Europe Energy-efficient Glass Market Volume (Kiloton), by Coating Type 2025 & 2033
- Figure 37: Europe Energy-efficient Glass Market Revenue Share (%), by Coating Type 2025 & 2033
- Figure 38: Europe Energy-efficient Glass Market Volume Share (%), by Coating Type 2025 & 2033
- Figure 39: Europe Energy-efficient Glass Market Revenue (Million), by Glazing Type 2025 & 2033
- Figure 40: Europe Energy-efficient Glass Market Volume (Kiloton), by Glazing Type 2025 & 2033
- Figure 41: Europe Energy-efficient Glass Market Revenue Share (%), by Glazing Type 2025 & 2033
- Figure 42: Europe Energy-efficient Glass Market Volume Share (%), by Glazing Type 2025 & 2033
- Figure 43: Europe Energy-efficient Glass Market Revenue (Million), by End-user Industry 2025 & 2033
- Figure 44: Europe Energy-efficient Glass Market Volume (Kiloton), by End-user Industry 2025 & 2033
- Figure 45: Europe Energy-efficient Glass Market Revenue Share (%), by End-user Industry 2025 & 2033
- Figure 46: Europe Energy-efficient Glass Market Volume Share (%), by End-user Industry 2025 & 2033
- Figure 47: Europe Energy-efficient Glass Market Revenue (Million), by Country 2025 & 2033
- Figure 48: Europe Energy-efficient Glass Market Volume (Kiloton), by Country 2025 & 2033
- Figure 49: Europe Energy-efficient Glass Market Revenue Share (%), by Country 2025 & 2033
- Figure 50: Europe Energy-efficient Glass Market Volume Share (%), by Country 2025 & 2033
- Figure 51: South America Energy-efficient Glass Market Revenue (Million), by Coating Type 2025 & 2033
- Figure 52: South America Energy-efficient Glass Market Volume (Kiloton), by Coating Type 2025 & 2033
- Figure 53: South America Energy-efficient Glass Market Revenue Share (%), by Coating Type 2025 & 2033
- Figure 54: South America Energy-efficient Glass Market Volume Share (%), by Coating Type 2025 & 2033
- Figure 55: South America Energy-efficient Glass Market Revenue (Million), by Glazing Type 2025 & 2033
- Figure 56: South America Energy-efficient Glass Market Volume (Kiloton), by Glazing Type 2025 & 2033
- Figure 57: South America Energy-efficient Glass Market Revenue Share (%), by Glazing Type 2025 & 2033
- Figure 58: South America Energy-efficient Glass Market Volume Share (%), by Glazing Type 2025 & 2033
- Figure 59: South America Energy-efficient Glass Market Revenue (Million), by End-user Industry 2025 & 2033
- Figure 60: South America Energy-efficient Glass Market Volume (Kiloton), by End-user Industry 2025 & 2033
- Figure 61: South America Energy-efficient Glass Market Revenue Share (%), by End-user Industry 2025 & 2033
- Figure 62: South America Energy-efficient Glass Market Volume Share (%), by End-user Industry 2025 & 2033
- Figure 63: South America Energy-efficient Glass Market Revenue (Million), by Country 2025 & 2033
- Figure 64: South America Energy-efficient Glass Market Volume (Kiloton), by Country 2025 & 2033
- Figure 65: South America Energy-efficient Glass Market Revenue Share (%), by Country 2025 & 2033
- Figure 66: South America Energy-efficient Glass Market Volume Share (%), by Country 2025 & 2033
- Figure 67: Middle East and Africa Energy-efficient Glass Market Revenue (Million), by Coating Type 2025 & 2033
- Figure 68: Middle East and Africa Energy-efficient Glass Market Volume (Kiloton), by Coating Type 2025 & 2033
- Figure 69: Middle East and Africa Energy-efficient Glass Market Revenue Share (%), by Coating Type 2025 & 2033
- Figure 70: Middle East and Africa Energy-efficient Glass Market Volume Share (%), by Coating Type 2025 & 2033
- Figure 71: Middle East and Africa Energy-efficient Glass Market Revenue (Million), by Glazing Type 2025 & 2033
- Figure 72: Middle East and Africa Energy-efficient Glass Market Volume (Kiloton), by Glazing Type 2025 & 2033
- Figure 73: Middle East and Africa Energy-efficient Glass Market Revenue Share (%), by Glazing Type 2025 & 2033
- Figure 74: Middle East and Africa Energy-efficient Glass Market Volume Share (%), by Glazing Type 2025 & 2033
- Figure 75: Middle East and Africa Energy-efficient Glass Market Revenue (Million), by End-user Industry 2025 & 2033
- Figure 76: Middle East and Africa Energy-efficient Glass Market Volume (Kiloton), by End-user Industry 2025 & 2033
- Figure 77: Middle East and Africa Energy-efficient Glass Market Revenue Share (%), by End-user Industry 2025 & 2033
- Figure 78: Middle East and Africa Energy-efficient Glass Market Volume Share (%), by End-user Industry 2025 & 2033
- Figure 79: Middle East and Africa Energy-efficient Glass Market Revenue (Million), by Country 2025 & 2033
- Figure 80: Middle East and Africa Energy-efficient Glass Market Volume (Kiloton), by Country 2025 & 2033
- Figure 81: Middle East and Africa Energy-efficient Glass Market Revenue Share (%), by Country 2025 & 2033
- Figure 82: Middle East and Africa Energy-efficient Glass Market Volume Share (%), by Country 2025 & 2033
List of Tables
- Table 1: Global Energy-efficient Glass Market Revenue Million Forecast, by Coating Type 2020 & 2033
- Table 2: Global Energy-efficient Glass Market Volume Kiloton Forecast, by Coating Type 2020 & 2033
- Table 3: Global Energy-efficient Glass Market Revenue Million Forecast, by Glazing Type 2020 & 2033
- Table 4: Global Energy-efficient Glass Market Volume Kiloton Forecast, by Glazing Type 2020 & 2033
- Table 5: Global Energy-efficient Glass Market Revenue Million Forecast, by End-user Industry 2020 & 2033
- Table 6: Global Energy-efficient Glass Market Volume Kiloton Forecast, by End-user Industry 2020 & 2033
- Table 7: Global Energy-efficient Glass Market Revenue Million Forecast, by Region 2020 & 2033
- Table 8: Global Energy-efficient Glass Market Volume Kiloton Forecast, by Region 2020 & 2033
- Table 9: Global Energy-efficient Glass Market Revenue Million Forecast, by Coating Type 2020 & 2033
- Table 10: Global Energy-efficient Glass Market Volume Kiloton Forecast, by Coating Type 2020 & 2033
- Table 11: Global Energy-efficient Glass Market Revenue Million Forecast, by Glazing Type 2020 & 2033
- Table 12: Global Energy-efficient Glass Market Volume Kiloton Forecast, by Glazing Type 2020 & 2033
- Table 13: Global Energy-efficient Glass Market Revenue Million Forecast, by End-user Industry 2020 & 2033
- Table 14: Global Energy-efficient Glass Market Volume Kiloton Forecast, by End-user Industry 2020 & 2033
- Table 15: Global Energy-efficient Glass Market Revenue Million Forecast, by Country 2020 & 2033
- Table 16: Global Energy-efficient Glass Market Volume Kiloton Forecast, by Country 2020 & 2033
- Table 17: China Energy-efficient Glass Market Revenue (Million) Forecast, by Application 2020 & 2033
- Table 18: China Energy-efficient Glass Market Volume (Kiloton) Forecast, by Application 2020 & 2033
- Table 19: India Energy-efficient Glass Market Revenue (Million) Forecast, by Application 2020 & 2033
- Table 20: India Energy-efficient Glass Market Volume (Kiloton) Forecast, by Application 2020 & 2033
- Table 21: Japan Energy-efficient Glass Market Revenue (Million) Forecast, by Application 2020 & 2033
- Table 22: Japan Energy-efficient Glass Market Volume (Kiloton) Forecast, by Application 2020 & 2033
- Table 23: South Korea Energy-efficient Glass Market Revenue (Million) Forecast, by Application 2020 & 2033
- Table 24: South Korea Energy-efficient Glass Market Volume (Kiloton) Forecast, by Application 2020 & 2033
- Table 25: Rest of Asia Pacific Energy-efficient Glass Market Revenue (Million) Forecast, by Application 2020 & 2033
- Table 26: Rest of Asia Pacific Energy-efficient Glass Market Volume (Kiloton) Forecast, by Application 2020 & 2033
- Table 27: Global Energy-efficient Glass Market Revenue Million Forecast, by Coating Type 2020 & 2033
- Table 28: Global Energy-efficient Glass Market Volume Kiloton Forecast, by Coating Type 2020 & 2033
- Table 29: Global Energy-efficient Glass Market Revenue Million Forecast, by Glazing Type 2020 & 2033
- Table 30: Global Energy-efficient Glass Market Volume Kiloton Forecast, by Glazing Type 2020 & 2033
- Table 31: Global Energy-efficient Glass Market Revenue Million Forecast, by End-user Industry 2020 & 2033
- Table 32: Global Energy-efficient Glass Market Volume Kiloton Forecast, by End-user Industry 2020 & 2033
- Table 33: Global Energy-efficient Glass Market Revenue Million Forecast, by Country 2020 & 2033
- Table 34: Global Energy-efficient Glass Market Volume Kiloton Forecast, by Country 2020 & 2033
- Table 35: United States Energy-efficient Glass Market Revenue (Million) Forecast, by Application 2020 & 2033
- Table 36: United States Energy-efficient Glass Market Volume (Kiloton) Forecast, by Application 2020 & 2033
- Table 37: Canada Energy-efficient Glass Market Revenue (Million) Forecast, by Application 2020 & 2033
- Table 38: Canada Energy-efficient Glass Market Volume (Kiloton) Forecast, by Application 2020 & 2033
- Table 39: Mexico Energy-efficient Glass Market Revenue (Million) Forecast, by Application 2020 & 2033
- Table 40: Mexico Energy-efficient Glass Market Volume (Kiloton) Forecast, by Application 2020 & 2033
- Table 41: Global Energy-efficient Glass Market Revenue Million Forecast, by Coating Type 2020 & 2033
- Table 42: Global Energy-efficient Glass Market Volume Kiloton Forecast, by Coating Type 2020 & 2033
- Table 43: Global Energy-efficient Glass Market Revenue Million Forecast, by Glazing Type 2020 & 2033
- Table 44: Global Energy-efficient Glass Market Volume Kiloton Forecast, by Glazing Type 2020 & 2033
- Table 45: Global Energy-efficient Glass Market Revenue Million Forecast, by End-user Industry 2020 & 2033
- Table 46: Global Energy-efficient Glass Market Volume Kiloton Forecast, by End-user Industry 2020 & 2033
- Table 47: Global Energy-efficient Glass Market Revenue Million Forecast, by Country 2020 & 2033
- Table 48: Global Energy-efficient Glass Market Volume Kiloton Forecast, by Country 2020 & 2033
- Table 49: Germany Energy-efficient Glass Market Revenue (Million) Forecast, by Application 2020 & 2033
- Table 50: Germany Energy-efficient Glass Market Volume (Kiloton) Forecast, by Application 2020 & 2033
- Table 51: United Kingdom Energy-efficient Glass Market Revenue (Million) Forecast, by Application 2020 & 2033
- Table 52: United Kingdom Energy-efficient Glass Market Volume (Kiloton) Forecast, by Application 2020 & 2033
- Table 53: France Energy-efficient Glass Market Revenue (Million) Forecast, by Application 2020 & 2033
- Table 54: France Energy-efficient Glass Market Volume (Kiloton) Forecast, by Application 2020 & 2033
- Table 55: Italy Energy-efficient Glass Market Revenue (Million) Forecast, by Application 2020 & 2033
- Table 56: Italy Energy-efficient Glass Market Volume (Kiloton) Forecast, by Application 2020 & 2033
- Table 57: Rest of Europe Energy-efficient Glass Market Revenue (Million) Forecast, by Application 2020 & 2033
- Table 58: Rest of Europe Energy-efficient Glass Market Volume (Kiloton) Forecast, by Application 2020 & 2033
- Table 59: Global Energy-efficient Glass Market Revenue Million Forecast, by Coating Type 2020 & 2033
- Table 60: Global Energy-efficient Glass Market Volume Kiloton Forecast, by Coating Type 2020 & 2033
- Table 61: Global Energy-efficient Glass Market Revenue Million Forecast, by Glazing Type 2020 & 2033
- Table 62: Global Energy-efficient Glass Market Volume Kiloton Forecast, by Glazing Type 2020 & 2033
- Table 63: Global Energy-efficient Glass Market Revenue Million Forecast, by End-user Industry 2020 & 2033
- Table 64: Global Energy-efficient Glass Market Volume Kiloton Forecast, by End-user Industry 2020 & 2033
- Table 65: Global Energy-efficient Glass Market Revenue Million Forecast, by Country 2020 & 2033
- Table 66: Global Energy-efficient Glass Market Volume Kiloton Forecast, by Country 2020 & 2033
- Table 67: Brazil Energy-efficient Glass Market Revenue (Million) Forecast, by Application 2020 & 2033
- Table 68: Brazil Energy-efficient Glass Market Volume (Kiloton) Forecast, by Application 2020 & 2033
- Table 69: Argentina Energy-efficient Glass Market Revenue (Million) Forecast, by Application 2020 & 2033
- Table 70: Argentina Energy-efficient Glass Market Volume (Kiloton) Forecast, by Application 2020 & 2033
- Table 71: Rest of South America Energy-efficient Glass Market Revenue (Million) Forecast, by Application 2020 & 2033
- Table 72: Rest of South America Energy-efficient Glass Market Volume (Kiloton) Forecast, by Application 2020 & 2033
- Table 73: Global Energy-efficient Glass Market Revenue Million Forecast, by Coating Type 2020 & 2033
- Table 74: Global Energy-efficient Glass Market Volume Kiloton Forecast, by Coating Type 2020 & 2033
- Table 75: Global Energy-efficient Glass Market Revenue Million Forecast, by Glazing Type 2020 & 2033
- Table 76: Global Energy-efficient Glass Market Volume Kiloton Forecast, by Glazing Type 2020 & 2033
- Table 77: Global Energy-efficient Glass Market Revenue Million Forecast, by End-user Industry 2020 & 2033
- Table 78: Global Energy-efficient Glass Market Volume Kiloton Forecast, by End-user Industry 2020 & 2033
- Table 79: Global Energy-efficient Glass Market Revenue Million Forecast, by Country 2020 & 2033
- Table 80: Global Energy-efficient Glass Market Volume Kiloton Forecast, by Country 2020 & 2033
- Table 81: Saudi Arabia Energy-efficient Glass Market Revenue (Million) Forecast, by Application 2020 & 2033
- Table 82: Saudi Arabia Energy-efficient Glass Market Volume (Kiloton) Forecast, by Application 2020 & 2033
- Table 83: South Africa Energy-efficient Glass Market Revenue (Million) Forecast, by Application 2020 & 2033
- Table 84: South Africa Energy-efficient Glass Market Volume (Kiloton) Forecast, by Application 2020 & 2033
- Table 85: Rest of Middle East and Africa Energy-efficient Glass Market Revenue (Million) Forecast, by Application 2020 & 2033
- Table 86: Rest of Middle East and Africa Energy-efficient Glass Market Volume (Kiloton) Forecast, by Application 2020 & 2033
Frequently Asked Questions
1. What is the projected Compound Annual Growth Rate (CAGR) of the Energy-efficient Glass Market?
The projected CAGR is approximately > 5.00%.
2. Which companies are prominent players in the Energy-efficient Glass Market?
Key companies in the market include Nippon Sheet Glass Co Ltd, AGC Glass Europe, Şişecam, Vitro*List Not Exhaustive, Saint-Gobain, Morley Glass & Glazing Ltd, Tuffx Glass, Cardinal Glass Industries Inc, Abrisa Technologies, SCHOTT AG, Guardian Industries Holdings, Central Glass Co Ltd.
3. What are the main segments of the Energy-efficient Glass Market?
The market segments include Coating Type, Glazing Type, End-user Industry.
4. Can you provide details about the market size?
The market size is estimated to be USD 31.79 Million as of 2022.
5. What are some drivers contributing to market growth?
Increasing Application in the Building and Construction Sector; Growing Concern about High Carbon Emissions; Other Drivers.
6. What are the notable trends driving market growth?
Growing Demand from the Building and Construction Sector.
7. Are there any restraints impacting market growth?
High Price Bar of Energy-efficient Glass; Other Restraints.
8. Can you provide examples of recent developments in the market?
August 2022: NSG Group unveiled its expansion plan for TCO (transparent conductive oxide) coated glass production in Malaysia. The initiative involves the installation of a new float line at the Johor Bahru facility of Malaysian Sheet Glass SDN BHD, a member of the NSG Group. This expansion will incorporate online coating capacity and is set to commence TCO glass production for solar panel manufacturers by the close of 2024.
9. What pricing options are available for accessing the report?
Pricing options include single-user, multi-user, and enterprise licenses priced at USD 4750, USD 5250, and USD 8750 respectively.
10. Is the market size provided in terms of value or volume?
The market size is provided in terms of value, measured in Million and volume, measured in Kiloton.
11. Are there any specific market keywords associated with the report?
Yes, the market keyword associated with the report is "Energy-efficient Glass Market," which aids in identifying and referencing the specific market segment covered.
12. How do I determine which pricing option suits my needs best?
The pricing options vary based on user requirements and access needs. Individual users may opt for single-user licenses, while businesses requiring broader access may choose multi-user or enterprise licenses for cost-effective access to the report.
13. Are there any additional resources or data provided in the Energy-efficient Glass Market report?
While the report offers comprehensive insights, it's advisable to review the specific contents or supplementary materials provided to ascertain if additional resources or data are available.
14. How can I stay updated on further developments or reports in the Energy-efficient Glass Market?
To stay informed about further developments, trends, and reports in the Energy-efficient Glass Market, consider subscribing to industry newsletters, following relevant companies and organizations, or regularly checking reputable industry news sources and publications.
Methodology
Step 1 - Identification of Relevant Samples Size from Population Database


Step 2 - Approaches for Defining Global Market Size (Value, Volume* & Price*)

Note*: In applicable scenarios
Step 3 - Data Sources
Primary Research
- Web Analytics
- Survey Reports
- Research Institute
- Latest Research Reports
- Opinion Leaders
Secondary Research
- Annual Reports
- White Paper
- Latest Press Release
- Industry Association
- Paid Database
- Investor Presentations

Step 4 - Data Triangulation
Involves using different sources of information in order to increase the validity of a study
These sources are likely to be stakeholders in a program - participants, other researchers, program staff, other community members, and so on.
Then we put all data in single framework & apply various statistical tools to find out the dynamic on the market.
During the analysis stage, feedback from the stakeholder groups would be compared to determine areas of agreement as well as areas of divergence

