Key Insights
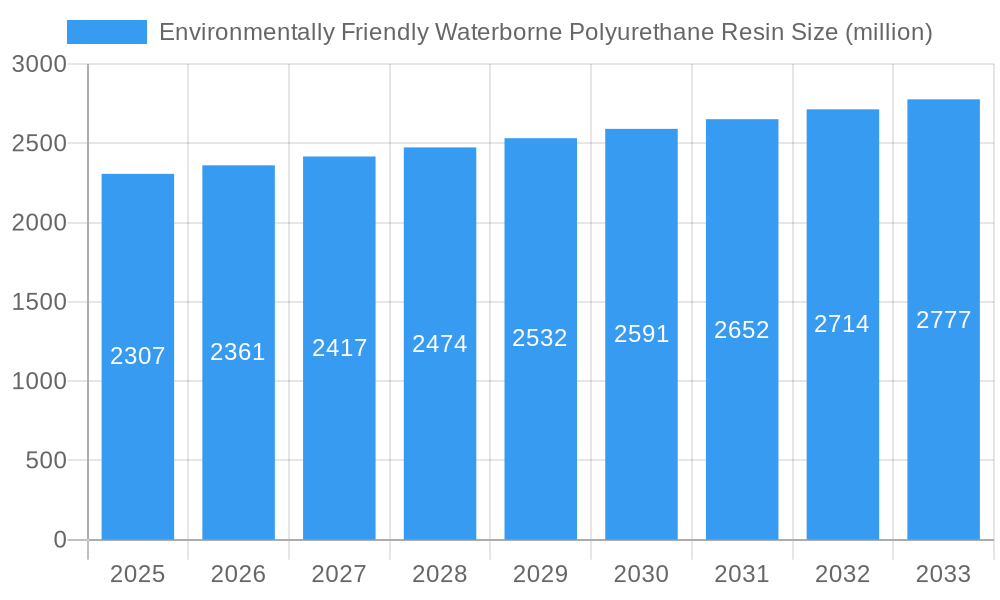
The global market for Environmentally Friendly Waterborne Polyurethane Resin is projected for substantial growth, reaching an estimated market size of $2,307 million by 2025. This expansion is fueled by an anticipated Compound Annual Growth Rate (CAGR) of 2.4% from 2019 to 2033, indicating a steady upward trajectory. The increasing global emphasis on sustainable practices and stringent environmental regulations is a primary driver behind this market's ascendancy. Industries are actively seeking alternatives to solvent-based polyurethane resins due to their volatile organic compound (VOC) emissions, which contribute to air pollution and pose health risks. Waterborne polyurethane resins offer a compelling solution, providing comparable performance with significantly reduced environmental impact. Key applications driving demand include the construction sector, where they are used in coatings, adhesives, and sealants for their durability and low VOC content. The packaging industry is also a significant contributor, leveraging these resins for food-safe and environmentally conscious packaging solutions. Furthermore, the automotive sector is increasingly adopting waterborne polyurethanes for interior and exterior components, aligning with OEM sustainability goals.
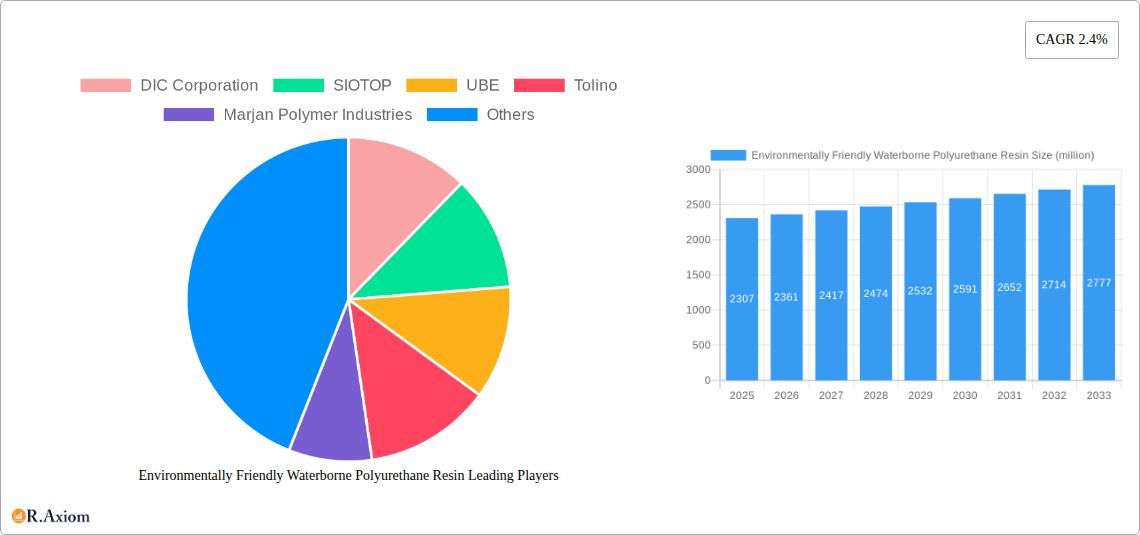
Environmentally Friendly Waterborne Polyurethane Resin Market Size (In Billion)
The market's growth is further supported by ongoing technological advancements leading to improved performance characteristics of waterborne polyurethane resins, such as enhanced chemical resistance, flexibility, and adhesion. This innovation is making them increasingly competitive with traditional solvent-borne counterparts. While the market exhibits robust growth, certain restraints may influence its pace. These could include the initial cost of implementation for some applications or a perceived learning curve for manufacturers accustomed to solvent-based systems. However, the long-term benefits of reduced environmental compliance costs and improved worker safety are expected to outweigh these initial hurdles. The market is segmented into Anionic and Cationic types, each offering distinct properties suited for specific applications. Major players like DIC Corporation, SIOTOP, and UBE are actively investing in research and development to expand their product portfolios and cater to the evolving demands of this environmentally conscious market.
Environmentally Friendly Waterborne Polyurethane Resin Company Market Share
Environmentally Friendly Waterborne Polyurethane Resin Market Concentration & Innovation
The global environmentally friendly waterborne polyurethane resin market exhibits a moderate concentration, with a few key players like DIC Corporation, UBE, and ANHUI DOWELL HUATAI NEW MATERIALS CO.,LTD holding significant market shares estimated to be over twenty million. However, the landscape is increasingly dynamic due to continuous innovation. Driving this innovation are stringent environmental regulations pushing for VOC-free solutions and growing consumer demand for sustainable products across applications like construction, packaging, and automotive. Regulatory frameworks globally are progressively favoring waterborne technologies over solvent-based alternatives, fostering significant R&D investment. Product substitutes, while present in the form of other eco-friendly coatings like waterborne acrylics and epoxies, are yet to fully match the performance versatility of polyurethanes in demanding applications. End-user trends clearly indicate a preference for materials with lower environmental impact, reduced toxicity, and enhanced durability, directly boosting the adoption of waterborne PU resins. Mergers and acquisitions (M&A) are becoming a strategic tool for market consolidation and technology acquisition. Notable M&A activities in the historical period (2019-2024) have seen deal values ranging from fifty million to over two hundred million, enabling companies to expand their product portfolios and geographic reach.
Environmentally Friendly Waterborne Polyurethane Resin Industry Trends & Insights
The environmentally friendly waterborne polyurethane resin industry is poised for robust growth, driven by a confluence of compelling market trends and technological advancements. The overarching driver is the escalating global consciousness towards sustainability and environmental protection. Governments worldwide are implementing stricter regulations on Volatile Organic Compound (VOC) emissions, directly propelling the demand for waterborne polyurethane resins as a viable and eco-compliant alternative to traditional solvent-based systems. This regulatory push is transforming industry practices, making waterborne PU the preferred choice in numerous applications.
Technological disruptions are playing a pivotal role in enhancing the performance and broadening the application scope of these resins. Innovations in dispersion technology and resin chemistry are yielding products with improved properties such as enhanced adhesion, superior chemical resistance, better abrasion resistance, and faster curing times. These advancements are crucial for meeting the evolving demands of end-use industries. For instance, the development of high-performance anionic and cationic waterborne polyurethane dispersions (PUDs) has opened up new avenues in specialized applications where solvent-borne systems were once indispensable.
Consumer preferences are also undergoing a significant shift. End-users across diverse sectors, including automotive, construction, and packaging, are increasingly seeking products that are not only high-performing but also environmentally responsible and safe for human health. This demand for "green" materials directly translates into a higher market penetration for waterborne polyurethane resins. The perception of these materials as premium, sustainable solutions is gaining traction, influencing purchasing decisions at both industrial and consumer levels.
Competitive dynamics within the market are intensifying as established players and new entrants vie for market share. Companies are focusing on strategic partnerships, product differentiation, and expanding their manufacturing capacities to cater to the growing demand. The base year of 2025 anticipates a market size in the range of thirteen billion, with a projected Compound Annual Growth Rate (CAGR) of approximately eight percent throughout the forecast period of 2025–2033. This growth trajectory is a testament to the industry's resilience and its ability to adapt to the evolving environmental and performance requirements. The market penetration of waterborne PU is expected to surpass sixty percent by 2030, driven by both regulatory mandates and the intrinsic performance advantages of the technology.
Dominant Markets & Segments in Environmentally Friendly Waterborne Polyurethane Resin
The environmentally friendly waterborne polyurethane resin market is experiencing significant growth and diversification across various applications and types. The Construction Field stands out as a dominant application segment, driven by substantial government investments in infrastructure development and a growing emphasis on sustainable building materials. Countries with robust construction sectors, such as China, the United States, and Germany, are major consumers.
- Key Drivers in Construction:
- Infrastructure Spending: Large-scale government projects for roads, bridges, and public buildings necessitate durable and environmentally compliant coatings and adhesives, for which waterborne PU resins are ideally suited. Estimated infrastructure investment in the historical period reached over one hundred million annually.
- Green Building Initiatives: Growing demand for LEED-certified buildings and energy-efficient structures mandates the use of low-VOC materials, directly benefiting waterborne PU adoption for flooring, sealants, and protective coatings.
- Urbanization and Renovation: Rapid urbanization in developing economies and extensive renovation projects in mature markets fuel the demand for repair and finishing materials incorporating waterborne PU.
- Performance Requirements: The need for weather resistance, abrasion durability, and chemical inertness in construction applications makes waterborne PU a preferred choice over less resilient alternatives.
The Packaging Field is another significant segment, propelled by the increasing demand for sustainable packaging solutions. The shift away from single-use plastics and the need for innovative, eco-friendly barrier coatings and adhesives are key contributors.
- Key Drivers in Packaging:
- E-commerce Growth: The surge in online retail necessitates robust and protective packaging, where waterborne PU adhesives and coatings offer excellent bonding strength and durability for various substrates.
- Food Safety Regulations: Stringent regulations regarding food contact materials are pushing manufacturers towards safer, water-based alternatives for laminating adhesives and coatings, creating a strong market for waterborne PU.
- Recyclability and Biodegradability Concerns: As consumers and regulators push for more recyclable and biodegradable packaging, waterborne PU's lower environmental footprint compared to solvent-based counterparts makes it an attractive option.
The Automotive Field is witnessing a growing adoption of waterborne PU resins, particularly for interior and exterior components. The focus on reducing vehicle weight and improving fuel efficiency, coupled with stricter emission standards, is driving this trend.
- Key Drivers in Automotive:
- Lightweighting Initiatives: Waterborne PU coatings and adhesives contribute to vehicle lightweighting, improving fuel efficiency and reducing emissions, a key objective for automotive manufacturers.
- Interior Aesthetics and Durability: For automotive interiors, waterborne PU offers excellent scratch resistance, UV stability, and a premium feel for components like dashboards, seating, and trim.
- Emissions Regulations: The automotive industry faces stringent regulations on VOC emissions from manufacturing processes, making waterborne PU an essential component in compliant production lines.
In terms of Type, the Anionic Type of waterborne polyurethane resin is currently more dominant due to its widespread use in various applications, particularly in coatings and adhesives where good stability and compatibility with a wide range of pigments and fillers are required. The Cationic Type, while historically less prevalent, is gaining traction due to its specific advantages in certain niche applications requiring improved adhesion to challenging substrates or enhanced corrosion resistance. The development of more advanced cationic PUDs is expected to drive its market share growth in the coming years. The market size for anionic PUDs is estimated to be over eight billion in 2025, while cationic PUDs are projected to reach over three billion.
The dominant region for environmentally friendly waterborne polyurethane resin consumption is Asia Pacific, driven by its large manufacturing base, rapid industrialization, and increasing environmental awareness. Countries like China and India are at the forefront of this growth, with substantial investments in construction, packaging, and automotive sectors. The region's market share is estimated to be over thirty-five percent, with a projected CAGR of nine percent during the forecast period.
Environmentally Friendly Waterborne Polyurethane Resin Product Developments
Recent product developments in environmentally friendly waterborne polyurethane resins are focused on enhancing performance while maintaining their eco-friendly profile. Innovations include the creation of high-solid content PUDs that reduce water usage and VOCs, leading to faster drying times and improved throughput in manufacturing processes. Advancements in cross-linking technologies are yielding resins with superior scratch, chemical, and abrasion resistance, making them suitable for demanding applications in automotive interiors and industrial flooring. Furthermore, the development of bio-based waterborne polyurethanes is gaining momentum, addressing the growing demand for renewable and sustainable materials. These developments aim to bridge the performance gap between traditional solvent-borne polyurethanes and their waterborne counterparts, driving wider adoption across various industries.
Report Scope & Segmentation Analysis
This report provides a comprehensive analysis of the global environmentally friendly waterborne polyurethane resin market, segmented by Application and Type. The Application segments covered are:
- Construction Field: This segment encompasses the use of waterborne PU resins in architectural coatings, wood finishes, concrete sealers, adhesives for flooring, and waterproofing membranes. Projected market size for this segment is expected to exceed five billion by 2025.
- Packaging Field: This includes applications in flexible packaging adhesives, barrier coatings for paper and board, and protective coatings for printed materials. The market size for this segment is estimated to be around three billion by 2025.
- Automotive Field: This segment covers coatings for automotive interiors and exteriors, adhesives for component assembly, and sealants. The market size for this segment is projected to reach over two billion by 2025.
The Type segmentation includes:
- Anionic Type: This refers to waterborne PU resins stabilized by anionic surfactants or functional groups, commonly used in coatings, adhesives, and textiles. The market size for anionic PUDs is expected to be over eight billion in 2025.
- Cationic Type: These resins are stabilized by cationic groups and are advantageous for adhesion to specific substrates and in applications requiring corrosion resistance. The market size for cationic PUDs is projected to be over three billion by 2025.
Key Drivers of Environmentally Friendly Waterborne Polyurethane Resin Growth
The growth of the environmentally friendly waterborne polyurethane resin market is primarily propelled by stringent environmental regulations worldwide, mandating reduced VOC emissions. This regulatory push is complemented by increasing consumer demand for sustainable products, influencing purchasing decisions across all end-use industries. Technological advancements in resin chemistry and dispersion technologies are continuously improving the performance and expanding the application range of waterborne PU. Furthermore, the growing construction and automotive industries, particularly in emerging economies, are creating substantial demand for high-performance, eco-friendly materials. The cost-effectiveness and versatility of waterborne PU resins compared to some traditional alternatives also contribute to their widespread adoption.
Challenges in the Environmentally Friendly Waterborne Polyurethane Resin Sector
Despite the positive growth trajectory, the environmentally friendly waterborne polyurethane resin sector faces several challenges. One significant hurdle is the higher initial cost of production compared to some solvent-based alternatives, although this is often offset by lower disposal costs and regulatory compliance. Performance limitations in certain highly demanding applications, such as extreme temperature resistance or specific chemical resistance, still exist, though continuous R&D is addressing these. Supply chain complexities for key raw materials and the need for specialized processing equipment can also pose challenges for manufacturers. Additionally, market education and perception sometimes lag behind technological advancements, requiring consistent efforts to highlight the benefits and capabilities of waterborne PU resins.
Emerging Opportunities in Environmentally Friendly Waterborne Polyurethane Resin
Emerging opportunities in the environmentally friendly waterborne polyurethane resin market are abundant, driven by innovation and evolving market needs. The expansion into new application areas, such as electronics, medical devices, and textiles, presents significant growth potential. The increasing focus on circular economy principles is driving the development of recyclable and bio-degradable waterborne PU formulations. Furthermore, the growing demand for high-performance coatings in renewable energy infrastructure, like solar panels and wind turbines, offers a lucrative avenue. The integration of smart functionalities within waterborne PU resins, such as self-healing or antimicrobial properties, represents another promising area for future development and market penetration.
Leading Players in the Environmentally Friendly Waterborne Polyurethane Resin Market
- DIC Corporation
- SIOTOP
- UBE
- Tolino
- Marjan Polymer Industries
- ANHUI DOWELL HUATAI NEW MATERIALS CO.,LTD
- Jiyu Materials
- SIOResin
- TAIWAN PU CORPORATION
- Kamsons
Key Developments in Environmentally Friendly Waterborne Polyurethane Resin Industry
- 2023: DIC Corporation launches a new range of bio-based waterborne polyurethane dispersions (PUDs) for sustainable coatings.
- 2023: UBE expands its production capacity for environmentally friendly waterborne polyurethane resins to meet growing demand in Asia.
- 2022: ANHUI DOWELL HUATAI NEW MATERIALS CO.,LTD introduces advanced cationic waterborne polyurethane resins for enhanced automotive applications.
- 2022: SIOTOP announces strategic partnerships to develop innovative waterborne PU solutions for the packaging industry.
- 2021: TAIWAN PU CORPORATION focuses on R&D for improved weatherability in waterborne polyurethane coatings for construction.
- 2020: Kamsons invests in new manufacturing technologies to enhance the efficiency of their environmentally friendly waterborne polyurethane resin production.
- 2019: Marjan Polymer Industries enters the market with a portfolio of waterborne polyurethane adhesives for various industrial applications.
Strategic Outlook for Environmentally Friendly Waterborne Polyurethane Resin Market
The strategic outlook for the environmentally friendly waterborne polyurethane resin market remains exceptionally positive, fueled by ongoing global sustainability initiatives and technological innovation. The market is expected to witness continued growth driven by the increasing stringency of environmental regulations and a persistent consumer preference for eco-conscious products. Companies that invest in advanced R&D, focus on developing high-performance, specialized formulations, and expand their production capabilities will be well-positioned to capitalize on emerging opportunities. Strategic collaborations and acquisitions will likely play a crucial role in market consolidation and technology diffusion, enabling players to broaden their product portfolios and geographical reach. The anticipated market size of over eighteen billion by 2033 underscores the immense potential and strategic importance of this sector.
Environmentally Friendly Waterborne Polyurethane Resin Segmentation
-
1. Application
- 1.1. Construction Field
- 1.2. Packaging Field
- 1.3. Automotive Field
-
2. Type
- 2.1. Anionic Type
- 2.2. Cationic Type
Environmentally Friendly Waterborne Polyurethane Resin Segmentation By Geography
-
1. North America
- 1.1. United States
- 1.2. Canada
- 1.3. Mexico
-
2. South America
- 2.1. Brazil
- 2.2. Argentina
- 2.3. Rest of South America
-
3. Europe
- 3.1. United Kingdom
- 3.2. Germany
- 3.3. France
- 3.4. Italy
- 3.5. Spain
- 3.6. Russia
- 3.7. Benelux
- 3.8. Nordics
- 3.9. Rest of Europe
-
4. Middle East & Africa
- 4.1. Turkey
- 4.2. Israel
- 4.3. GCC
- 4.4. North Africa
- 4.5. South Africa
- 4.6. Rest of Middle East & Africa
-
5. Asia Pacific
- 5.1. China
- 5.2. India
- 5.3. Japan
- 5.4. South Korea
- 5.5. ASEAN
- 5.6. Oceania
- 5.7. Rest of Asia Pacific
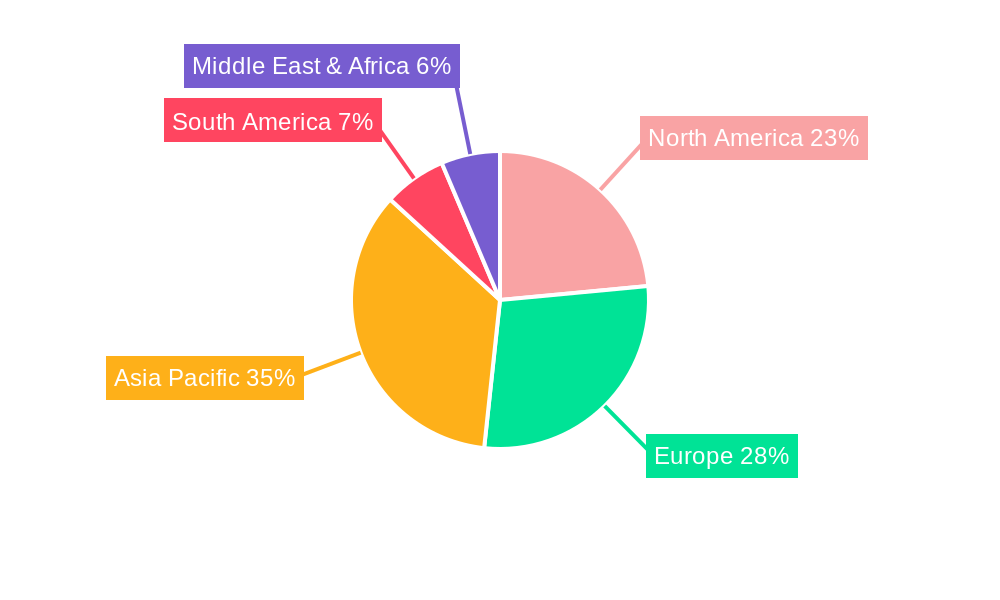
Environmentally Friendly Waterborne Polyurethane Resin Regional Market Share
Geographic Coverage of Environmentally Friendly Waterborne Polyurethane Resin
Environmentally Friendly Waterborne Polyurethane Resin REPORT HIGHLIGHTS
| Aspects | Details |
|---|---|
| Study Period | 2020-2034 |
| Base Year | 2025 |
| Estimated Year | 2026 |
| Forecast Period | 2026-2034 |
| Historical Period | 2020-2025 |
| Growth Rate | CAGR of 2.4% from 2020-2034 |
| Segmentation |
|
Table of Contents
- 1. Introduction
- 1.1. Research Scope
- 1.2. Market Segmentation
- 1.3. Research Objective
- 1.4. Definitions and Assumptions
- 2. Executive Summary
- 2.1. Market Snapshot
- 3. Market Dynamics
- 3.1. Market Drivers
- 3.2. Market Restrains
- 3.3. Market Trends
- 3.4. Market Opportunities
- 4. Market Factor Analysis
- 4.1. Porters Five Forces
- 4.1.1. Bargaining Power of Suppliers
- 4.1.2. Bargaining Power of Buyers
- 4.1.3. Threat of New Entrants
- 4.1.4. Threat of Substitutes
- 4.1.5. Competitive Rivalry
- 4.2. PESTEL analysis
- 4.3. BCG Analysis
- 4.3.1. Stars (High Growth, High Market Share)
- 4.3.2. Cash Cows (Low Growth, High Market Share)
- 4.3.3. Question Mark (High Growth, Low Market Share)
- 4.3.4. Dogs (Low Growth, Low Market Share)
- 4.4. Ansoff Matrix Analysis
- 4.5. Supply Chain Analysis
- 4.6. Regulatory Landscape
- 4.7. Current Market Potential and Opportunity Assessment (TAM–SAM–SOM Framework)
- 4.8. RAX Analyst Note
- 4.1. Porters Five Forces
- 5. Market Analysis, Insights and Forecast 2021-2033
- 5.1. Market Analysis, Insights and Forecast - by Application
- 5.1.1. Construction Field
- 5.1.2. Packaging Field
- 5.1.3. Automotive Field
- 5.2. Market Analysis, Insights and Forecast - by Type
- 5.2.1. Anionic Type
- 5.2.2. Cationic Type
- 5.3. Market Analysis, Insights and Forecast - by Region
- 5.3.1. North America
- 5.3.2. South America
- 5.3.3. Europe
- 5.3.4. Middle East & Africa
- 5.3.5. Asia Pacific
- 5.1. Market Analysis, Insights and Forecast - by Application
- 6. Global Environmentally Friendly Waterborne Polyurethane Resin Analysis, Insights and Forecast, 2021-2033
- 6.1. Market Analysis, Insights and Forecast - by Application
- 6.1.1. Construction Field
- 6.1.2. Packaging Field
- 6.1.3. Automotive Field
- 6.2. Market Analysis, Insights and Forecast - by Type
- 6.2.1. Anionic Type
- 6.2.2. Cationic Type
- 6.1. Market Analysis, Insights and Forecast - by Application
- 7. North America Environmentally Friendly Waterborne Polyurethane Resin Analysis, Insights and Forecast, 2020-2032
- 7.1. Market Analysis, Insights and Forecast - by Application
- 7.1.1. Construction Field
- 7.1.2. Packaging Field
- 7.1.3. Automotive Field
- 7.2. Market Analysis, Insights and Forecast - by Type
- 7.2.1. Anionic Type
- 7.2.2. Cationic Type
- 7.1. Market Analysis, Insights and Forecast - by Application
- 8. South America Environmentally Friendly Waterborne Polyurethane Resin Analysis, Insights and Forecast, 2020-2032
- 8.1. Market Analysis, Insights and Forecast - by Application
- 8.1.1. Construction Field
- 8.1.2. Packaging Field
- 8.1.3. Automotive Field
- 8.2. Market Analysis, Insights and Forecast - by Type
- 8.2.1. Anionic Type
- 8.2.2. Cationic Type
- 8.1. Market Analysis, Insights and Forecast - by Application
- 9. Europe Environmentally Friendly Waterborne Polyurethane Resin Analysis, Insights and Forecast, 2020-2032
- 9.1. Market Analysis, Insights and Forecast - by Application
- 9.1.1. Construction Field
- 9.1.2. Packaging Field
- 9.1.3. Automotive Field
- 9.2. Market Analysis, Insights and Forecast - by Type
- 9.2.1. Anionic Type
- 9.2.2. Cationic Type
- 9.1. Market Analysis, Insights and Forecast - by Application
- 10. Middle East & Africa Environmentally Friendly Waterborne Polyurethane Resin Analysis, Insights and Forecast, 2020-2032
- 10.1. Market Analysis, Insights and Forecast - by Application
- 10.1.1. Construction Field
- 10.1.2. Packaging Field
- 10.1.3. Automotive Field
- 10.2. Market Analysis, Insights and Forecast - by Type
- 10.2.1. Anionic Type
- 10.2.2. Cationic Type
- 10.1. Market Analysis, Insights and Forecast - by Application
- 11. Asia Pacific Environmentally Friendly Waterborne Polyurethane Resin Analysis, Insights and Forecast, 2020-2032
- 11.1. Market Analysis, Insights and Forecast - by Application
- 11.1.1. Construction Field
- 11.1.2. Packaging Field
- 11.1.3. Automotive Field
- 11.2. Market Analysis, Insights and Forecast - by Type
- 11.2.1. Anionic Type
- 11.2.2. Cationic Type
- 11.1. Market Analysis, Insights and Forecast - by Application
- 12. Competitive Analysis
- 12.1. Company Profiles
- 12.1.1 DIC Corporation
- 12.1.1.1. Company Overview
- 12.1.1.2. Products
- 12.1.1.3. Company Financials
- 12.1.1.4. SWOT Analysis
- 12.1.2 SIOTOP
- 12.1.2.1. Company Overview
- 12.1.2.2. Products
- 12.1.2.3. Company Financials
- 12.1.2.4. SWOT Analysis
- 12.1.3 UBE
- 12.1.3.1. Company Overview
- 12.1.3.2. Products
- 12.1.3.3. Company Financials
- 12.1.3.4. SWOT Analysis
- 12.1.4 Tolino
- 12.1.4.1. Company Overview
- 12.1.4.2. Products
- 12.1.4.3. Company Financials
- 12.1.4.4. SWOT Analysis
- 12.1.5 Marjan Polymer Industries
- 12.1.5.1. Company Overview
- 12.1.5.2. Products
- 12.1.5.3. Company Financials
- 12.1.5.4. SWOT Analysis
- 12.1.6 ANHUI DOWELL HUATAI NEW MATERIALS CO.LTD
- 12.1.6.1. Company Overview
- 12.1.6.2. Products
- 12.1.6.3. Company Financials
- 12.1.6.4. SWOT Analysis
- 12.1.7 Jiyu Materials
- 12.1.7.1. Company Overview
- 12.1.7.2. Products
- 12.1.7.3. Company Financials
- 12.1.7.4. SWOT Analysis
- 12.1.8 SIOResin
- 12.1.8.1. Company Overview
- 12.1.8.2. Products
- 12.1.8.3. Company Financials
- 12.1.8.4. SWOT Analysis
- 12.1.9 TAIWAN PU CORPORATION
- 12.1.9.1. Company Overview
- 12.1.9.2. Products
- 12.1.9.3. Company Financials
- 12.1.9.4. SWOT Analysis
- 12.1.10 Kamsons
- 12.1.10.1. Company Overview
- 12.1.10.2. Products
- 12.1.10.3. Company Financials
- 12.1.10.4. SWOT Analysis
- 12.1.1 DIC Corporation
- 12.2. Market Entropy
- 12.2.1 Company's Key Areas Served
- 12.2.2 Recent Developments
- 12.3. Company Market Share Analysis 2025
- 12.3.1 Top 5 Companies Market Share Analysis
- 12.3.2 Top 3 Companies Market Share Analysis
- 12.4. List of Potential Customers
- 13. Research Methodology
List of Figures
- Figure 1: Global Environmentally Friendly Waterborne Polyurethane Resin Revenue Breakdown (million, %) by Region 2025 & 2033
- Figure 2: North America Environmentally Friendly Waterborne Polyurethane Resin Revenue (million), by Application 2025 & 2033
- Figure 3: North America Environmentally Friendly Waterborne Polyurethane Resin Revenue Share (%), by Application 2025 & 2033
- Figure 4: North America Environmentally Friendly Waterborne Polyurethane Resin Revenue (million), by Type 2025 & 2033
- Figure 5: North America Environmentally Friendly Waterborne Polyurethane Resin Revenue Share (%), by Type 2025 & 2033
- Figure 6: North America Environmentally Friendly Waterborne Polyurethane Resin Revenue (million), by Country 2025 & 2033
- Figure 7: North America Environmentally Friendly Waterborne Polyurethane Resin Revenue Share (%), by Country 2025 & 2033
- Figure 8: South America Environmentally Friendly Waterborne Polyurethane Resin Revenue (million), by Application 2025 & 2033
- Figure 9: South America Environmentally Friendly Waterborne Polyurethane Resin Revenue Share (%), by Application 2025 & 2033
- Figure 10: South America Environmentally Friendly Waterborne Polyurethane Resin Revenue (million), by Type 2025 & 2033
- Figure 11: South America Environmentally Friendly Waterborne Polyurethane Resin Revenue Share (%), by Type 2025 & 2033
- Figure 12: South America Environmentally Friendly Waterborne Polyurethane Resin Revenue (million), by Country 2025 & 2033
- Figure 13: South America Environmentally Friendly Waterborne Polyurethane Resin Revenue Share (%), by Country 2025 & 2033
- Figure 14: Europe Environmentally Friendly Waterborne Polyurethane Resin Revenue (million), by Application 2025 & 2033
- Figure 15: Europe Environmentally Friendly Waterborne Polyurethane Resin Revenue Share (%), by Application 2025 & 2033
- Figure 16: Europe Environmentally Friendly Waterborne Polyurethane Resin Revenue (million), by Type 2025 & 2033
- Figure 17: Europe Environmentally Friendly Waterborne Polyurethane Resin Revenue Share (%), by Type 2025 & 2033
- Figure 18: Europe Environmentally Friendly Waterborne Polyurethane Resin Revenue (million), by Country 2025 & 2033
- Figure 19: Europe Environmentally Friendly Waterborne Polyurethane Resin Revenue Share (%), by Country 2025 & 2033
- Figure 20: Middle East & Africa Environmentally Friendly Waterborne Polyurethane Resin Revenue (million), by Application 2025 & 2033
- Figure 21: Middle East & Africa Environmentally Friendly Waterborne Polyurethane Resin Revenue Share (%), by Application 2025 & 2033
- Figure 22: Middle East & Africa Environmentally Friendly Waterborne Polyurethane Resin Revenue (million), by Type 2025 & 2033
- Figure 23: Middle East & Africa Environmentally Friendly Waterborne Polyurethane Resin Revenue Share (%), by Type 2025 & 2033
- Figure 24: Middle East & Africa Environmentally Friendly Waterborne Polyurethane Resin Revenue (million), by Country 2025 & 2033
- Figure 25: Middle East & Africa Environmentally Friendly Waterborne Polyurethane Resin Revenue Share (%), by Country 2025 & 2033
- Figure 26: Asia Pacific Environmentally Friendly Waterborne Polyurethane Resin Revenue (million), by Application 2025 & 2033
- Figure 27: Asia Pacific Environmentally Friendly Waterborne Polyurethane Resin Revenue Share (%), by Application 2025 & 2033
- Figure 28: Asia Pacific Environmentally Friendly Waterborne Polyurethane Resin Revenue (million), by Type 2025 & 2033
- Figure 29: Asia Pacific Environmentally Friendly Waterborne Polyurethane Resin Revenue Share (%), by Type 2025 & 2033
- Figure 30: Asia Pacific Environmentally Friendly Waterborne Polyurethane Resin Revenue (million), by Country 2025 & 2033
- Figure 31: Asia Pacific Environmentally Friendly Waterborne Polyurethane Resin Revenue Share (%), by Country 2025 & 2033
List of Tables
- Table 1: Global Environmentally Friendly Waterborne Polyurethane Resin Revenue million Forecast, by Application 2020 & 2033
- Table 2: Global Environmentally Friendly Waterborne Polyurethane Resin Revenue million Forecast, by Type 2020 & 2033
- Table 3: Global Environmentally Friendly Waterborne Polyurethane Resin Revenue million Forecast, by Region 2020 & 2033
- Table 4: Global Environmentally Friendly Waterborne Polyurethane Resin Revenue million Forecast, by Application 2020 & 2033
- Table 5: Global Environmentally Friendly Waterborne Polyurethane Resin Revenue million Forecast, by Type 2020 & 2033
- Table 6: Global Environmentally Friendly Waterborne Polyurethane Resin Revenue million Forecast, by Country 2020 & 2033
- Table 7: United States Environmentally Friendly Waterborne Polyurethane Resin Revenue (million) Forecast, by Application 2020 & 2033
- Table 8: Canada Environmentally Friendly Waterborne Polyurethane Resin Revenue (million) Forecast, by Application 2020 & 2033
- Table 9: Mexico Environmentally Friendly Waterborne Polyurethane Resin Revenue (million) Forecast, by Application 2020 & 2033
- Table 10: Global Environmentally Friendly Waterborne Polyurethane Resin Revenue million Forecast, by Application 2020 & 2033
- Table 11: Global Environmentally Friendly Waterborne Polyurethane Resin Revenue million Forecast, by Type 2020 & 2033
- Table 12: Global Environmentally Friendly Waterborne Polyurethane Resin Revenue million Forecast, by Country 2020 & 2033
- Table 13: Brazil Environmentally Friendly Waterborne Polyurethane Resin Revenue (million) Forecast, by Application 2020 & 2033
- Table 14: Argentina Environmentally Friendly Waterborne Polyurethane Resin Revenue (million) Forecast, by Application 2020 & 2033
- Table 15: Rest of South America Environmentally Friendly Waterborne Polyurethane Resin Revenue (million) Forecast, by Application 2020 & 2033
- Table 16: Global Environmentally Friendly Waterborne Polyurethane Resin Revenue million Forecast, by Application 2020 & 2033
- Table 17: Global Environmentally Friendly Waterborne Polyurethane Resin Revenue million Forecast, by Type 2020 & 2033
- Table 18: Global Environmentally Friendly Waterborne Polyurethane Resin Revenue million Forecast, by Country 2020 & 2033
- Table 19: United Kingdom Environmentally Friendly Waterborne Polyurethane Resin Revenue (million) Forecast, by Application 2020 & 2033
- Table 20: Germany Environmentally Friendly Waterborne Polyurethane Resin Revenue (million) Forecast, by Application 2020 & 2033
- Table 21: France Environmentally Friendly Waterborne Polyurethane Resin Revenue (million) Forecast, by Application 2020 & 2033
- Table 22: Italy Environmentally Friendly Waterborne Polyurethane Resin Revenue (million) Forecast, by Application 2020 & 2033
- Table 23: Spain Environmentally Friendly Waterborne Polyurethane Resin Revenue (million) Forecast, by Application 2020 & 2033
- Table 24: Russia Environmentally Friendly Waterborne Polyurethane Resin Revenue (million) Forecast, by Application 2020 & 2033
- Table 25: Benelux Environmentally Friendly Waterborne Polyurethane Resin Revenue (million) Forecast, by Application 2020 & 2033
- Table 26: Nordics Environmentally Friendly Waterborne Polyurethane Resin Revenue (million) Forecast, by Application 2020 & 2033
- Table 27: Rest of Europe Environmentally Friendly Waterborne Polyurethane Resin Revenue (million) Forecast, by Application 2020 & 2033
- Table 28: Global Environmentally Friendly Waterborne Polyurethane Resin Revenue million Forecast, by Application 2020 & 2033
- Table 29: Global Environmentally Friendly Waterborne Polyurethane Resin Revenue million Forecast, by Type 2020 & 2033
- Table 30: Global Environmentally Friendly Waterborne Polyurethane Resin Revenue million Forecast, by Country 2020 & 2033
- Table 31: Turkey Environmentally Friendly Waterborne Polyurethane Resin Revenue (million) Forecast, by Application 2020 & 2033
- Table 32: Israel Environmentally Friendly Waterborne Polyurethane Resin Revenue (million) Forecast, by Application 2020 & 2033
- Table 33: GCC Environmentally Friendly Waterborne Polyurethane Resin Revenue (million) Forecast, by Application 2020 & 2033
- Table 34: North Africa Environmentally Friendly Waterborne Polyurethane Resin Revenue (million) Forecast, by Application 2020 & 2033
- Table 35: South Africa Environmentally Friendly Waterborne Polyurethane Resin Revenue (million) Forecast, by Application 2020 & 2033
- Table 36: Rest of Middle East & Africa Environmentally Friendly Waterborne Polyurethane Resin Revenue (million) Forecast, by Application 2020 & 2033
- Table 37: Global Environmentally Friendly Waterborne Polyurethane Resin Revenue million Forecast, by Application 2020 & 2033
- Table 38: Global Environmentally Friendly Waterborne Polyurethane Resin Revenue million Forecast, by Type 2020 & 2033
- Table 39: Global Environmentally Friendly Waterborne Polyurethane Resin Revenue million Forecast, by Country 2020 & 2033
- Table 40: China Environmentally Friendly Waterborne Polyurethane Resin Revenue (million) Forecast, by Application 2020 & 2033
- Table 41: India Environmentally Friendly Waterborne Polyurethane Resin Revenue (million) Forecast, by Application 2020 & 2033
- Table 42: Japan Environmentally Friendly Waterborne Polyurethane Resin Revenue (million) Forecast, by Application 2020 & 2033
- Table 43: South Korea Environmentally Friendly Waterborne Polyurethane Resin Revenue (million) Forecast, by Application 2020 & 2033
- Table 44: ASEAN Environmentally Friendly Waterborne Polyurethane Resin Revenue (million) Forecast, by Application 2020 & 2033
- Table 45: Oceania Environmentally Friendly Waterborne Polyurethane Resin Revenue (million) Forecast, by Application 2020 & 2033
- Table 46: Rest of Asia Pacific Environmentally Friendly Waterborne Polyurethane Resin Revenue (million) Forecast, by Application 2020 & 2033
Frequently Asked Questions
1. What is the projected Compound Annual Growth Rate (CAGR) of the Environmentally Friendly Waterborne Polyurethane Resin?
The projected CAGR is approximately 2.4%.
2. Which companies are prominent players in the Environmentally Friendly Waterborne Polyurethane Resin?
Key companies in the market include DIC Corporation, SIOTOP, UBE, Tolino, Marjan Polymer Industries, ANHUI DOWELL HUATAI NEW MATERIALS CO.,LTD, Jiyu Materials, SIOResin, TAIWAN PU CORPORATION, Kamsons.
3. What are the main segments of the Environmentally Friendly Waterborne Polyurethane Resin?
The market segments include Application, Type.
4. Can you provide details about the market size?
The market size is estimated to be USD 2307 million as of 2022.
5. What are some drivers contributing to market growth?
N/A
6. What are the notable trends driving market growth?
N/A
7. Are there any restraints impacting market growth?
N/A
8. Can you provide examples of recent developments in the market?
N/A
9. What pricing options are available for accessing the report?
Pricing options include single-user, multi-user, and enterprise licenses priced at USD 2900.00, USD 4350.00, and USD 5800.00 respectively.
10. Is the market size provided in terms of value or volume?
The market size is provided in terms of value, measured in million.
11. Are there any specific market keywords associated with the report?
Yes, the market keyword associated with the report is "Environmentally Friendly Waterborne Polyurethane Resin," which aids in identifying and referencing the specific market segment covered.
12. How do I determine which pricing option suits my needs best?
The pricing options vary based on user requirements and access needs. Individual users may opt for single-user licenses, while businesses requiring broader access may choose multi-user or enterprise licenses for cost-effective access to the report.
13. Are there any additional resources or data provided in the Environmentally Friendly Waterborne Polyurethane Resin report?
While the report offers comprehensive insights, it's advisable to review the specific contents or supplementary materials provided to ascertain if additional resources or data are available.
14. How can I stay updated on further developments or reports in the Environmentally Friendly Waterborne Polyurethane Resin?
To stay informed about further developments, trends, and reports in the Environmentally Friendly Waterborne Polyurethane Resin, consider subscribing to industry newsletters, following relevant companies and organizations, or regularly checking reputable industry news sources and publications.
Methodology
Step 1 - Identification of Relevant Samples Size from Population Database


Step 2 - Approaches for Defining Global Market Size (Value, Volume* & Price*)

Note*: In applicable scenarios
Step 3 - Data Sources
Primary Research
- Web Analytics
- Survey Reports
- Research Institute
- Latest Research Reports
- Opinion Leaders
Secondary Research
- Annual Reports
- White Paper
- Latest Press Release
- Industry Association
- Paid Database
- Investor Presentations

Step 4 - Data Triangulation
Involves using different sources of information in order to increase the validity of a study
These sources are likely to be stakeholders in a program - participants, other researchers, program staff, other community members, and so on.
Then we put all data in single framework & apply various statistical tools to find out the dynamic on the market.
During the analysis stage, feedback from the stakeholder groups would be compared to determine areas of agreement as well as areas of divergence

