
Key Insights
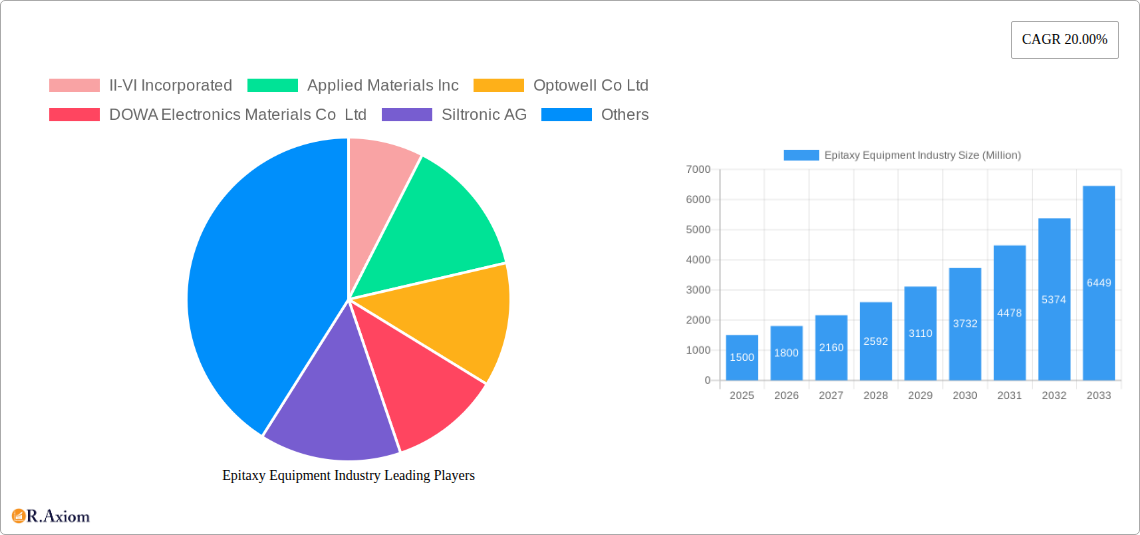
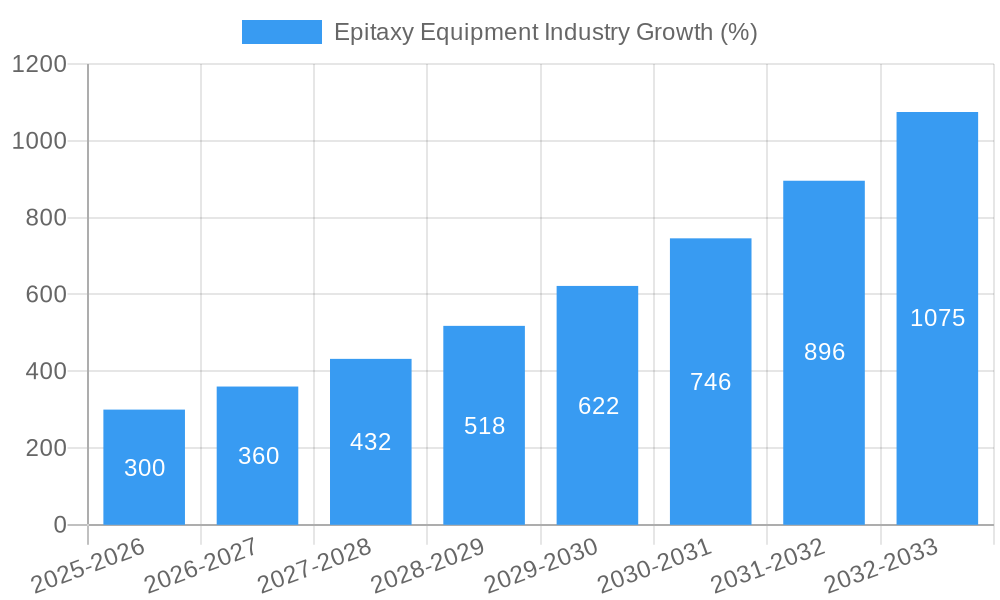
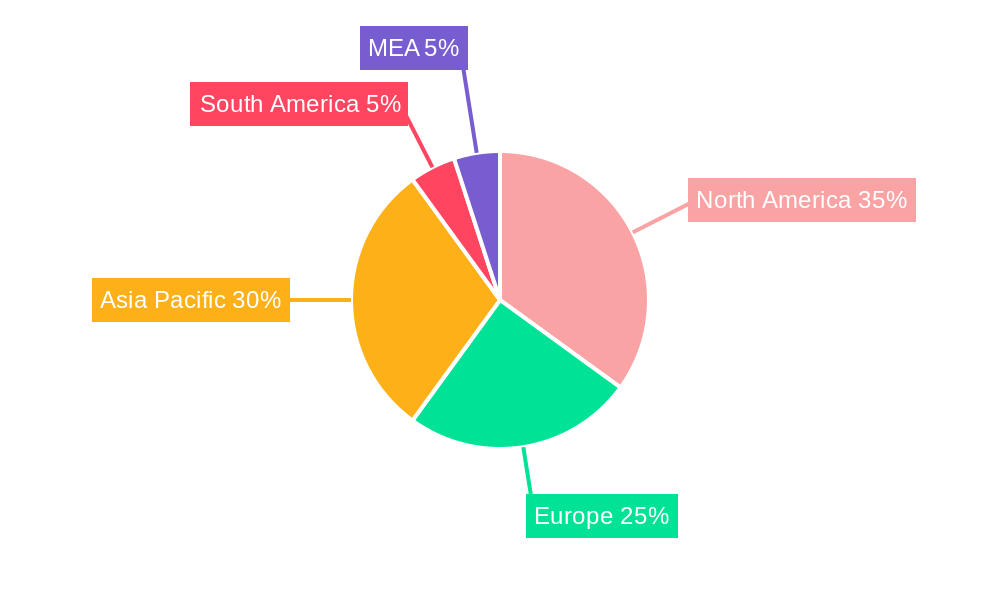
The Epitaxy Equipment market is experiencing robust growth, fueled by the increasing demand for advanced semiconductors and photonics components. A compound annual growth rate (CAGR) of 20% from 2019 to 2024 suggests a substantial market expansion, likely driven by advancements in 5G infrastructure, the burgeoning electric vehicle sector, and the continuous miniaturization of electronics. The market segmentation reveals a strong reliance on technologies like MOCVD, HT CVD, and MBE, reflecting the need for precise and efficient crystal growth in various applications. The substantial investments in research and development across the semiconductor and photonics industries further underpin this market growth. Key application areas include photonics, driving advancements in optical communication and sensing technologies, and the semiconductor industry, catering to the production of increasingly complex integrated circuits. The wide-bandgap material segment is also poised for significant expansion, driven by the increasing adoption of SiC and GaN-based power electronics. Geographic distribution indicates strong market presence in North America and Asia Pacific, with China and the United States being major contributors due to their established semiconductor manufacturing ecosystems. Competition is intense, with key players such as II-VI Incorporated, Applied Materials, and Tokyo Electron Limited vying for market share through innovation and strategic partnerships.
The forecast period (2025-2033) promises continued expansion, with the CAGR likely to remain strong, though potentially moderating slightly as the market matures. However, factors such as geopolitical instability and fluctuations in raw material prices could present challenges. Further technological advancements, particularly in materials science and automation, will be crucial in driving future growth. The increasing focus on sustainability and energy efficiency will also shape the market, pushing for the development of more energy-efficient epitaxy equipment. Overall, the long-term outlook for the Epitaxy Equipment market remains positive, driven by persistent demand from diverse sectors and continuous technological improvements. The market is expected to reach a significant value by 2033, reflecting its critical role in enabling advancements in various high-growth technology sectors.
Epitaxy Equipment Industry: A Comprehensive Market Report (2019-2033)
This in-depth report provides a comprehensive analysis of the Epitaxy Equipment industry, offering valuable insights for stakeholders seeking to understand market trends, competitive dynamics, and future growth opportunities. The study period covers 2019-2033, with 2025 serving as the base and estimated year. The report leverages extensive primary and secondary research, incorporating data from leading industry players such as II-VI Incorporated, Applied Materials Inc, Optowell Co Ltd, DOWA Electronics Materials Co Ltd, Siltronic AG, Aixtron SE, Intelligent Epitaxy Technology Inc, Tokyo Electron Limited, and NuFlare Technology Inc (Toshiba Electronic Devices and Storage Corporation). The total market value in 2025 is estimated at xx Million, with a projected xx% CAGR from 2025 to 2033.
Epitaxy Equipment Industry Market Concentration & Innovation
The Epitaxy Equipment market exhibits a moderately concentrated landscape, with a few major players holding significant market share. II-VI Incorporated, Applied Materials Inc, and Tokyo Electron Limited are among the dominant players, collectively accounting for an estimated xx% of the global market share in 2025. Market concentration is influenced by factors such as high capital expenditure requirements, technological expertise, and established supply chains.
Innovation within the industry is driven by the increasing demand for advanced semiconductor materials and devices. Key innovations include advancements in MOCVD, MBE, and HT CVD technologies, leading to higher throughput, improved material quality, and the ability to fabricate more complex structures. Stringent regulatory frameworks, particularly related to environmental compliance and material safety, also shape innovation efforts. Product substitutes, such as alternative thin-film deposition techniques, pose a competitive threat, prompting continuous technological advancements. End-user trends towards miniaturization, higher performance, and energy efficiency are further driving innovation. Significant M&A activity, with deal values exceeding xx Million in the last five years, indicates a consolidation trend within the sector, aiming for technological synergies and market expansion.
- Market Share (2025): II-VI Incorporated (xx%), Applied Materials Inc (xx%), Tokyo Electron Limited (xx%), Others (xx%).
- M&A Activity (2020-2024): Total deal value exceeding xx Million.
Epitaxy Equipment Industry Industry Trends & Insights
The Epitaxy Equipment market is experiencing robust growth, driven by the expanding demand for semiconductors, photonics devices, and wide-bandgap materials across various end-use industries. The increasing adoption of 5G technology, the proliferation of data centers, and the growth of the automotive and renewable energy sectors are significant contributors to this growth. Technological disruptions, such as the development of advanced materials and processing techniques, are pushing the boundaries of what is achievable with epitaxy equipment. Consumer preferences for smaller, faster, and more energy-efficient electronic devices are also driving demand. Competitive dynamics are intense, with companies focusing on innovation, cost optimization, and strategic partnerships to gain a competitive edge. The market penetration of advanced epitaxy technologies, such as MBE for high-electron mobility transistors (HEMTs) and MOCVD for LED manufacturing, is steadily increasing.
Dominant Markets & Segments in Epitaxy Equipment Industry
The Asia-Pacific region, particularly China, South Korea, and Taiwan, dominates the Epitaxy Equipment market, fueled by significant investments in semiconductor manufacturing and robust growth in the electronics industry. Within the technology segments, MOCVD holds the largest market share, driven by its extensive use in LED and power semiconductor manufacturing. In terms of application, the semiconductor segment is the largest, followed by photonics. The wide-bandgap material segment exhibits high growth potential, driven by increasing adoption in power electronics and high-frequency applications.
Key Drivers for Asia-Pacific Dominance:
- Extensive government support for semiconductor manufacturing.
- Large and growing electronics industry.
- Availability of skilled labor.
- Robust infrastructure.
Dominant Technology Segment: MOCVD (driven by LED and power semiconductor manufacturing)
Dominant Application Segment: Semiconductor (due to the widespread use in integrated circuits and other electronic devices)
Epitaxy Equipment Industry Product Developments
Recent product innovations focus on enhancing throughput, precision, and process control in epitaxy equipment. New systems incorporate advanced automation, real-time monitoring capabilities, and improved material handling mechanisms. These advancements allow for the fabrication of more complex and higher-performance devices. Key competitive advantages stem from superior process control, higher yields, and reduced manufacturing costs, thus enabling manufacturers to deliver high-quality products at competitive prices, catering to the ever-evolving demands of the electronics industry.
Report Scope & Segmentation Analysis
This report segments the Epitaxy Equipment market based on technology (MOCVD, HT CVD, MBE) and application (Photonics, Semiconductor, Wide-bandgap Material, Others). Each segment's growth projection, market size, and competitive dynamics are analyzed in detail. The MOCVD segment is projected to experience significant growth due to its wide applications in LED lighting and power electronics. The semiconductor segment is expected to maintain its dominance, while the wide-bandgap material segment is anticipated to exhibit the highest growth rate due to increased demand for high-power and high-frequency devices.
Key Drivers of Epitaxy Equipment Industry Growth
The growth of the Epitaxy Equipment industry is propelled by several factors, including the increasing demand for advanced semiconductor devices, the expansion of the 5G infrastructure, the growth of the electric vehicle market driving demand for power electronics, and advancements in materials science leading to new applications for epitaxy-grown materials. Government policies supporting semiconductor manufacturing and investments in research and development further bolster this growth.
Challenges in the Epitaxy Equipment Industry Sector
The Epitaxy Equipment industry faces challenges such as high capital expenditure requirements for equipment, intense competition, and the complexity of maintaining high-quality standards in manufacturing. Supply chain disruptions, exacerbated by geopolitical events, can significantly impact manufacturing timelines and costs. Stringent environmental regulations add another layer of complexity to operations. The industry's future growth may also be hindered by the development of alternative thin film deposition technologies.
Emerging Opportunities in Epitaxy Equipment Industry
Emerging opportunities lie in the development of next-generation semiconductor materials, particularly wide-bandgap semiconductors like GaN and SiC, for use in power electronics and high-frequency applications. The expansion of the photonics industry, with applications in optical communications, sensing, and laser technology, offers another significant avenue for growth. The development of more energy-efficient and sustainable manufacturing processes presents an opportunity to enhance competitiveness and meet growing environmental concerns.
Leading Players in the Epitaxy Equipment Industry Market
- II-VI Incorporated
- Applied Materials Inc
- Optowell Co Ltd
- DOWA Electronics Materials Co Ltd
- Siltronic AG
- Aixtron SE
- Intelligent Epitaxy Technology Inc
- Tokyo Electron Limited
- NuFlare Technology Inc (Toshiba Electronic Devices and Storage Corporation)
Key Developments in Epitaxy Equipment Industry Industry
- October 2023: Applied Materials announces a new MOCVD system with enhanced throughput and process control.
- June 2023: Aixtron SE launches a new MBE system for the fabrication of high-performance transistors.
- March 2023: II-VI Incorporated and Tokyo Electron Limited announce a strategic partnership for the development of next-generation epitaxy equipment.
- (Further key developments to be added based on data collected)
Strategic Outlook for Epitaxy Equipment Industry Market
The Epitaxy Equipment market is poised for continued strong growth, driven by technological advancements, the expansion of key end-use markets, and supportive government policies. Focusing on innovation, strategic partnerships, and addressing environmental concerns will be crucial for companies to thrive in this competitive landscape. The development of advanced materials and processes will further drive market growth. The long-term potential of the market hinges on continuous adaptation and innovation within the industry.
Epitaxy Equipment Industry Segmentation
-
1. Technology
- 1.1. MOCVD
- 1.2. HT CVD
- 1.3. MBE
-
2. Application
- 2.1. Photonics
- 2.2. Semiconductor
- 2.3. Wide-bandgap Material
- 2.4. Others
Epitaxy Equipment Industry Segmentation By Geography
- 1. North America
- 2. Europe
- 3. Asia Pacific
- 4. Rest of the World
Epitaxy Equipment Industry REPORT HIGHLIGHTS
| Aspects | Details |
|---|---|
| Study Period | 2019-2033 |
| Base Year | 2024 |
| Estimated Year | 2025 |
| Forecast Period | 2025-2033 |
| Historical Period | 2019-2024 |
| Growth Rate | CAGR of 20.00% from 2019-2033 |
| Segmentation |
|
Table of Contents
- 1. Introduction
- 1.1. Research Scope
- 1.2. Market Segmentation
- 1.3. Research Methodology
- 1.4. Definitions and Assumptions
- 2. Executive Summary
- 2.1. Introduction
- 3. Market Dynamics
- 3.1. Introduction
- 3.2. Market Drivers
- 3.2.1. ; Continuous Introduction of Disruptive LED Devices; Growing Use in Power Applications is Expected to Act as Driver
- 3.3. Market Restrains
- 3.3.1. ; Complexities Associated with the Design
- 3.4. Market Trends
- 3.4.1. Continuous Introduction of Disruptive LED Devices will Act as a Driver
- 4. Market Factor Analysis
- 4.1. Porters Five Forces
- 4.2. Supply/Value Chain
- 4.3. PESTEL analysis
- 4.4. Market Entropy
- 4.5. Patent/Trademark Analysis
- 5. Global Epitaxy Equipment Industry Analysis, Insights and Forecast, 2019-2031
- 5.1. Market Analysis, Insights and Forecast - by Technology
- 5.1.1. MOCVD
- 5.1.2. HT CVD
- 5.1.3. MBE
- 5.2. Market Analysis, Insights and Forecast - by Application
- 5.2.1. Photonics
- 5.2.2. Semiconductor
- 5.2.3. Wide-bandgap Material
- 5.2.4. Others
- 5.3. Market Analysis, Insights and Forecast - by Region
- 5.3.1. North America
- 5.3.2. Europe
- 5.3.3. Asia Pacific
- 5.3.4. Rest of the World
- 5.1. Market Analysis, Insights and Forecast - by Technology
- 6. North America Epitaxy Equipment Industry Analysis, Insights and Forecast, 2019-2031
- 6.1. Market Analysis, Insights and Forecast - by Technology
- 6.1.1. MOCVD
- 6.1.2. HT CVD
- 6.1.3. MBE
- 6.2. Market Analysis, Insights and Forecast - by Application
- 6.2.1. Photonics
- 6.2.2. Semiconductor
- 6.2.3. Wide-bandgap Material
- 6.2.4. Others
- 6.1. Market Analysis, Insights and Forecast - by Technology
- 7. Europe Epitaxy Equipment Industry Analysis, Insights and Forecast, 2019-2031
- 7.1. Market Analysis, Insights and Forecast - by Technology
- 7.1.1. MOCVD
- 7.1.2. HT CVD
- 7.1.3. MBE
- 7.2. Market Analysis, Insights and Forecast - by Application
- 7.2.1. Photonics
- 7.2.2. Semiconductor
- 7.2.3. Wide-bandgap Material
- 7.2.4. Others
- 7.1. Market Analysis, Insights and Forecast - by Technology
- 8. Asia Pacific Epitaxy Equipment Industry Analysis, Insights and Forecast, 2019-2031
- 8.1. Market Analysis, Insights and Forecast - by Technology
- 8.1.1. MOCVD
- 8.1.2. HT CVD
- 8.1.3. MBE
- 8.2. Market Analysis, Insights and Forecast - by Application
- 8.2.1. Photonics
- 8.2.2. Semiconductor
- 8.2.3. Wide-bandgap Material
- 8.2.4. Others
- 8.1. Market Analysis, Insights and Forecast - by Technology
- 9. Rest of the World Epitaxy Equipment Industry Analysis, Insights and Forecast, 2019-2031
- 9.1. Market Analysis, Insights and Forecast - by Technology
- 9.1.1. MOCVD
- 9.1.2. HT CVD
- 9.1.3. MBE
- 9.2. Market Analysis, Insights and Forecast - by Application
- 9.2.1. Photonics
- 9.2.2. Semiconductor
- 9.2.3. Wide-bandgap Material
- 9.2.4. Others
- 9.1. Market Analysis, Insights and Forecast - by Technology
- 10. North America Epitaxy Equipment Industry Analysis, Insights and Forecast, 2019-2031
- 10.1. Market Analysis, Insights and Forecast - By Country/Sub-region
- 10.1.1 United States
- 10.1.2 Canada
- 10.1.3 Mexico
- 11. Europe Epitaxy Equipment Industry Analysis, Insights and Forecast, 2019-2031
- 11.1. Market Analysis, Insights and Forecast - By Country/Sub-region
- 11.1.1 Germany
- 11.1.2 United Kingdom
- 11.1.3 France
- 11.1.4 Spain
- 11.1.5 Italy
- 11.1.6 Spain
- 11.1.7 Belgium
- 11.1.8 Netherland
- 11.1.9 Nordics
- 11.1.10 Rest of Europe
- 12. Asia Pacific Epitaxy Equipment Industry Analysis, Insights and Forecast, 2019-2031
- 12.1. Market Analysis, Insights and Forecast - By Country/Sub-region
- 12.1.1 China
- 12.1.2 Japan
- 12.1.3 India
- 12.1.4 South Korea
- 12.1.5 Southeast Asia
- 12.1.6 Australia
- 12.1.7 Indonesia
- 12.1.8 Phillipes
- 12.1.9 Singapore
- 12.1.10 Thailandc
- 12.1.11 Rest of Asia Pacific
- 13. South America Epitaxy Equipment Industry Analysis, Insights and Forecast, 2019-2031
- 13.1. Market Analysis, Insights and Forecast - By Country/Sub-region
- 13.1.1 Brazil
- 13.1.2 Argentina
- 13.1.3 Peru
- 13.1.4 Chile
- 13.1.5 Colombia
- 13.1.6 Ecuador
- 13.1.7 Venezuela
- 13.1.8 Rest of South America
- 14. North America Epitaxy Equipment Industry Analysis, Insights and Forecast, 2019-2031
- 14.1. Market Analysis, Insights and Forecast - By Country/Sub-region
- 14.1.1 United States
- 14.1.2 Canada
- 14.1.3 Mexico
- 15. MEA Epitaxy Equipment Industry Analysis, Insights and Forecast, 2019-2031
- 15.1. Market Analysis, Insights and Forecast - By Country/Sub-region
- 15.1.1 United Arab Emirates
- 15.1.2 Saudi Arabia
- 15.1.3 South Africa
- 15.1.4 Rest of Middle East and Africa
- 16. Competitive Analysis
- 16.1. Global Market Share Analysis 2024
- 16.2. Company Profiles
- 16.2.1 II-VI Incorporated
- 16.2.1.1. Overview
- 16.2.1.2. Products
- 16.2.1.3. SWOT Analysis
- 16.2.1.4. Recent Developments
- 16.2.1.5. Financials (Based on Availability)
- 16.2.2 Applied Materials Inc
- 16.2.2.1. Overview
- 16.2.2.2. Products
- 16.2.2.3. SWOT Analysis
- 16.2.2.4. Recent Developments
- 16.2.2.5. Financials (Based on Availability)
- 16.2.3 Optowell Co Ltd
- 16.2.3.1. Overview
- 16.2.3.2. Products
- 16.2.3.3. SWOT Analysis
- 16.2.3.4. Recent Developments
- 16.2.3.5. Financials (Based on Availability)
- 16.2.4 DOWA Electronics Materials Co Ltd
- 16.2.4.1. Overview
- 16.2.4.2. Products
- 16.2.4.3. SWOT Analysis
- 16.2.4.4. Recent Developments
- 16.2.4.5. Financials (Based on Availability)
- 16.2.5 Siltronic AG
- 16.2.5.1. Overview
- 16.2.5.2. Products
- 16.2.5.3. SWOT Analysis
- 16.2.5.4. Recent Developments
- 16.2.5.5. Financials (Based on Availability)
- 16.2.6 Aixtron SE
- 16.2.6.1. Overview
- 16.2.6.2. Products
- 16.2.6.3. SWOT Analysis
- 16.2.6.4. Recent Developments
- 16.2.6.5. Financials (Based on Availability)
- 16.2.7 Intelligent Epitaxy Technology Inc
- 16.2.7.1. Overview
- 16.2.7.2. Products
- 16.2.7.3. SWOT Analysis
- 16.2.7.4. Recent Developments
- 16.2.7.5. Financials (Based on Availability)
- 16.2.8 Tokyo Electron Limited
- 16.2.8.1. Overview
- 16.2.8.2. Products
- 16.2.8.3. SWOT Analysis
- 16.2.8.4. Recent Developments
- 16.2.8.5. Financials (Based on Availability)
- 16.2.9 NuFlare Technology Inc (Toshiba Electronic Devices and Storage Corporation)
- 16.2.9.1. Overview
- 16.2.9.2. Products
- 16.2.9.3. SWOT Analysis
- 16.2.9.4. Recent Developments
- 16.2.9.5. Financials (Based on Availability)
- 16.2.1 II-VI Incorporated
List of Figures
- Figure 1: Global Epitaxy Equipment Industry Revenue Breakdown (Million, %) by Region 2024 & 2032
- Figure 2: Global Epitaxy Equipment Industry Volume Breakdown (K Unit, %) by Region 2024 & 2032
- Figure 3: North America Epitaxy Equipment Industry Revenue (Million), by Country 2024 & 2032
- Figure 4: North America Epitaxy Equipment Industry Volume (K Unit), by Country 2024 & 2032
- Figure 5: North America Epitaxy Equipment Industry Revenue Share (%), by Country 2024 & 2032
- Figure 6: North America Epitaxy Equipment Industry Volume Share (%), by Country 2024 & 2032
- Figure 7: Europe Epitaxy Equipment Industry Revenue (Million), by Country 2024 & 2032
- Figure 8: Europe Epitaxy Equipment Industry Volume (K Unit), by Country 2024 & 2032
- Figure 9: Europe Epitaxy Equipment Industry Revenue Share (%), by Country 2024 & 2032
- Figure 10: Europe Epitaxy Equipment Industry Volume Share (%), by Country 2024 & 2032
- Figure 11: Asia Pacific Epitaxy Equipment Industry Revenue (Million), by Country 2024 & 2032
- Figure 12: Asia Pacific Epitaxy Equipment Industry Volume (K Unit), by Country 2024 & 2032
- Figure 13: Asia Pacific Epitaxy Equipment Industry Revenue Share (%), by Country 2024 & 2032
- Figure 14: Asia Pacific Epitaxy Equipment Industry Volume Share (%), by Country 2024 & 2032
- Figure 15: South America Epitaxy Equipment Industry Revenue (Million), by Country 2024 & 2032
- Figure 16: South America Epitaxy Equipment Industry Volume (K Unit), by Country 2024 & 2032
- Figure 17: South America Epitaxy Equipment Industry Revenue Share (%), by Country 2024 & 2032
- Figure 18: South America Epitaxy Equipment Industry Volume Share (%), by Country 2024 & 2032
- Figure 19: North America Epitaxy Equipment Industry Revenue (Million), by Country 2024 & 2032
- Figure 20: North America Epitaxy Equipment Industry Volume (K Unit), by Country 2024 & 2032
- Figure 21: North America Epitaxy Equipment Industry Revenue Share (%), by Country 2024 & 2032
- Figure 22: North America Epitaxy Equipment Industry Volume Share (%), by Country 2024 & 2032
- Figure 23: MEA Epitaxy Equipment Industry Revenue (Million), by Country 2024 & 2032
- Figure 24: MEA Epitaxy Equipment Industry Volume (K Unit), by Country 2024 & 2032
- Figure 25: MEA Epitaxy Equipment Industry Revenue Share (%), by Country 2024 & 2032
- Figure 26: MEA Epitaxy Equipment Industry Volume Share (%), by Country 2024 & 2032
- Figure 27: North America Epitaxy Equipment Industry Revenue (Million), by Technology 2024 & 2032
- Figure 28: North America Epitaxy Equipment Industry Volume (K Unit), by Technology 2024 & 2032
- Figure 29: North America Epitaxy Equipment Industry Revenue Share (%), by Technology 2024 & 2032
- Figure 30: North America Epitaxy Equipment Industry Volume Share (%), by Technology 2024 & 2032
- Figure 31: North America Epitaxy Equipment Industry Revenue (Million), by Application 2024 & 2032
- Figure 32: North America Epitaxy Equipment Industry Volume (K Unit), by Application 2024 & 2032
- Figure 33: North America Epitaxy Equipment Industry Revenue Share (%), by Application 2024 & 2032
- Figure 34: North America Epitaxy Equipment Industry Volume Share (%), by Application 2024 & 2032
- Figure 35: North America Epitaxy Equipment Industry Revenue (Million), by Country 2024 & 2032
- Figure 36: North America Epitaxy Equipment Industry Volume (K Unit), by Country 2024 & 2032
- Figure 37: North America Epitaxy Equipment Industry Revenue Share (%), by Country 2024 & 2032
- Figure 38: North America Epitaxy Equipment Industry Volume Share (%), by Country 2024 & 2032
- Figure 39: Europe Epitaxy Equipment Industry Revenue (Million), by Technology 2024 & 2032
- Figure 40: Europe Epitaxy Equipment Industry Volume (K Unit), by Technology 2024 & 2032
- Figure 41: Europe Epitaxy Equipment Industry Revenue Share (%), by Technology 2024 & 2032
- Figure 42: Europe Epitaxy Equipment Industry Volume Share (%), by Technology 2024 & 2032
- Figure 43: Europe Epitaxy Equipment Industry Revenue (Million), by Application 2024 & 2032
- Figure 44: Europe Epitaxy Equipment Industry Volume (K Unit), by Application 2024 & 2032
- Figure 45: Europe Epitaxy Equipment Industry Revenue Share (%), by Application 2024 & 2032
- Figure 46: Europe Epitaxy Equipment Industry Volume Share (%), by Application 2024 & 2032
- Figure 47: Europe Epitaxy Equipment Industry Revenue (Million), by Country 2024 & 2032
- Figure 48: Europe Epitaxy Equipment Industry Volume (K Unit), by Country 2024 & 2032
- Figure 49: Europe Epitaxy Equipment Industry Revenue Share (%), by Country 2024 & 2032
- Figure 50: Europe Epitaxy Equipment Industry Volume Share (%), by Country 2024 & 2032
- Figure 51: Asia Pacific Epitaxy Equipment Industry Revenue (Million), by Technology 2024 & 2032
- Figure 52: Asia Pacific Epitaxy Equipment Industry Volume (K Unit), by Technology 2024 & 2032
- Figure 53: Asia Pacific Epitaxy Equipment Industry Revenue Share (%), by Technology 2024 & 2032
- Figure 54: Asia Pacific Epitaxy Equipment Industry Volume Share (%), by Technology 2024 & 2032
- Figure 55: Asia Pacific Epitaxy Equipment Industry Revenue (Million), by Application 2024 & 2032
- Figure 56: Asia Pacific Epitaxy Equipment Industry Volume (K Unit), by Application 2024 & 2032
- Figure 57: Asia Pacific Epitaxy Equipment Industry Revenue Share (%), by Application 2024 & 2032
- Figure 58: Asia Pacific Epitaxy Equipment Industry Volume Share (%), by Application 2024 & 2032
- Figure 59: Asia Pacific Epitaxy Equipment Industry Revenue (Million), by Country 2024 & 2032
- Figure 60: Asia Pacific Epitaxy Equipment Industry Volume (K Unit), by Country 2024 & 2032
- Figure 61: Asia Pacific Epitaxy Equipment Industry Revenue Share (%), by Country 2024 & 2032
- Figure 62: Asia Pacific Epitaxy Equipment Industry Volume Share (%), by Country 2024 & 2032
- Figure 63: Rest of the World Epitaxy Equipment Industry Revenue (Million), by Technology 2024 & 2032
- Figure 64: Rest of the World Epitaxy Equipment Industry Volume (K Unit), by Technology 2024 & 2032
- Figure 65: Rest of the World Epitaxy Equipment Industry Revenue Share (%), by Technology 2024 & 2032
- Figure 66: Rest of the World Epitaxy Equipment Industry Volume Share (%), by Technology 2024 & 2032
- Figure 67: Rest of the World Epitaxy Equipment Industry Revenue (Million), by Application 2024 & 2032
- Figure 68: Rest of the World Epitaxy Equipment Industry Volume (K Unit), by Application 2024 & 2032
- Figure 69: Rest of the World Epitaxy Equipment Industry Revenue Share (%), by Application 2024 & 2032
- Figure 70: Rest of the World Epitaxy Equipment Industry Volume Share (%), by Application 2024 & 2032
- Figure 71: Rest of the World Epitaxy Equipment Industry Revenue (Million), by Country 2024 & 2032
- Figure 72: Rest of the World Epitaxy Equipment Industry Volume (K Unit), by Country 2024 & 2032
- Figure 73: Rest of the World Epitaxy Equipment Industry Revenue Share (%), by Country 2024 & 2032
- Figure 74: Rest of the World Epitaxy Equipment Industry Volume Share (%), by Country 2024 & 2032
List of Tables
- Table 1: Global Epitaxy Equipment Industry Revenue Million Forecast, by Region 2019 & 2032
- Table 2: Global Epitaxy Equipment Industry Volume K Unit Forecast, by Region 2019 & 2032
- Table 3: Global Epitaxy Equipment Industry Revenue Million Forecast, by Technology 2019 & 2032
- Table 4: Global Epitaxy Equipment Industry Volume K Unit Forecast, by Technology 2019 & 2032
- Table 5: Global Epitaxy Equipment Industry Revenue Million Forecast, by Application 2019 & 2032
- Table 6: Global Epitaxy Equipment Industry Volume K Unit Forecast, by Application 2019 & 2032
- Table 7: Global Epitaxy Equipment Industry Revenue Million Forecast, by Region 2019 & 2032
- Table 8: Global Epitaxy Equipment Industry Volume K Unit Forecast, by Region 2019 & 2032
- Table 9: Global Epitaxy Equipment Industry Revenue Million Forecast, by Country 2019 & 2032
- Table 10: Global Epitaxy Equipment Industry Volume K Unit Forecast, by Country 2019 & 2032
- Table 11: United States Epitaxy Equipment Industry Revenue (Million) Forecast, by Application 2019 & 2032
- Table 12: United States Epitaxy Equipment Industry Volume (K Unit) Forecast, by Application 2019 & 2032
- Table 13: Canada Epitaxy Equipment Industry Revenue (Million) Forecast, by Application 2019 & 2032
- Table 14: Canada Epitaxy Equipment Industry Volume (K Unit) Forecast, by Application 2019 & 2032
- Table 15: Mexico Epitaxy Equipment Industry Revenue (Million) Forecast, by Application 2019 & 2032
- Table 16: Mexico Epitaxy Equipment Industry Volume (K Unit) Forecast, by Application 2019 & 2032
- Table 17: Global Epitaxy Equipment Industry Revenue Million Forecast, by Country 2019 & 2032
- Table 18: Global Epitaxy Equipment Industry Volume K Unit Forecast, by Country 2019 & 2032
- Table 19: Germany Epitaxy Equipment Industry Revenue (Million) Forecast, by Application 2019 & 2032
- Table 20: Germany Epitaxy Equipment Industry Volume (K Unit) Forecast, by Application 2019 & 2032
- Table 21: United Kingdom Epitaxy Equipment Industry Revenue (Million) Forecast, by Application 2019 & 2032
- Table 22: United Kingdom Epitaxy Equipment Industry Volume (K Unit) Forecast, by Application 2019 & 2032
- Table 23: France Epitaxy Equipment Industry Revenue (Million) Forecast, by Application 2019 & 2032
- Table 24: France Epitaxy Equipment Industry Volume (K Unit) Forecast, by Application 2019 & 2032
- Table 25: Spain Epitaxy Equipment Industry Revenue (Million) Forecast, by Application 2019 & 2032
- Table 26: Spain Epitaxy Equipment Industry Volume (K Unit) Forecast, by Application 2019 & 2032
- Table 27: Italy Epitaxy Equipment Industry Revenue (Million) Forecast, by Application 2019 & 2032
- Table 28: Italy Epitaxy Equipment Industry Volume (K Unit) Forecast, by Application 2019 & 2032
- Table 29: Spain Epitaxy Equipment Industry Revenue (Million) Forecast, by Application 2019 & 2032
- Table 30: Spain Epitaxy Equipment Industry Volume (K Unit) Forecast, by Application 2019 & 2032
- Table 31: Belgium Epitaxy Equipment Industry Revenue (Million) Forecast, by Application 2019 & 2032
- Table 32: Belgium Epitaxy Equipment Industry Volume (K Unit) Forecast, by Application 2019 & 2032
- Table 33: Netherland Epitaxy Equipment Industry Revenue (Million) Forecast, by Application 2019 & 2032
- Table 34: Netherland Epitaxy Equipment Industry Volume (K Unit) Forecast, by Application 2019 & 2032
- Table 35: Nordics Epitaxy Equipment Industry Revenue (Million) Forecast, by Application 2019 & 2032
- Table 36: Nordics Epitaxy Equipment Industry Volume (K Unit) Forecast, by Application 2019 & 2032
- Table 37: Rest of Europe Epitaxy Equipment Industry Revenue (Million) Forecast, by Application 2019 & 2032
- Table 38: Rest of Europe Epitaxy Equipment Industry Volume (K Unit) Forecast, by Application 2019 & 2032
- Table 39: Global Epitaxy Equipment Industry Revenue Million Forecast, by Country 2019 & 2032
- Table 40: Global Epitaxy Equipment Industry Volume K Unit Forecast, by Country 2019 & 2032
- Table 41: China Epitaxy Equipment Industry Revenue (Million) Forecast, by Application 2019 & 2032
- Table 42: China Epitaxy Equipment Industry Volume (K Unit) Forecast, by Application 2019 & 2032
- Table 43: Japan Epitaxy Equipment Industry Revenue (Million) Forecast, by Application 2019 & 2032
- Table 44: Japan Epitaxy Equipment Industry Volume (K Unit) Forecast, by Application 2019 & 2032
- Table 45: India Epitaxy Equipment Industry Revenue (Million) Forecast, by Application 2019 & 2032
- Table 46: India Epitaxy Equipment Industry Volume (K Unit) Forecast, by Application 2019 & 2032
- Table 47: South Korea Epitaxy Equipment Industry Revenue (Million) Forecast, by Application 2019 & 2032
- Table 48: South Korea Epitaxy Equipment Industry Volume (K Unit) Forecast, by Application 2019 & 2032
- Table 49: Southeast Asia Epitaxy Equipment Industry Revenue (Million) Forecast, by Application 2019 & 2032
- Table 50: Southeast Asia Epitaxy Equipment Industry Volume (K Unit) Forecast, by Application 2019 & 2032
- Table 51: Australia Epitaxy Equipment Industry Revenue (Million) Forecast, by Application 2019 & 2032
- Table 52: Australia Epitaxy Equipment Industry Volume (K Unit) Forecast, by Application 2019 & 2032
- Table 53: Indonesia Epitaxy Equipment Industry Revenue (Million) Forecast, by Application 2019 & 2032
- Table 54: Indonesia Epitaxy Equipment Industry Volume (K Unit) Forecast, by Application 2019 & 2032
- Table 55: Phillipes Epitaxy Equipment Industry Revenue (Million) Forecast, by Application 2019 & 2032
- Table 56: Phillipes Epitaxy Equipment Industry Volume (K Unit) Forecast, by Application 2019 & 2032
- Table 57: Singapore Epitaxy Equipment Industry Revenue (Million) Forecast, by Application 2019 & 2032
- Table 58: Singapore Epitaxy Equipment Industry Volume (K Unit) Forecast, by Application 2019 & 2032
- Table 59: Thailandc Epitaxy Equipment Industry Revenue (Million) Forecast, by Application 2019 & 2032
- Table 60: Thailandc Epitaxy Equipment Industry Volume (K Unit) Forecast, by Application 2019 & 2032
- Table 61: Rest of Asia Pacific Epitaxy Equipment Industry Revenue (Million) Forecast, by Application 2019 & 2032
- Table 62: Rest of Asia Pacific Epitaxy Equipment Industry Volume (K Unit) Forecast, by Application 2019 & 2032
- Table 63: Global Epitaxy Equipment Industry Revenue Million Forecast, by Country 2019 & 2032
- Table 64: Global Epitaxy Equipment Industry Volume K Unit Forecast, by Country 2019 & 2032
- Table 65: Brazil Epitaxy Equipment Industry Revenue (Million) Forecast, by Application 2019 & 2032
- Table 66: Brazil Epitaxy Equipment Industry Volume (K Unit) Forecast, by Application 2019 & 2032
- Table 67: Argentina Epitaxy Equipment Industry Revenue (Million) Forecast, by Application 2019 & 2032
- Table 68: Argentina Epitaxy Equipment Industry Volume (K Unit) Forecast, by Application 2019 & 2032
- Table 69: Peru Epitaxy Equipment Industry Revenue (Million) Forecast, by Application 2019 & 2032
- Table 70: Peru Epitaxy Equipment Industry Volume (K Unit) Forecast, by Application 2019 & 2032
- Table 71: Chile Epitaxy Equipment Industry Revenue (Million) Forecast, by Application 2019 & 2032
- Table 72: Chile Epitaxy Equipment Industry Volume (K Unit) Forecast, by Application 2019 & 2032
- Table 73: Colombia Epitaxy Equipment Industry Revenue (Million) Forecast, by Application 2019 & 2032
- Table 74: Colombia Epitaxy Equipment Industry Volume (K Unit) Forecast, by Application 2019 & 2032
- Table 75: Ecuador Epitaxy Equipment Industry Revenue (Million) Forecast, by Application 2019 & 2032
- Table 76: Ecuador Epitaxy Equipment Industry Volume (K Unit) Forecast, by Application 2019 & 2032
- Table 77: Venezuela Epitaxy Equipment Industry Revenue (Million) Forecast, by Application 2019 & 2032
- Table 78: Venezuela Epitaxy Equipment Industry Volume (K Unit) Forecast, by Application 2019 & 2032
- Table 79: Rest of South America Epitaxy Equipment Industry Revenue (Million) Forecast, by Application 2019 & 2032
- Table 80: Rest of South America Epitaxy Equipment Industry Volume (K Unit) Forecast, by Application 2019 & 2032
- Table 81: Global Epitaxy Equipment Industry Revenue Million Forecast, by Country 2019 & 2032
- Table 82: Global Epitaxy Equipment Industry Volume K Unit Forecast, by Country 2019 & 2032
- Table 83: United States Epitaxy Equipment Industry Revenue (Million) Forecast, by Application 2019 & 2032
- Table 84: United States Epitaxy Equipment Industry Volume (K Unit) Forecast, by Application 2019 & 2032
- Table 85: Canada Epitaxy Equipment Industry Revenue (Million) Forecast, by Application 2019 & 2032
- Table 86: Canada Epitaxy Equipment Industry Volume (K Unit) Forecast, by Application 2019 & 2032
- Table 87: Mexico Epitaxy Equipment Industry Revenue (Million) Forecast, by Application 2019 & 2032
- Table 88: Mexico Epitaxy Equipment Industry Volume (K Unit) Forecast, by Application 2019 & 2032
- Table 89: Global Epitaxy Equipment Industry Revenue Million Forecast, by Country 2019 & 2032
- Table 90: Global Epitaxy Equipment Industry Volume K Unit Forecast, by Country 2019 & 2032
- Table 91: United Arab Emirates Epitaxy Equipment Industry Revenue (Million) Forecast, by Application 2019 & 2032
- Table 92: United Arab Emirates Epitaxy Equipment Industry Volume (K Unit) Forecast, by Application 2019 & 2032
- Table 93: Saudi Arabia Epitaxy Equipment Industry Revenue (Million) Forecast, by Application 2019 & 2032
- Table 94: Saudi Arabia Epitaxy Equipment Industry Volume (K Unit) Forecast, by Application 2019 & 2032
- Table 95: South Africa Epitaxy Equipment Industry Revenue (Million) Forecast, by Application 2019 & 2032
- Table 96: South Africa Epitaxy Equipment Industry Volume (K Unit) Forecast, by Application 2019 & 2032
- Table 97: Rest of Middle East and Africa Epitaxy Equipment Industry Revenue (Million) Forecast, by Application 2019 & 2032
- Table 98: Rest of Middle East and Africa Epitaxy Equipment Industry Volume (K Unit) Forecast, by Application 2019 & 2032
- Table 99: Global Epitaxy Equipment Industry Revenue Million Forecast, by Technology 2019 & 2032
- Table 100: Global Epitaxy Equipment Industry Volume K Unit Forecast, by Technology 2019 & 2032
- Table 101: Global Epitaxy Equipment Industry Revenue Million Forecast, by Application 2019 & 2032
- Table 102: Global Epitaxy Equipment Industry Volume K Unit Forecast, by Application 2019 & 2032
- Table 103: Global Epitaxy Equipment Industry Revenue Million Forecast, by Country 2019 & 2032
- Table 104: Global Epitaxy Equipment Industry Volume K Unit Forecast, by Country 2019 & 2032
- Table 105: Global Epitaxy Equipment Industry Revenue Million Forecast, by Technology 2019 & 2032
- Table 106: Global Epitaxy Equipment Industry Volume K Unit Forecast, by Technology 2019 & 2032
- Table 107: Global Epitaxy Equipment Industry Revenue Million Forecast, by Application 2019 & 2032
- Table 108: Global Epitaxy Equipment Industry Volume K Unit Forecast, by Application 2019 & 2032
- Table 109: Global Epitaxy Equipment Industry Revenue Million Forecast, by Country 2019 & 2032
- Table 110: Global Epitaxy Equipment Industry Volume K Unit Forecast, by Country 2019 & 2032
- Table 111: Global Epitaxy Equipment Industry Revenue Million Forecast, by Technology 2019 & 2032
- Table 112: Global Epitaxy Equipment Industry Volume K Unit Forecast, by Technology 2019 & 2032
- Table 113: Global Epitaxy Equipment Industry Revenue Million Forecast, by Application 2019 & 2032
- Table 114: Global Epitaxy Equipment Industry Volume K Unit Forecast, by Application 2019 & 2032
- Table 115: Global Epitaxy Equipment Industry Revenue Million Forecast, by Country 2019 & 2032
- Table 116: Global Epitaxy Equipment Industry Volume K Unit Forecast, by Country 2019 & 2032
- Table 117: Global Epitaxy Equipment Industry Revenue Million Forecast, by Technology 2019 & 2032
- Table 118: Global Epitaxy Equipment Industry Volume K Unit Forecast, by Technology 2019 & 2032
- Table 119: Global Epitaxy Equipment Industry Revenue Million Forecast, by Application 2019 & 2032
- Table 120: Global Epitaxy Equipment Industry Volume K Unit Forecast, by Application 2019 & 2032
- Table 121: Global Epitaxy Equipment Industry Revenue Million Forecast, by Country 2019 & 2032
- Table 122: Global Epitaxy Equipment Industry Volume K Unit Forecast, by Country 2019 & 2032
Frequently Asked Questions
1. What is the projected Compound Annual Growth Rate (CAGR) of the Epitaxy Equipment Industry?
The projected CAGR is approximately 20.00%.
2. Which companies are prominent players in the Epitaxy Equipment Industry?
Key companies in the market include II-VI Incorporated, Applied Materials Inc, Optowell Co Ltd, DOWA Electronics Materials Co Ltd, Siltronic AG, Aixtron SE, Intelligent Epitaxy Technology Inc, Tokyo Electron Limited, NuFlare Technology Inc (Toshiba Electronic Devices and Storage Corporation).
3. What are the main segments of the Epitaxy Equipment Industry?
The market segments include Technology, Application.
4. Can you provide details about the market size?
The market size is estimated to be USD XX Million as of 2022.
5. What are some drivers contributing to market growth?
; Continuous Introduction of Disruptive LED Devices; Growing Use in Power Applications is Expected to Act as Driver.
6. What are the notable trends driving market growth?
Continuous Introduction of Disruptive LED Devices will Act as a Driver.
7. Are there any restraints impacting market growth?
; Complexities Associated with the Design.
8. Can you provide examples of recent developments in the market?
N/A
9. What pricing options are available for accessing the report?
Pricing options include single-user, multi-user, and enterprise licenses priced at USD 4750, USD 5250, and USD 8750 respectively.
10. Is the market size provided in terms of value or volume?
The market size is provided in terms of value, measured in Million and volume, measured in K Unit.
11. Are there any specific market keywords associated with the report?
Yes, the market keyword associated with the report is "Epitaxy Equipment Industry," which aids in identifying and referencing the specific market segment covered.
12. How do I determine which pricing option suits my needs best?
The pricing options vary based on user requirements and access needs. Individual users may opt for single-user licenses, while businesses requiring broader access may choose multi-user or enterprise licenses for cost-effective access to the report.
13. Are there any additional resources or data provided in the Epitaxy Equipment Industry report?
While the report offers comprehensive insights, it's advisable to review the specific contents or supplementary materials provided to ascertain if additional resources or data are available.
14. How can I stay updated on further developments or reports in the Epitaxy Equipment Industry?
To stay informed about further developments, trends, and reports in the Epitaxy Equipment Industry, consider subscribing to industry newsletters, following relevant companies and organizations, or regularly checking reputable industry news sources and publications.
Methodology
Step 1 - Identification of Relevant Samples Size from Population Database


Step 2 - Approaches for Defining Global Market Size (Value, Volume* & Price*)

Note*: In applicable scenarios
Step 3 - Data Sources
Primary Research
- Web Analytics
- Survey Reports
- Research Institute
- Latest Research Reports
- Opinion Leaders
Secondary Research
- Annual Reports
- White Paper
- Latest Press Release
- Industry Association
- Paid Database
- Investor Presentations

Step 4 - Data Triangulation
Involves using different sources of information in order to increase the validity of a study
These sources are likely to be stakeholders in a program - participants, other researchers, program staff, other community members, and so on.
Then we put all data in single framework & apply various statistical tools to find out the dynamic on the market.
During the analysis stage, feedback from the stakeholder groups would be compared to determine areas of agreement as well as areas of divergence


