
Key Insights
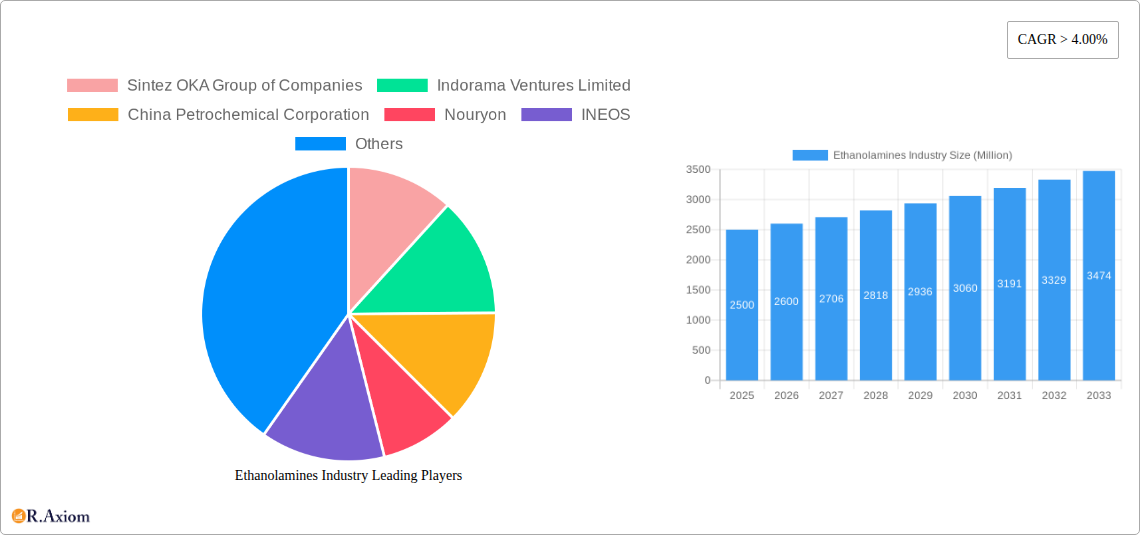
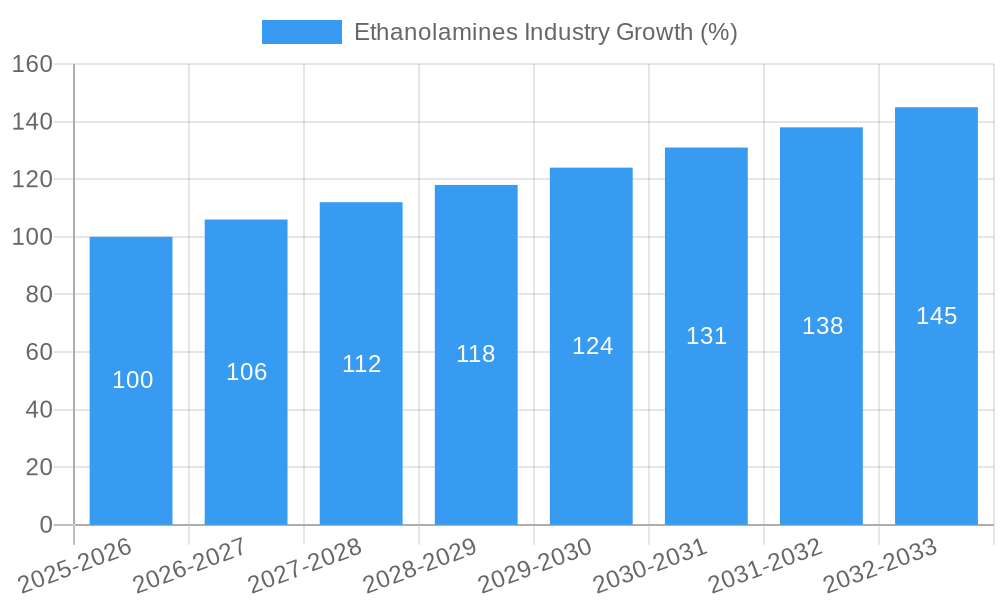
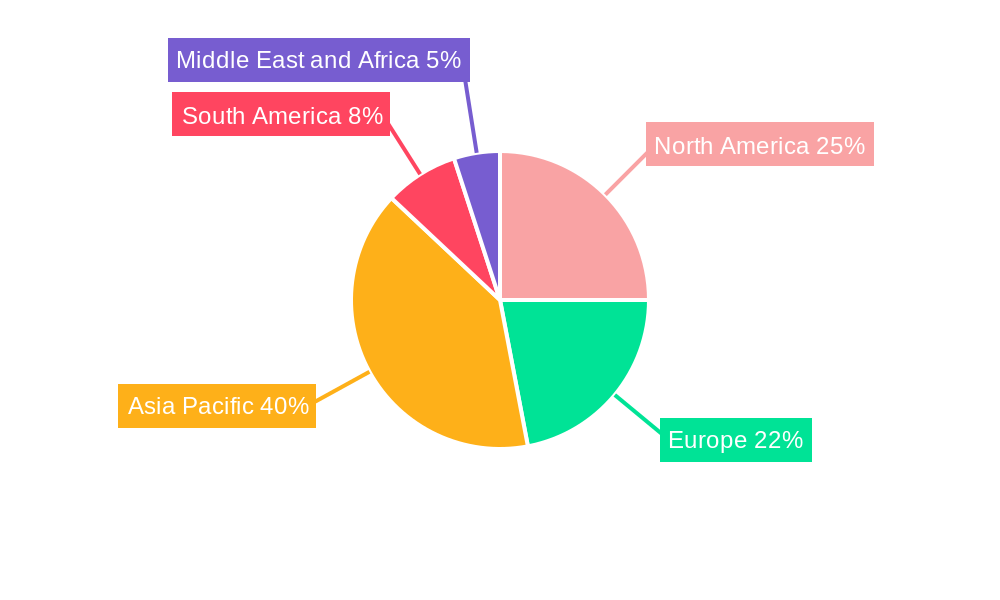
The global ethanolamines market is experiencing robust growth, projected to maintain a Compound Annual Growth Rate (CAGR) exceeding 4% from 2025 to 2033. This expansion is driven by increasing demand across diverse end-use industries. The agricultural sector utilizes ethanolamines extensively in pesticides and herbicides, while the construction industry employs them in concrete admixtures and other building materials. The personal care sector leverages their properties in cosmetics and toiletries, further fueling market growth. Significant applications in oil and gas extraction (as corrosion inhibitors and emulsifiers), metallurgy (in metalworking fluids), and textiles (as detergents and dyeing auxiliaries) also contribute substantially to market volume. Growth is further stimulated by ongoing technological advancements leading to the development of more efficient and environmentally friendly ethanolamine-based products. Competition among major players like BASF SE, Dow, and Ineos, coupled with ongoing research and development, ensures a continuous stream of innovation within the market. However, fluctuations in raw material prices and stringent environmental regulations present potential challenges. The Asia-Pacific region, particularly China and India, is expected to dominate the market owing to rapid industrialization and expanding applications in various sectors.
The market segmentation reveals a significant contribution from Monoethanolamine (MEA), driven by its extensive use in gas purification and other industrial processes. Diethanolamine (DEA) and Triethanolamine (TEA) also hold substantial market shares, with their applications spanning diverse sectors. Future growth will likely be shaped by the increasing emphasis on sustainable practices and the development of bio-based ethanolamines. The ongoing trend towards eco-friendly products will present both opportunities and challenges for manufacturers, requiring them to adapt and innovate to meet evolving regulatory requirements and consumer preferences. This will involve investments in research and development focused on reducing the environmental impact of production and developing new applications for ethanolamines in areas such as renewable energy and sustainable agriculture.
Ethanolamines Industry: A Comprehensive Market Analysis (2019-2033)
This detailed report provides a comprehensive analysis of the global ethanolamines industry, covering market size, growth drivers, key players, and future trends from 2019 to 2033. The study period spans 2019-2033, with 2025 serving as both the base and estimated year. The report offers actionable insights for industry stakeholders, including manufacturers, investors, and researchers. It features detailed segmentation by product type (Monoethanolamine (MEA), Diethanolamine (DEA), Triethanolamine (TEA)) and end-user industry (Agriculture, Construction, Personal Care, Oil and Gas, Metallurgy and Metalworking, Textile, Other End-user Industries). The report leverages extensive primary and secondary research to deliver reliable market forecasts and in-depth analysis.
Ethanolamines Industry Market Concentration & Innovation
The global ethanolamines market exhibits a moderately concentrated structure, with a few major players holding significant market share. While exact figures vary by region and product type, the top ten companies likely account for approximately 70% of global production. Companies like BASF SE, Dow, and INEOS are recognized industry leaders, leveraging their extensive production capabilities and established distribution networks. Market concentration is influenced by economies of scale in production and significant barriers to entry due to high capital investment requirements. Innovation in ethanolamines is driven by the need for enhanced performance characteristics in existing applications and the development of new applications across diverse end-user sectors.
- Market Share: BASF SE, Dow, and INEOS collectively hold an estimated xx% market share.
- Innovation Drivers: Sustainability concerns (e.g., bio-based ethanolamines), improved efficiency in existing applications (e.g., enhanced corrosion inhibitors), and expansion into emerging applications (e.g., advanced materials).
- Regulatory Frameworks: Environmental regulations concerning emissions and waste disposal significantly impact production costs and manufacturing processes.
- Product Substitutes: Limited direct substitutes exist; however, alternative chemicals with similar functionalities (e.g., certain amines) may pose indirect competitive pressure in specific applications.
- M&A Activities: Recent years have witnessed several strategic partnerships and acquisitions focused on expanding production capacity and geographical reach. The total value of M&A deals in the last five years is estimated at $xx Million. Examples include BASF’s expansion initiatives.
Ethanolamines Industry Industry Trends & Insights
The global ethanolamines market is poised for steady growth during the forecast period (2025-2033). Driven by increasing demand across various end-use sectors, particularly in the oil and gas, personal care, and construction industries, the market is projected to register a Compound Annual Growth Rate (CAGR) of xx% during this period. Growth is being fueled by several factors including rising global construction activity, the increasing use of ethanolamines in personal care products, and ongoing exploration and production in the oil and gas industry.
Technological advancements are enhancing the efficiency and sustainability of ethanolamine production. Emerging applications in areas such as advanced materials and renewable energy further support market expansion. Consumer preference towards natural and sustainable products is influencing the demand for ethanolamines derived from renewable feedstock. Competitive dynamics are characterized by intense rivalry amongst established players, with companies focused on capacity expansion, product diversification, and strategic partnerships to maintain market share. Market penetration of bio-based ethanolamines is expected to grow to xx% by 2033.
Dominant Markets & Segments in Ethanolamines Industry
The Asia-Pacific region currently dominates the global ethanolamines market, driven by rapid industrialization, urbanization, and robust economic growth in countries like China and India. This region’s dominance is further supported by substantial investments in infrastructure development and increasing demand from key end-user sectors. Within product types, Triethanolamine (TEA) holds the largest market share due to its wide range of applications, including personal care products and metalworking fluids. Similarly, the oil and gas industry is the largest end-user segment, owing to the extensive use of ethanolamines in gas sweetening processes.
- Key Drivers of Asia-Pacific Dominance:
- Rapid industrialization and urbanization.
- Rising disposable incomes and consumption patterns.
- Significant investments in infrastructure development.
- Increasing demand from diverse end-user sectors.
- Favorable government policies supporting industrial growth.
The dominance of TEA and the oil and gas segment is expected to continue throughout the forecast period. However, the MEA segment is also projected for significant growth due to its increasing applications in the agriculture sector.
Ethanolamines Industry Product Developments
Recent product innovations focus on enhancing the performance and sustainability of ethanolamines. These developments include the introduction of bio-based ethanolamines derived from renewable sources, improving their environmental profile. The industry is also witnessing advancements in formulations to enhance the efficiency and effectiveness of ethanolamines in various applications, leading to cost reductions and improved performance. This continuous innovation ensures that ethanolamines remain competitive and meet the evolving needs of various end-user industries.
Report Scope & Segmentation Analysis
This report offers a comprehensive segmentation of the ethanolamines market based on product type and end-user industry.
Product Type:
- Monoethanolamine (MEA): The MEA segment exhibits a steady growth trajectory, driven by its applications in the agriculture and gas sweetening sectors. The market size is estimated to be $xx Million in 2025.
- Diethanolamine (DEA): The DEA segment is characterized by a moderate growth rate, with applications in personal care products and metalworking fluids contributing significantly. Market size in 2025: $xx Million.
- Triethanolamine (TEA): The TEA segment holds the largest market share due to its diverse applications. It is anticipated to grow at a xx% CAGR. Market size in 2025: $xx Million.
End-User Industry:
- Oil and Gas: This segment represents the largest end-user application, driven by the extensive use of ethanolamines in gas sweetening and other processes.
- Personal Care: Growing demand for personal care products fuels substantial growth in this segment.
- Construction: Increasing construction activity globally contributes to the demand for ethanolamines in construction chemicals.
- Other End-user Industries: This includes diverse applications in agriculture, metallurgy, textiles, and other sectors, showcasing the versatility of ethanolamines.
Key Drivers of Ethanolamines Industry Growth
Several factors contribute to the growth of the ethanolamines industry. The expansion of the oil and gas sector, coupled with increasing demand for gas sweetening, is a major driver. The growing personal care industry, with its focus on innovative formulations, also contributes substantially. Furthermore, rising construction activity worldwide fuels the demand for ethanolamines in construction chemicals. Finally, ongoing technological innovations are leading to improved product formulations and enhanced applications, further driving industry growth.
Challenges in the Ethanolamines Industry Sector
The ethanolamines industry faces challenges including fluctuating raw material prices, stringent environmental regulations leading to increased production costs, and intense competition among established players. Supply chain disruptions can impact production schedules and profitability. Additionally, emerging technologies and alternative solutions pose ongoing competitive pressures, requiring continuous innovation to maintain market share. These factors necessitate strategic planning and adaptive measures to ensure sustained growth.
Emerging Opportunities in Ethanolamines Industry
Emerging opportunities lie in the development of bio-based ethanolamines, driven by increasing concerns about environmental sustainability. Expanding into new applications, such as advanced materials and renewable energy technologies, presents significant growth potential. Moreover, exploring new geographic markets and addressing specific end-user needs can open up additional revenue streams. Strategic partnerships and collaborations can further enhance market penetration and competitive advantage.
Leading Players in the Ethanolamines Industry Market
- Sintez OKA Group of Companies
- Indorama Ventures Limited
- China Petrochemical Corporation
- Nouryon
- INEOS
- OUCC
- BASF SE
- LyondellBasell Industries Holdings B V
- SABIC
- Dow
- Jiaxing Jinyan Chemical Co Ltd
Key Developments in Ethanolamines Industry Industry
- March 2022: BASF builds a new plant for alkyl ethanolamines at the Antwerp site, increasing its global alkyl ethanolamine capacity to 140,000 metric tons per year. This expansion significantly enhances BASF's production capacity and strengthens its market position.
- April 2022: BASF and SINOPEC announced the expansion of the Verbund site run by BASF-YPC Co., Ltd., a 50/50 joint venture in Nanjing. This capacity increase for ethanolamines and other chemicals solidifies the partnership’s market presence and enhances their production capabilities.
Strategic Outlook for Ethanolamines Industry Market
The ethanolamines market is poised for continued growth driven by several key factors. Expanding applications in diverse industries, coupled with a focus on sustainable and innovative product development, offer significant growth potential. Strategic partnerships, capacity expansions, and exploration of new geographical markets will be crucial for companies to capitalize on these opportunities and achieve sustainable growth in the coming years. The increasing emphasis on sustainability and the development of bio-based ethanolamines will further shape the market landscape.
Ethanolamines Industry Segmentation
-
1. Product Type
- 1.1. Monoethanolamine (MEA)
- 1.2. Diethanolamine (DEA)
- 1.3. Triethanolamine (TEA)
-
2. End-user Industry
- 2.1. Agriculture
- 2.2. Construction
- 2.3. Personal Care
- 2.4. Oil and Gas
- 2.5. Metallurgy and Metalworking
- 2.6. Textile
- 2.7. Other End-user Industries
Ethanolamines Industry Segmentation By Geography
-
1. Asia Pacific
- 1.1. China
- 1.2. India
- 1.3. Japan
- 1.4. South Korea
- 1.5. Rest of Asia Pacific
-
2. North America
- 2.1. United States
- 2.2. Canada
- 2.3. Mexico
-
3. Europe
- 3.1. Germany
- 3.2. United Kingdom
- 3.3. Italy
- 3.4. France
- 3.5. Rest of Europe
-
4. South America
- 4.1. Brazil
- 4.2. Argentina
- 4.3. Rest of South America
-
5. Middle East and Africa
- 5.1. Saudi Arabia
- 5.2. South Africa
- 5.3. Rest of Middle East and Africa
Ethanolamines Industry REPORT HIGHLIGHTS
| Aspects | Details |
|---|---|
| Study Period | 2019-2033 |
| Base Year | 2024 |
| Estimated Year | 2025 |
| Forecast Period | 2025-2033 |
| Historical Period | 2019-2024 |
| Growth Rate | CAGR of > 4.00% from 2019-2033 |
| Segmentation |
|
Table of Contents
- 1. Introduction
- 1.1. Research Scope
- 1.2. Market Segmentation
- 1.3. Research Methodology
- 1.4. Definitions and Assumptions
- 2. Executive Summary
- 2.1. Introduction
- 3. Market Dynamics
- 3.1. Introduction
- 3.2. Market Drivers
- 3.2.1. Rapid Industrialization Across the Globe; Growing Construction Activities in the Asia-Pacific Region
- 3.3. Market Restrains
- 3.3.1. Increasing Weed Resistance to Weaken the Demand for Glyphosate
- 3.4. Market Trends
- 3.4.1. Expanding Metallurgy and Metalworking Sector
- 4. Market Factor Analysis
- 4.1. Porters Five Forces
- 4.2. Supply/Value Chain
- 4.3. PESTEL analysis
- 4.4. Market Entropy
- 4.5. Patent/Trademark Analysis
- 5. Global Ethanolamines Industry Analysis, Insights and Forecast, 2019-2031
- 5.1. Market Analysis, Insights and Forecast - by Product Type
- 5.1.1. Monoethanolamine (MEA)
- 5.1.2. Diethanolamine (DEA)
- 5.1.3. Triethanolamine (TEA)
- 5.2. Market Analysis, Insights and Forecast - by End-user Industry
- 5.2.1. Agriculture
- 5.2.2. Construction
- 5.2.3. Personal Care
- 5.2.4. Oil and Gas
- 5.2.5. Metallurgy and Metalworking
- 5.2.6. Textile
- 5.2.7. Other End-user Industries
- 5.3. Market Analysis, Insights and Forecast - by Region
- 5.3.1. Asia Pacific
- 5.3.2. North America
- 5.3.3. Europe
- 5.3.4. South America
- 5.3.5. Middle East and Africa
- 5.1. Market Analysis, Insights and Forecast - by Product Type
- 6. Asia Pacific Ethanolamines Industry Analysis, Insights and Forecast, 2019-2031
- 6.1. Market Analysis, Insights and Forecast - by Product Type
- 6.1.1. Monoethanolamine (MEA)
- 6.1.2. Diethanolamine (DEA)
- 6.1.3. Triethanolamine (TEA)
- 6.2. Market Analysis, Insights and Forecast - by End-user Industry
- 6.2.1. Agriculture
- 6.2.2. Construction
- 6.2.3. Personal Care
- 6.2.4. Oil and Gas
- 6.2.5. Metallurgy and Metalworking
- 6.2.6. Textile
- 6.2.7. Other End-user Industries
- 6.1. Market Analysis, Insights and Forecast - by Product Type
- 7. North America Ethanolamines Industry Analysis, Insights and Forecast, 2019-2031
- 7.1. Market Analysis, Insights and Forecast - by Product Type
- 7.1.1. Monoethanolamine (MEA)
- 7.1.2. Diethanolamine (DEA)
- 7.1.3. Triethanolamine (TEA)
- 7.2. Market Analysis, Insights and Forecast - by End-user Industry
- 7.2.1. Agriculture
- 7.2.2. Construction
- 7.2.3. Personal Care
- 7.2.4. Oil and Gas
- 7.2.5. Metallurgy and Metalworking
- 7.2.6. Textile
- 7.2.7. Other End-user Industries
- 7.1. Market Analysis, Insights and Forecast - by Product Type
- 8. Europe Ethanolamines Industry Analysis, Insights and Forecast, 2019-2031
- 8.1. Market Analysis, Insights and Forecast - by Product Type
- 8.1.1. Monoethanolamine (MEA)
- 8.1.2. Diethanolamine (DEA)
- 8.1.3. Triethanolamine (TEA)
- 8.2. Market Analysis, Insights and Forecast - by End-user Industry
- 8.2.1. Agriculture
- 8.2.2. Construction
- 8.2.3. Personal Care
- 8.2.4. Oil and Gas
- 8.2.5. Metallurgy and Metalworking
- 8.2.6. Textile
- 8.2.7. Other End-user Industries
- 8.1. Market Analysis, Insights and Forecast - by Product Type
- 9. South America Ethanolamines Industry Analysis, Insights and Forecast, 2019-2031
- 9.1. Market Analysis, Insights and Forecast - by Product Type
- 9.1.1. Monoethanolamine (MEA)
- 9.1.2. Diethanolamine (DEA)
- 9.1.3. Triethanolamine (TEA)
- 9.2. Market Analysis, Insights and Forecast - by End-user Industry
- 9.2.1. Agriculture
- 9.2.2. Construction
- 9.2.3. Personal Care
- 9.2.4. Oil and Gas
- 9.2.5. Metallurgy and Metalworking
- 9.2.6. Textile
- 9.2.7. Other End-user Industries
- 9.1. Market Analysis, Insights and Forecast - by Product Type
- 10. Middle East and Africa Ethanolamines Industry Analysis, Insights and Forecast, 2019-2031
- 10.1. Market Analysis, Insights and Forecast - by Product Type
- 10.1.1. Monoethanolamine (MEA)
- 10.1.2. Diethanolamine (DEA)
- 10.1.3. Triethanolamine (TEA)
- 10.2. Market Analysis, Insights and Forecast - by End-user Industry
- 10.2.1. Agriculture
- 10.2.2. Construction
- 10.2.3. Personal Care
- 10.2.4. Oil and Gas
- 10.2.5. Metallurgy and Metalworking
- 10.2.6. Textile
- 10.2.7. Other End-user Industries
- 10.1. Market Analysis, Insights and Forecast - by Product Type
- 11. Asia Pacific Ethanolamines Industry Analysis, Insights and Forecast, 2019-2031
- 11.1. Market Analysis, Insights and Forecast - By Country/Sub-region
- 11.1.1 China
- 11.1.2 India
- 11.1.3 Japan
- 11.1.4 South Korea
- 11.1.5 Rest of Asia Pacific
- 12. North America Ethanolamines Industry Analysis, Insights and Forecast, 2019-2031
- 12.1. Market Analysis, Insights and Forecast - By Country/Sub-region
- 12.1.1 United States
- 12.1.2 Canada
- 12.1.3 Mexico
- 13. Europe Ethanolamines Industry Analysis, Insights and Forecast, 2019-2031
- 13.1. Market Analysis, Insights and Forecast - By Country/Sub-region
- 13.1.1 Germany
- 13.1.2 United Kingdom
- 13.1.3 Italy
- 13.1.4 France
- 13.1.5 Rest of Europe
- 14. South America Ethanolamines Industry Analysis, Insights and Forecast, 2019-2031
- 14.1. Market Analysis, Insights and Forecast - By Country/Sub-region
- 14.1.1 Brazil
- 14.1.2 Argentina
- 14.1.3 Rest of South America
- 15. Middle East and Africa Ethanolamines Industry Analysis, Insights and Forecast, 2019-2031
- 15.1. Market Analysis, Insights and Forecast - By Country/Sub-region
- 15.1.1 Saudi Arabia
- 15.1.2 South Africa
- 15.1.3 Rest of Middle East and Africa
- 16. Competitive Analysis
- 16.1. Global Market Share Analysis 2024
- 16.2. Company Profiles
- 16.2.1 Sintez OKA Group of Companies
- 16.2.1.1. Overview
- 16.2.1.2. Products
- 16.2.1.3. SWOT Analysis
- 16.2.1.4. Recent Developments
- 16.2.1.5. Financials (Based on Availability)
- 16.2.2 Indorama Ventures Limited
- 16.2.2.1. Overview
- 16.2.2.2. Products
- 16.2.2.3. SWOT Analysis
- 16.2.2.4. Recent Developments
- 16.2.2.5. Financials (Based on Availability)
- 16.2.3 China Petrochemical Corporation
- 16.2.3.1. Overview
- 16.2.3.2. Products
- 16.2.3.3. SWOT Analysis
- 16.2.3.4. Recent Developments
- 16.2.3.5. Financials (Based on Availability)
- 16.2.4 Nouryon
- 16.2.4.1. Overview
- 16.2.4.2. Products
- 16.2.4.3. SWOT Analysis
- 16.2.4.4. Recent Developments
- 16.2.4.5. Financials (Based on Availability)
- 16.2.5 INEOS
- 16.2.5.1. Overview
- 16.2.5.2. Products
- 16.2.5.3. SWOT Analysis
- 16.2.5.4. Recent Developments
- 16.2.5.5. Financials (Based on Availability)
- 16.2.6 OUCC
- 16.2.6.1. Overview
- 16.2.6.2. Products
- 16.2.6.3. SWOT Analysis
- 16.2.6.4. Recent Developments
- 16.2.6.5. Financials (Based on Availability)
- 16.2.7 BASF SE
- 16.2.7.1. Overview
- 16.2.7.2. Products
- 16.2.7.3. SWOT Analysis
- 16.2.7.4. Recent Developments
- 16.2.7.5. Financials (Based on Availability)
- 16.2.8 LyondellBasell Industries Holdings B V
- 16.2.8.1. Overview
- 16.2.8.2. Products
- 16.2.8.3. SWOT Analysis
- 16.2.8.4. Recent Developments
- 16.2.8.5. Financials (Based on Availability)
- 16.2.9 SABIC
- 16.2.9.1. Overview
- 16.2.9.2. Products
- 16.2.9.3. SWOT Analysis
- 16.2.9.4. Recent Developments
- 16.2.9.5. Financials (Based on Availability)
- 16.2.10 Dow
- 16.2.10.1. Overview
- 16.2.10.2. Products
- 16.2.10.3. SWOT Analysis
- 16.2.10.4. Recent Developments
- 16.2.10.5. Financials (Based on Availability)
- 16.2.11 Jiaxing Jinyan Chemical Co Ltd
- 16.2.11.1. Overview
- 16.2.11.2. Products
- 16.2.11.3. SWOT Analysis
- 16.2.11.4. Recent Developments
- 16.2.11.5. Financials (Based on Availability)
- 16.2.1 Sintez OKA Group of Companies
List of Figures
- Figure 1: Global Ethanolamines Industry Revenue Breakdown (Million, %) by Region 2024 & 2032
- Figure 2: Asia Pacific Ethanolamines Industry Revenue (Million), by Country 2024 & 2032
- Figure 3: Asia Pacific Ethanolamines Industry Revenue Share (%), by Country 2024 & 2032
- Figure 4: North America Ethanolamines Industry Revenue (Million), by Country 2024 & 2032
- Figure 5: North America Ethanolamines Industry Revenue Share (%), by Country 2024 & 2032
- Figure 6: Europe Ethanolamines Industry Revenue (Million), by Country 2024 & 2032
- Figure 7: Europe Ethanolamines Industry Revenue Share (%), by Country 2024 & 2032
- Figure 8: South America Ethanolamines Industry Revenue (Million), by Country 2024 & 2032
- Figure 9: South America Ethanolamines Industry Revenue Share (%), by Country 2024 & 2032
- Figure 10: Middle East and Africa Ethanolamines Industry Revenue (Million), by Country 2024 & 2032
- Figure 11: Middle East and Africa Ethanolamines Industry Revenue Share (%), by Country 2024 & 2032
- Figure 12: Asia Pacific Ethanolamines Industry Revenue (Million), by Product Type 2024 & 2032
- Figure 13: Asia Pacific Ethanolamines Industry Revenue Share (%), by Product Type 2024 & 2032
- Figure 14: Asia Pacific Ethanolamines Industry Revenue (Million), by End-user Industry 2024 & 2032
- Figure 15: Asia Pacific Ethanolamines Industry Revenue Share (%), by End-user Industry 2024 & 2032
- Figure 16: Asia Pacific Ethanolamines Industry Revenue (Million), by Country 2024 & 2032
- Figure 17: Asia Pacific Ethanolamines Industry Revenue Share (%), by Country 2024 & 2032
- Figure 18: North America Ethanolamines Industry Revenue (Million), by Product Type 2024 & 2032
- Figure 19: North America Ethanolamines Industry Revenue Share (%), by Product Type 2024 & 2032
- Figure 20: North America Ethanolamines Industry Revenue (Million), by End-user Industry 2024 & 2032
- Figure 21: North America Ethanolamines Industry Revenue Share (%), by End-user Industry 2024 & 2032
- Figure 22: North America Ethanolamines Industry Revenue (Million), by Country 2024 & 2032
- Figure 23: North America Ethanolamines Industry Revenue Share (%), by Country 2024 & 2032
- Figure 24: Europe Ethanolamines Industry Revenue (Million), by Product Type 2024 & 2032
- Figure 25: Europe Ethanolamines Industry Revenue Share (%), by Product Type 2024 & 2032
- Figure 26: Europe Ethanolamines Industry Revenue (Million), by End-user Industry 2024 & 2032
- Figure 27: Europe Ethanolamines Industry Revenue Share (%), by End-user Industry 2024 & 2032
- Figure 28: Europe Ethanolamines Industry Revenue (Million), by Country 2024 & 2032
- Figure 29: Europe Ethanolamines Industry Revenue Share (%), by Country 2024 & 2032
- Figure 30: South America Ethanolamines Industry Revenue (Million), by Product Type 2024 & 2032
- Figure 31: South America Ethanolamines Industry Revenue Share (%), by Product Type 2024 & 2032
- Figure 32: South America Ethanolamines Industry Revenue (Million), by End-user Industry 2024 & 2032
- Figure 33: South America Ethanolamines Industry Revenue Share (%), by End-user Industry 2024 & 2032
- Figure 34: South America Ethanolamines Industry Revenue (Million), by Country 2024 & 2032
- Figure 35: South America Ethanolamines Industry Revenue Share (%), by Country 2024 & 2032
- Figure 36: Middle East and Africa Ethanolamines Industry Revenue (Million), by Product Type 2024 & 2032
- Figure 37: Middle East and Africa Ethanolamines Industry Revenue Share (%), by Product Type 2024 & 2032
- Figure 38: Middle East and Africa Ethanolamines Industry Revenue (Million), by End-user Industry 2024 & 2032
- Figure 39: Middle East and Africa Ethanolamines Industry Revenue Share (%), by End-user Industry 2024 & 2032
- Figure 40: Middle East and Africa Ethanolamines Industry Revenue (Million), by Country 2024 & 2032
- Figure 41: Middle East and Africa Ethanolamines Industry Revenue Share (%), by Country 2024 & 2032
List of Tables
- Table 1: Global Ethanolamines Industry Revenue Million Forecast, by Region 2019 & 2032
- Table 2: Global Ethanolamines Industry Revenue Million Forecast, by Product Type 2019 & 2032
- Table 3: Global Ethanolamines Industry Revenue Million Forecast, by End-user Industry 2019 & 2032
- Table 4: Global Ethanolamines Industry Revenue Million Forecast, by Region 2019 & 2032
- Table 5: Global Ethanolamines Industry Revenue Million Forecast, by Country 2019 & 2032
- Table 6: China Ethanolamines Industry Revenue (Million) Forecast, by Application 2019 & 2032
- Table 7: India Ethanolamines Industry Revenue (Million) Forecast, by Application 2019 & 2032
- Table 8: Japan Ethanolamines Industry Revenue (Million) Forecast, by Application 2019 & 2032
- Table 9: South Korea Ethanolamines Industry Revenue (Million) Forecast, by Application 2019 & 2032
- Table 10: Rest of Asia Pacific Ethanolamines Industry Revenue (Million) Forecast, by Application 2019 & 2032
- Table 11: Global Ethanolamines Industry Revenue Million Forecast, by Country 2019 & 2032
- Table 12: United States Ethanolamines Industry Revenue (Million) Forecast, by Application 2019 & 2032
- Table 13: Canada Ethanolamines Industry Revenue (Million) Forecast, by Application 2019 & 2032
- Table 14: Mexico Ethanolamines Industry Revenue (Million) Forecast, by Application 2019 & 2032
- Table 15: Global Ethanolamines Industry Revenue Million Forecast, by Country 2019 & 2032
- Table 16: Germany Ethanolamines Industry Revenue (Million) Forecast, by Application 2019 & 2032
- Table 17: United Kingdom Ethanolamines Industry Revenue (Million) Forecast, by Application 2019 & 2032
- Table 18: Italy Ethanolamines Industry Revenue (Million) Forecast, by Application 2019 & 2032
- Table 19: France Ethanolamines Industry Revenue (Million) Forecast, by Application 2019 & 2032
- Table 20: Rest of Europe Ethanolamines Industry Revenue (Million) Forecast, by Application 2019 & 2032
- Table 21: Global Ethanolamines Industry Revenue Million Forecast, by Country 2019 & 2032
- Table 22: Brazil Ethanolamines Industry Revenue (Million) Forecast, by Application 2019 & 2032
- Table 23: Argentina Ethanolamines Industry Revenue (Million) Forecast, by Application 2019 & 2032
- Table 24: Rest of South America Ethanolamines Industry Revenue (Million) Forecast, by Application 2019 & 2032
- Table 25: Global Ethanolamines Industry Revenue Million Forecast, by Country 2019 & 2032
- Table 26: Saudi Arabia Ethanolamines Industry Revenue (Million) Forecast, by Application 2019 & 2032
- Table 27: South Africa Ethanolamines Industry Revenue (Million) Forecast, by Application 2019 & 2032
- Table 28: Rest of Middle East and Africa Ethanolamines Industry Revenue (Million) Forecast, by Application 2019 & 2032
- Table 29: Global Ethanolamines Industry Revenue Million Forecast, by Product Type 2019 & 2032
- Table 30: Global Ethanolamines Industry Revenue Million Forecast, by End-user Industry 2019 & 2032
- Table 31: Global Ethanolamines Industry Revenue Million Forecast, by Country 2019 & 2032
- Table 32: China Ethanolamines Industry Revenue (Million) Forecast, by Application 2019 & 2032
- Table 33: India Ethanolamines Industry Revenue (Million) Forecast, by Application 2019 & 2032
- Table 34: Japan Ethanolamines Industry Revenue (Million) Forecast, by Application 2019 & 2032
- Table 35: South Korea Ethanolamines Industry Revenue (Million) Forecast, by Application 2019 & 2032
- Table 36: Rest of Asia Pacific Ethanolamines Industry Revenue (Million) Forecast, by Application 2019 & 2032
- Table 37: Global Ethanolamines Industry Revenue Million Forecast, by Product Type 2019 & 2032
- Table 38: Global Ethanolamines Industry Revenue Million Forecast, by End-user Industry 2019 & 2032
- Table 39: Global Ethanolamines Industry Revenue Million Forecast, by Country 2019 & 2032
- Table 40: United States Ethanolamines Industry Revenue (Million) Forecast, by Application 2019 & 2032
- Table 41: Canada Ethanolamines Industry Revenue (Million) Forecast, by Application 2019 & 2032
- Table 42: Mexico Ethanolamines Industry Revenue (Million) Forecast, by Application 2019 & 2032
- Table 43: Global Ethanolamines Industry Revenue Million Forecast, by Product Type 2019 & 2032
- Table 44: Global Ethanolamines Industry Revenue Million Forecast, by End-user Industry 2019 & 2032
- Table 45: Global Ethanolamines Industry Revenue Million Forecast, by Country 2019 & 2032
- Table 46: Germany Ethanolamines Industry Revenue (Million) Forecast, by Application 2019 & 2032
- Table 47: United Kingdom Ethanolamines Industry Revenue (Million) Forecast, by Application 2019 & 2032
- Table 48: Italy Ethanolamines Industry Revenue (Million) Forecast, by Application 2019 & 2032
- Table 49: France Ethanolamines Industry Revenue (Million) Forecast, by Application 2019 & 2032
- Table 50: Rest of Europe Ethanolamines Industry Revenue (Million) Forecast, by Application 2019 & 2032
- Table 51: Global Ethanolamines Industry Revenue Million Forecast, by Product Type 2019 & 2032
- Table 52: Global Ethanolamines Industry Revenue Million Forecast, by End-user Industry 2019 & 2032
- Table 53: Global Ethanolamines Industry Revenue Million Forecast, by Country 2019 & 2032
- Table 54: Brazil Ethanolamines Industry Revenue (Million) Forecast, by Application 2019 & 2032
- Table 55: Argentina Ethanolamines Industry Revenue (Million) Forecast, by Application 2019 & 2032
- Table 56: Rest of South America Ethanolamines Industry Revenue (Million) Forecast, by Application 2019 & 2032
- Table 57: Global Ethanolamines Industry Revenue Million Forecast, by Product Type 2019 & 2032
- Table 58: Global Ethanolamines Industry Revenue Million Forecast, by End-user Industry 2019 & 2032
- Table 59: Global Ethanolamines Industry Revenue Million Forecast, by Country 2019 & 2032
- Table 60: Saudi Arabia Ethanolamines Industry Revenue (Million) Forecast, by Application 2019 & 2032
- Table 61: South Africa Ethanolamines Industry Revenue (Million) Forecast, by Application 2019 & 2032
- Table 62: Rest of Middle East and Africa Ethanolamines Industry Revenue (Million) Forecast, by Application 2019 & 2032
Frequently Asked Questions
1. What is the projected Compound Annual Growth Rate (CAGR) of the Ethanolamines Industry?
The projected CAGR is approximately > 4.00%.
2. Which companies are prominent players in the Ethanolamines Industry?
Key companies in the market include Sintez OKA Group of Companies, Indorama Ventures Limited, China Petrochemical Corporation, Nouryon, INEOS, OUCC, BASF SE, LyondellBasell Industries Holdings B V, SABIC, Dow, Jiaxing Jinyan Chemical Co Ltd.
3. What are the main segments of the Ethanolamines Industry?
The market segments include Product Type, End-user Industry.
4. Can you provide details about the market size?
The market size is estimated to be USD XX Million as of 2022.
5. What are some drivers contributing to market growth?
Rapid Industrialization Across the Globe; Growing Construction Activities in the Asia-Pacific Region.
6. What are the notable trends driving market growth?
Expanding Metallurgy and Metalworking Sector.
7. Are there any restraints impacting market growth?
Increasing Weed Resistance to Weaken the Demand for Glyphosate.
8. Can you provide examples of recent developments in the market?
April 2022: BASF and SINOPEC announced the expansion of the Verbund site run by BASF-YPC Co., Ltd. (BASF-YPC), a 50-50 joint venture of both firms in Nanjing. The joint venture partners will increase the capacity for producing ethanolamines and other chemicals.
9. What pricing options are available for accessing the report?
Pricing options include single-user, multi-user, and enterprise licenses priced at USD 4750, USD 5250, and USD 8750 respectively.
10. Is the market size provided in terms of value or volume?
The market size is provided in terms of value, measured in Million.
11. Are there any specific market keywords associated with the report?
Yes, the market keyword associated with the report is "Ethanolamines Industry," which aids in identifying and referencing the specific market segment covered.
12. How do I determine which pricing option suits my needs best?
The pricing options vary based on user requirements and access needs. Individual users may opt for single-user licenses, while businesses requiring broader access may choose multi-user or enterprise licenses for cost-effective access to the report.
13. Are there any additional resources or data provided in the Ethanolamines Industry report?
While the report offers comprehensive insights, it's advisable to review the specific contents or supplementary materials provided to ascertain if additional resources or data are available.
14. How can I stay updated on further developments or reports in the Ethanolamines Industry?
To stay informed about further developments, trends, and reports in the Ethanolamines Industry, consider subscribing to industry newsletters, following relevant companies and organizations, or regularly checking reputable industry news sources and publications.
Methodology
Step 1 - Identification of Relevant Samples Size from Population Database


Step 2 - Approaches for Defining Global Market Size (Value, Volume* & Price*)

Note*: In applicable scenarios
Step 3 - Data Sources
Primary Research
- Web Analytics
- Survey Reports
- Research Institute
- Latest Research Reports
- Opinion Leaders
Secondary Research
- Annual Reports
- White Paper
- Latest Press Release
- Industry Association
- Paid Database
- Investor Presentations

Step 4 - Data Triangulation
Involves using different sources of information in order to increase the validity of a study
These sources are likely to be stakeholders in a program - participants, other researchers, program staff, other community members, and so on.
Then we put all data in single framework & apply various statistical tools to find out the dynamic on the market.
During the analysis stage, feedback from the stakeholder groups would be compared to determine areas of agreement as well as areas of divergence


