

Key Insights
The global Ferro Vanadium market is poised for significant growth, projected to reach an estimated $2413 million by 2025, driven by a robust 3% CAGR during the forecast period of 2025-2033. This expansion is primarily fueled by the increasing demand from key end-use industries, most notably construction, automotive and transportation, and oil and gas. The construction sector's reliance on high-strength steel alloys, where ferrovanadium acts as a crucial additive for enhancing mechanical properties, is a primary growth engine. Similarly, the automotive industry's pursuit of lighter yet stronger components to improve fuel efficiency and performance, coupled with the oil and gas sector's need for robust materials in challenging environments, further bolster market demand. Emerging applications in aerospace, seeking advanced alloys for critical components, also contribute to the sustained upward trajectory of the ferrovanadium market.
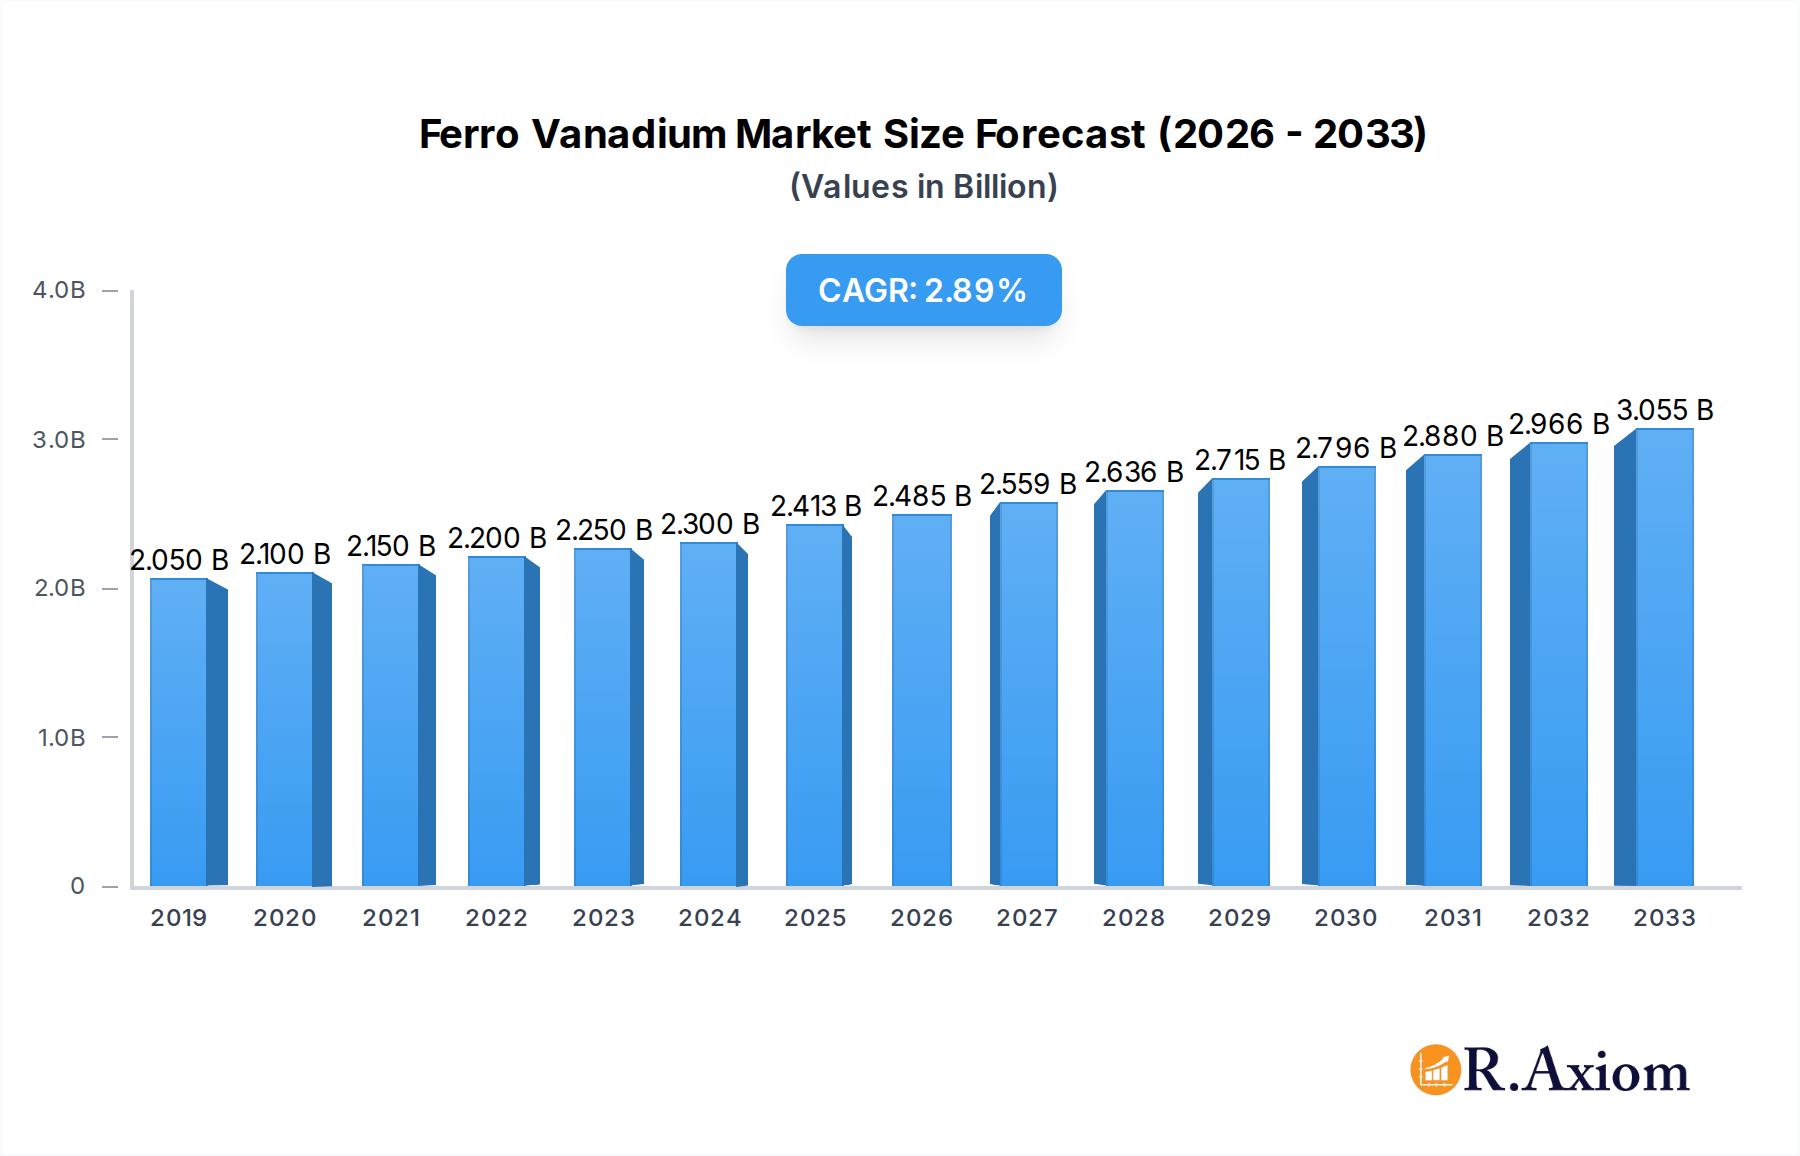
Ferro Vanadium Market Size (In Billion)
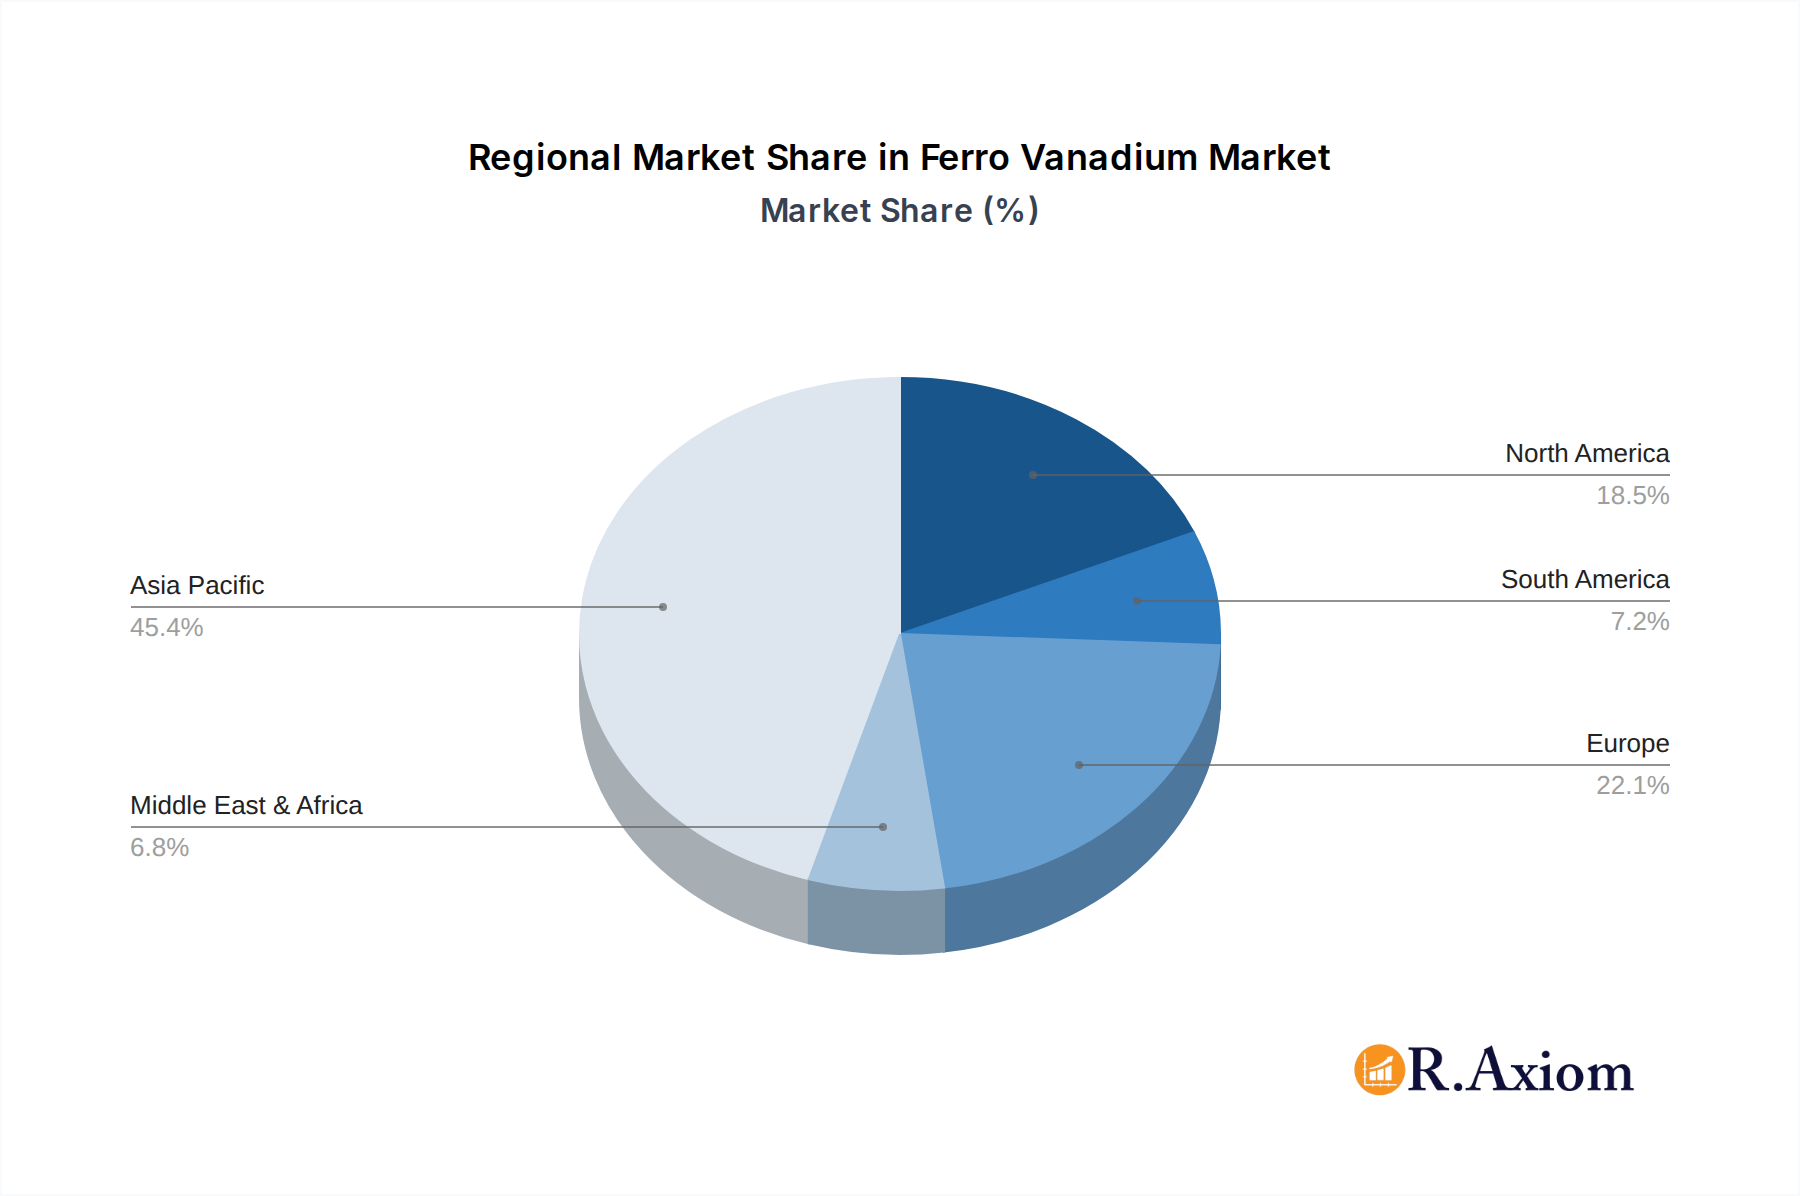
The market is characterized by distinct segments based on vanadium content, with 48%-60% and 70-85% vanadium content grades dominating demand due to their superior performance characteristics in high-alloy steel production. Geographically, Asia Pacific, led by China and India, is anticipated to be the largest and fastest-growing regional market, owing to rapid industrialization, burgeoning infrastructure development, and a strong manufacturing base. North America and Europe, with their established industrial sectors and advancements in metallurgy, also represent significant markets. While the market is experiencing healthy growth, potential restraints such as price volatility of raw materials and stringent environmental regulations related to vanadium extraction and processing may pose challenges. Nevertheless, ongoing technological advancements in ferrovanadium production and the development of new applications are expected to mitigate these restraints and propel the market forward.

Ferro Vanadium Company Market Share
Ferro Vanadium Market: Comprehensive Analysis and Future Outlook 2019-2033
This in-depth report provides a detailed analysis of the global Ferro Vanadium market, offering strategic insights and actionable intelligence for industry stakeholders. Covering a study period from 2019 to 2033, with a base and estimated year of 2025 and a forecast period of 2025-2033, this report delves into market dynamics, key players, trends, and future opportunities.
Ferro Vanadium Market Concentration & Innovation
The global Ferro Vanadium market exhibits a moderate to high level of concentration, with a few key players dominating production and supply. Major contributors such as Pangang, EVRAZ, HBIS Chengsteel, and Jinzhou Xinwanbo hold significant market share, driven by integrated mining and production capabilities. Innovation in the ferro vanadium sector is primarily focused on enhancing production efficiency, improving product purity, and developing specialized alloys for high-performance applications. Regulatory frameworks, including environmental standards and trade policies, play a crucial role in shaping market access and operational costs. For instance, stringent emissions regulations can necessitate significant capital expenditure for producers. Product substitutes, while limited for high-strength steel applications, include other alloying elements in specific niche markets. End-user trends are increasingly leaning towards lightweight and durable materials, particularly in the automotive and aerospace sectors, which is a significant driver for high-quality ferro vanadium. Mergers and acquisitions (M&A) activities, though not highly frequent, are strategic moves by larger players to consolidate market position, acquire advanced technologies, or secure raw material supply. Recent M&A deals have seen values estimated in the range of xx million to xx million, signaling consolidation potential within the sector. Market share distribution indicates that the top 5 companies collectively account for approximately 60% of the global production.
Ferro Vanadium Industry Trends & Insights
The Ferro Vanadium industry is poised for robust growth, driven by several interconnected trends and technological advancements. A projected Compound Annual Growth Rate (CAGR) of approximately 5.5% is anticipated over the forecast period. This growth is significantly fueled by the escalating demand for high-strength low-alloy (HSLA) steels, crucial for infrastructure development, automotive manufacturing, and energy exploration. The construction sector, in particular, is a major consumer, with an increasing emphasis on building stronger, more durable structures that can withstand harsh environmental conditions. The automotive and transportation industries are witnessing a paradigm shift towards lightweighting vehicles to improve fuel efficiency and reduce emissions. Ferro vanadium's ability to enhance steel's strength-to-weight ratio makes it an indispensable component in this pursuit. Market penetration in emerging economies is expected to accelerate as these regions invest heavily in infrastructure projects and automotive production. Technological disruptions, such as advancements in vanadium extraction and refining processes, are contributing to improved product quality and cost-effectiveness. Furthermore, the growing interest in advanced battery technologies, where vanadium plays a role in flow batteries, presents a nascent but significant future growth avenue, potentially increasing market penetration by an additional 2% to 3% by 2033. Consumer preferences are increasingly aligning with sustainability and performance. Manufacturers are seeking materials that offer longevity, reduce lifecycle costs, and contribute to environmental goals. Competitive dynamics are characterized by a blend of large, vertically integrated players and specialized alloy producers. Strategic partnerships and supply chain optimization are becoming critical for maintaining competitive advantage. The increasing adoption of electric vehicles (EVs) also indirectly benefits ferro vanadium demand through the use of lighter, stronger chassis components. The global market size for ferro vanadium is projected to reach over xx million by 2033, a substantial increase from the xx million recorded in 2023.
Dominant Markets & Segments in Ferro Vanadium
The Asia-Pacific region stands out as the dominant market for Ferro Vanadium, driven by its colossal manufacturing base and extensive infrastructure development initiatives, particularly in China. Within this region, China leads by a significant margin, accounting for an estimated 45% of global ferro vanadium consumption. Key drivers for this dominance include government policies promoting industrial growth, substantial investments in high-speed rail networks, and the burgeoning automotive sector.
Application Segments:
- Construction: This segment is a primary demand driver, fueled by massive urbanization and infrastructure projects. The use of HSLA steels in bridges, high-rise buildings, and heavy machinery construction requires significant quantities of ferro vanadium for enhanced strength and durability. Economic policies supporting infrastructure spending are critical for this segment's growth.
- Automotive and Transportation: The automotive sector's focus on lightweighting for fuel efficiency and emission reduction makes ferro vanadium an essential alloying element. This is particularly relevant for structural components and chassis. Investments in vehicle production and evolving automotive designs are key factors.
- Oil and Gas: The exploration and transportation of oil and gas necessitate the use of robust steel pipes and drilling equipment capable of withstanding high pressures and corrosive environments. Demand in this segment is closely tied to global energy prices and exploration activities.
- Aerospace: While a smaller segment in terms of volume, the aerospace industry's stringent requirements for high-performance alloys with exceptional strength-to-weight ratios make it a high-value market for specialized ferro vanadium grades. Advancements in aircraft design and manufacturing play a crucial role.
- Others: This segment encompasses various niche applications, including industrial machinery, tools, and renewable energy infrastructure. Growth here is often driven by specialized industrial needs and emerging technologies.
Type Segments (Vanadium Content):
- Vanadium content: 35%-48%: This grade is widely used in general steel production for structural applications where moderate strength enhancement is required. It represents a significant portion of the market due to its broad applicability.
- Vanadium content: 48%-60%: This intermediate grade offers a better balance of strength and cost, making it popular for a wider range of construction and automotive applications requiring higher performance than the lower content grades.
- Vanadium content: 70-85%: These high-purity grades are crucial for specialized applications in aerospace, high-performance automotive components, and certain industrial tools where superior strength, hardness, and wear resistance are paramount. Technological advancements in refining and alloy production are key for this segment.
The dominance of the Asia-Pacific, particularly China, in both production and consumption, coupled with the strong demand from the construction and automotive sectors, defines the current landscape of the ferro vanadium market.
Ferro Vanadium Product Developments
Recent product developments in the Ferro Vanadium market are centered around enhancing purity and optimizing alloy performance for specific end-use applications. Innovations in smelting and refining technologies are yielding ferro vanadium with higher vanadium content (up to 85%) and reduced impurities, leading to superior mechanical properties in steel. These advanced grades offer improved tensile strength, wear resistance, and corrosion protection, providing a competitive advantage to steel manufacturers in demanding sectors like aerospace and high-performance automotive. Furthermore, there's a growing focus on developing customized ferro vanadium alloys tailored to meet the evolving specifications of the renewable energy sector, particularly for advanced battery technologies.
Report Scope & Segmentation Analysis
This comprehensive report segments the global Ferro Vanadium market across key parameters including Application and Type (based on Vanadium content).
- Application Segments: The market is analyzed based on its adoption in Construction, Automotive and Transportation, Oil and Gas, Aerospace, and Others. Growth projections for these segments are closely tied to regional economic development, infrastructure spending, and technological advancements in respective industries.
- Type Segments: The report further dissects the market by Vanadium content, including grades ranging from 35%-48%, 48%-60%, and 70-85%. Each segment exhibits distinct growth trajectories influenced by specific application requirements and technological capabilities in production. The 48%-60% and 70-85% content segments are projected to experience higher growth rates due to increasing demand for specialized and high-performance steels.
Key Drivers of Ferro Vanadium Growth
The growth of the Ferro Vanadium market is propelled by several influential factors. Foremost is the increasing global demand for high-strength low-alloy (HSLA) steels, driven by the need for stronger, lighter, and more durable materials across various industries. The ongoing global infrastructure development boom, particularly in emerging economies, directly translates to a higher consumption of steel, and consequently, ferro vanadium. Furthermore, the automotive industry's push towards lightweighting vehicles for improved fuel efficiency and reduced emissions is a significant catalyst. Advancements in vanadium extraction and refining technologies are also playing a crucial role by improving production efficiency and product quality, making ferro vanadium more accessible and cost-effective. Finally, evolving regulatory landscapes promoting sustainable and efficient material usage indirectly favor the adoption of ferro vanadium in applications where longevity and performance are key.
Challenges in the Ferro Vanadium Sector
Despite its promising growth trajectory, the Ferro Vanadium sector faces several significant challenges. Price volatility of raw materials, particularly vanadium ore, can impact production costs and profitability. Supply chain disruptions, exacerbated by geopolitical factors and logistical complexities, pose a constant threat to consistent availability. Stringent environmental regulations and permitting processes associated with mining and metallurgical operations can increase compliance costs and limit production expansion. Furthermore, the availability and cost of viable product substitutes in certain niche applications, while limited for core uses, can exert competitive pressure. High capital investment requirements for establishing and maintaining production facilities also act as a barrier to entry for new players.
Emerging Opportunities in Ferro Vanadium
The Ferro Vanadium market is ripe with emerging opportunities. The growing adoption of vanadium redox flow batteries (VRFBs) for grid-scale energy storage presents a significant new demand avenue, driven by the global transition to renewable energy. Continued innovation in aerospace and advanced automotive applications is creating demand for ultra-high-purity ferro vanadium grades. There is also an emerging opportunity in developing specialized alloys for extreme environments, such as those encountered in deep-sea exploration or advanced manufacturing processes. Furthermore, recycling and valorization of vanadium-containing waste streams offer a sustainable and potentially cost-effective source of vanadium, aligning with circular economy principles.
Leading Players in the Ferro Vanadium Market
- Pangang
- EVRAZ
- HBIS Chengsteel
- Jinzhou Xinwanbo
- AMG
- Taiyo Koko
- JFE Material
- Hickman, Williams & Co
Key Developments in Ferro Vanadium Industry
- 2023 Q4: Pangang announces expansion plans for its ferro vanadium production capacity to meet rising demand from the automotive sector.
- 2023 Q3: EVRAZ completes a significant upgrade to its vanadium extraction technology, improving efficiency by 15%.
- 2023 Q2: HBIS Chengsteel secures long-term supply contracts with major steel manufacturers in Southeast Asia.
- 2023 Q1: AMG showcases a new high-purity ferro vanadium alloy designed for aerospace applications at a major industry exhibition.
- 2022 Q4: Jinzhou Xinwanbo invests in advanced environmental control technologies for its production facilities.
- 2022 Q3: Taiyo Koko reports increased demand for its specialized ferro vanadium products from the Japanese automotive industry.
- 2022 Q2: JFE Material collaborates with research institutions to explore new applications for vanadium alloys.
- 2022 Q1: Hickman, Williams & Co strengthens its distribution network in North America to better serve its customer base.
Strategic Outlook for Ferro Vanadium Market
The strategic outlook for the Ferro Vanadium market is overwhelmingly positive, underpinned by a confluence of sustained demand from core industries and promising new applications. The continued global focus on infrastructure development and the automotive sector's relentless pursuit of lightweighting will ensure robust demand for HSLA steels. The nascent but rapidly growing energy storage sector, with vanadium redox flow batteries at its forefront, presents a significant long-term growth catalyst. Strategic investments in research and development for higher-purity grades and customized alloys will unlock new market niches and enhance competitive positioning. Furthermore, a growing emphasis on sustainable practices and supply chain resilience will favor players with integrated operations and a commitment to environmental responsibility, charting a course for continued market expansion and innovation.
Ferro Vanadium Segmentation
-
1. Application
- 1.1. Construction
- 1.2. Automotive and Transportation
- 1.3. Oil and Gas
- 1.4. Aerospace
- 1.5. Others
-
2. Type
- 2.1. Vanadium content: 35%-48%
- 2.2. Vanadium content: 48%-60%
- 2.3. Vanadium content: 70-85%
Ferro Vanadium Segmentation By Geography
-
1. North America
- 1.1. United States
- 1.2. Canada
- 1.3. Mexico
-
2. South America
- 2.1. Brazil
- 2.2. Argentina
- 2.3. Rest of South America
-
3. Europe
- 3.1. United Kingdom
- 3.2. Germany
- 3.3. France
- 3.4. Italy
- 3.5. Spain
- 3.6. Russia
- 3.7. Benelux
- 3.8. Nordics
- 3.9. Rest of Europe
-
4. Middle East & Africa
- 4.1. Turkey
- 4.2. Israel
- 4.3. GCC
- 4.4. North Africa
- 4.5. South Africa
- 4.6. Rest of Middle East & Africa
-
5. Asia Pacific
- 5.1. China
- 5.2. India
- 5.3. Japan
- 5.4. South Korea
- 5.5. ASEAN
- 5.6. Oceania
- 5.7. Rest of Asia Pacific
Ferro Vanadium Regional Market Share
Geographic Coverage of Ferro Vanadium
Ferro Vanadium REPORT HIGHLIGHTS
| Aspects | Details |
|---|---|
| Study Period | 2020-2034 |
| Base Year | 2025 |
| Estimated Year | 2026 |
| Forecast Period | 2026-2034 |
| Historical Period | 2020-2025 |
| Growth Rate | CAGR of 3% from 2020-2034 |
| Segmentation |
|
Table of Contents
- 1. Introduction
- 1.1. Research Scope
- 1.2. Market Segmentation
- 1.3. Research Objective
- 1.4. Definitions and Assumptions
- 2. Executive Summary
- 2.1. Market Snapshot
- 3. Market Dynamics
- 3.1. Market Drivers
- 3.2. Market Restrains
- 3.3. Market Trends
- 3.4. Market Opportunities
- 4. Market Factor Analysis
- 4.1. Porters Five Forces
- 4.1.1. Bargaining Power of Suppliers
- 4.1.2. Bargaining Power of Buyers
- 4.1.3. Threat of New Entrants
- 4.1.4. Threat of Substitutes
- 4.1.5. Competitive Rivalry
- 4.2. PESTEL analysis
- 4.3. BCG Analysis
- 4.3.1. Stars (High Growth, High Market Share)
- 4.3.2. Cash Cows (Low Growth, High Market Share)
- 4.3.3. Question Mark (High Growth, Low Market Share)
- 4.3.4. Dogs (Low Growth, Low Market Share)
- 4.4. Ansoff Matrix Analysis
- 4.5. Supply Chain Analysis
- 4.6. Regulatory Landscape
- 4.7. Current Market Potential and Opportunity Assessment (TAM–SAM–SOM Framework)
- 4.8. RAX Analyst Note
- 4.1. Porters Five Forces
- 5. Market Analysis, Insights and Forecast 2021-2033
- 5.1. Market Analysis, Insights and Forecast - by Application
- 5.1.1. Construction
- 5.1.2. Automotive and Transportation
- 5.1.3. Oil and Gas
- 5.1.4. Aerospace
- 5.1.5. Others
- 5.2. Market Analysis, Insights and Forecast - by Type
- 5.2.1. Vanadium content: 35%-48%
- 5.2.2. Vanadium content: 48%-60%
- 5.2.3. Vanadium content: 70-85%
- 5.3. Market Analysis, Insights and Forecast - by Region
- 5.3.1. North America
- 5.3.2. South America
- 5.3.3. Europe
- 5.3.4. Middle East & Africa
- 5.3.5. Asia Pacific
- 5.1. Market Analysis, Insights and Forecast - by Application
- 6. Global Ferro Vanadium Analysis, Insights and Forecast, 2021-2033
- 6.1. Market Analysis, Insights and Forecast - by Application
- 6.1.1. Construction
- 6.1.2. Automotive and Transportation
- 6.1.3. Oil and Gas
- 6.1.4. Aerospace
- 6.1.5. Others
- 6.2. Market Analysis, Insights and Forecast - by Type
- 6.2.1. Vanadium content: 35%-48%
- 6.2.2. Vanadium content: 48%-60%
- 6.2.3. Vanadium content: 70-85%
- 6.1. Market Analysis, Insights and Forecast - by Application
- 7. North America Ferro Vanadium Analysis, Insights and Forecast, 2020-2032
- 7.1. Market Analysis, Insights and Forecast - by Application
- 7.1.1. Construction
- 7.1.2. Automotive and Transportation
- 7.1.3. Oil and Gas
- 7.1.4. Aerospace
- 7.1.5. Others
- 7.2. Market Analysis, Insights and Forecast - by Type
- 7.2.1. Vanadium content: 35%-48%
- 7.2.2. Vanadium content: 48%-60%
- 7.2.3. Vanadium content: 70-85%
- 7.1. Market Analysis, Insights and Forecast - by Application
- 8. South America Ferro Vanadium Analysis, Insights and Forecast, 2020-2032
- 8.1. Market Analysis, Insights and Forecast - by Application
- 8.1.1. Construction
- 8.1.2. Automotive and Transportation
- 8.1.3. Oil and Gas
- 8.1.4. Aerospace
- 8.1.5. Others
- 8.2. Market Analysis, Insights and Forecast - by Type
- 8.2.1. Vanadium content: 35%-48%
- 8.2.2. Vanadium content: 48%-60%
- 8.2.3. Vanadium content: 70-85%
- 8.1. Market Analysis, Insights and Forecast - by Application
- 9. Europe Ferro Vanadium Analysis, Insights and Forecast, 2020-2032
- 9.1. Market Analysis, Insights and Forecast - by Application
- 9.1.1. Construction
- 9.1.2. Automotive and Transportation
- 9.1.3. Oil and Gas
- 9.1.4. Aerospace
- 9.1.5. Others
- 9.2. Market Analysis, Insights and Forecast - by Type
- 9.2.1. Vanadium content: 35%-48%
- 9.2.2. Vanadium content: 48%-60%
- 9.2.3. Vanadium content: 70-85%
- 9.1. Market Analysis, Insights and Forecast - by Application
- 10. Middle East & Africa Ferro Vanadium Analysis, Insights and Forecast, 2020-2032
- 10.1. Market Analysis, Insights and Forecast - by Application
- 10.1.1. Construction
- 10.1.2. Automotive and Transportation
- 10.1.3. Oil and Gas
- 10.1.4. Aerospace
- 10.1.5. Others
- 10.2. Market Analysis, Insights and Forecast - by Type
- 10.2.1. Vanadium content: 35%-48%
- 10.2.2. Vanadium content: 48%-60%
- 10.2.3. Vanadium content: 70-85%
- 10.1. Market Analysis, Insights and Forecast - by Application
- 11. Asia Pacific Ferro Vanadium Analysis, Insights and Forecast, 2020-2032
- 11.1. Market Analysis, Insights and Forecast - by Application
- 11.1.1. Construction
- 11.1.2. Automotive and Transportation
- 11.1.3. Oil and Gas
- 11.1.4. Aerospace
- 11.1.5. Others
- 11.2. Market Analysis, Insights and Forecast - by Type
- 11.2.1. Vanadium content: 35%-48%
- 11.2.2. Vanadium content: 48%-60%
- 11.2.3. Vanadium content: 70-85%
- 11.1. Market Analysis, Insights and Forecast - by Application
- 12. Competitive Analysis
- 12.1. Company Profiles
- 12.1.1 Pangang
- 12.1.1.1. Company Overview
- 12.1.1.2. Products
- 12.1.1.3. Company Financials
- 12.1.1.4. SWOT Analysis
- 12.1.2 EVRAZ
- 12.1.2.1. Company Overview
- 12.1.2.2. Products
- 12.1.2.3. Company Financials
- 12.1.2.4. SWOT Analysis
- 12.1.3 HBIS Chengsteel
- 12.1.3.1. Company Overview
- 12.1.3.2. Products
- 12.1.3.3. Company Financials
- 12.1.3.4. SWOT Analysis
- 12.1.4 Jinzhou Xinwanbo
- 12.1.4.1. Company Overview
- 12.1.4.2. Products
- 12.1.4.3. Company Financials
- 12.1.4.4. SWOT Analysis
- 12.1.5 AMG
- 12.1.5.1. Company Overview
- 12.1.5.2. Products
- 12.1.5.3. Company Financials
- 12.1.5.4. SWOT Analysis
- 12.1.6 Taiyo Koko
- 12.1.6.1. Company Overview
- 12.1.6.2. Products
- 12.1.6.3. Company Financials
- 12.1.6.4. SWOT Analysis
- 12.1.7 JFE Material
- 12.1.7.1. Company Overview
- 12.1.7.2. Products
- 12.1.7.3. Company Financials
- 12.1.7.4. SWOT Analysis
- 12.1.8 HickmanWilliams & Co
- 12.1.8.1. Company Overview
- 12.1.8.2. Products
- 12.1.8.3. Company Financials
- 12.1.8.4. SWOT Analysis
- 12.1.1 Pangang
- 12.2. Market Entropy
- 12.2.1 Company's Key Areas Served
- 12.2.2 Recent Developments
- 12.3. Company Market Share Analysis 2025
- 12.3.1 Top 5 Companies Market Share Analysis
- 12.3.2 Top 3 Companies Market Share Analysis
- 12.4. List of Potential Customers
- 13. Research Methodology
List of Figures
- Figure 1: Global Ferro Vanadium Revenue Breakdown (million, %) by Region 2025 & 2033
- Figure 2: North America Ferro Vanadium Revenue (million), by Application 2025 & 2033
- Figure 3: North America Ferro Vanadium Revenue Share (%), by Application 2025 & 2033
- Figure 4: North America Ferro Vanadium Revenue (million), by Type 2025 & 2033
- Figure 5: North America Ferro Vanadium Revenue Share (%), by Type 2025 & 2033
- Figure 6: North America Ferro Vanadium Revenue (million), by Country 2025 & 2033
- Figure 7: North America Ferro Vanadium Revenue Share (%), by Country 2025 & 2033
- Figure 8: South America Ferro Vanadium Revenue (million), by Application 2025 & 2033
- Figure 9: South America Ferro Vanadium Revenue Share (%), by Application 2025 & 2033
- Figure 10: South America Ferro Vanadium Revenue (million), by Type 2025 & 2033
- Figure 11: South America Ferro Vanadium Revenue Share (%), by Type 2025 & 2033
- Figure 12: South America Ferro Vanadium Revenue (million), by Country 2025 & 2033
- Figure 13: South America Ferro Vanadium Revenue Share (%), by Country 2025 & 2033
- Figure 14: Europe Ferro Vanadium Revenue (million), by Application 2025 & 2033
- Figure 15: Europe Ferro Vanadium Revenue Share (%), by Application 2025 & 2033
- Figure 16: Europe Ferro Vanadium Revenue (million), by Type 2025 & 2033
- Figure 17: Europe Ferro Vanadium Revenue Share (%), by Type 2025 & 2033
- Figure 18: Europe Ferro Vanadium Revenue (million), by Country 2025 & 2033
- Figure 19: Europe Ferro Vanadium Revenue Share (%), by Country 2025 & 2033
- Figure 20: Middle East & Africa Ferro Vanadium Revenue (million), by Application 2025 & 2033
- Figure 21: Middle East & Africa Ferro Vanadium Revenue Share (%), by Application 2025 & 2033
- Figure 22: Middle East & Africa Ferro Vanadium Revenue (million), by Type 2025 & 2033
- Figure 23: Middle East & Africa Ferro Vanadium Revenue Share (%), by Type 2025 & 2033
- Figure 24: Middle East & Africa Ferro Vanadium Revenue (million), by Country 2025 & 2033
- Figure 25: Middle East & Africa Ferro Vanadium Revenue Share (%), by Country 2025 & 2033
- Figure 26: Asia Pacific Ferro Vanadium Revenue (million), by Application 2025 & 2033
- Figure 27: Asia Pacific Ferro Vanadium Revenue Share (%), by Application 2025 & 2033
- Figure 28: Asia Pacific Ferro Vanadium Revenue (million), by Type 2025 & 2033
- Figure 29: Asia Pacific Ferro Vanadium Revenue Share (%), by Type 2025 & 2033
- Figure 30: Asia Pacific Ferro Vanadium Revenue (million), by Country 2025 & 2033
- Figure 31: Asia Pacific Ferro Vanadium Revenue Share (%), by Country 2025 & 2033
List of Tables
- Table 1: Global Ferro Vanadium Revenue million Forecast, by Application 2020 & 2033
- Table 2: Global Ferro Vanadium Revenue million Forecast, by Type 2020 & 2033
- Table 3: Global Ferro Vanadium Revenue million Forecast, by Region 2020 & 2033
- Table 4: Global Ferro Vanadium Revenue million Forecast, by Application 2020 & 2033
- Table 5: Global Ferro Vanadium Revenue million Forecast, by Type 2020 & 2033
- Table 6: Global Ferro Vanadium Revenue million Forecast, by Country 2020 & 2033
- Table 7: United States Ferro Vanadium Revenue (million) Forecast, by Application 2020 & 2033
- Table 8: Canada Ferro Vanadium Revenue (million) Forecast, by Application 2020 & 2033
- Table 9: Mexico Ferro Vanadium Revenue (million) Forecast, by Application 2020 & 2033
- Table 10: Global Ferro Vanadium Revenue million Forecast, by Application 2020 & 2033
- Table 11: Global Ferro Vanadium Revenue million Forecast, by Type 2020 & 2033
- Table 12: Global Ferro Vanadium Revenue million Forecast, by Country 2020 & 2033
- Table 13: Brazil Ferro Vanadium Revenue (million) Forecast, by Application 2020 & 2033
- Table 14: Argentina Ferro Vanadium Revenue (million) Forecast, by Application 2020 & 2033
- Table 15: Rest of South America Ferro Vanadium Revenue (million) Forecast, by Application 2020 & 2033
- Table 16: Global Ferro Vanadium Revenue million Forecast, by Application 2020 & 2033
- Table 17: Global Ferro Vanadium Revenue million Forecast, by Type 2020 & 2033
- Table 18: Global Ferro Vanadium Revenue million Forecast, by Country 2020 & 2033
- Table 19: United Kingdom Ferro Vanadium Revenue (million) Forecast, by Application 2020 & 2033
- Table 20: Germany Ferro Vanadium Revenue (million) Forecast, by Application 2020 & 2033
- Table 21: France Ferro Vanadium Revenue (million) Forecast, by Application 2020 & 2033
- Table 22: Italy Ferro Vanadium Revenue (million) Forecast, by Application 2020 & 2033
- Table 23: Spain Ferro Vanadium Revenue (million) Forecast, by Application 2020 & 2033
- Table 24: Russia Ferro Vanadium Revenue (million) Forecast, by Application 2020 & 2033
- Table 25: Benelux Ferro Vanadium Revenue (million) Forecast, by Application 2020 & 2033
- Table 26: Nordics Ferro Vanadium Revenue (million) Forecast, by Application 2020 & 2033
- Table 27: Rest of Europe Ferro Vanadium Revenue (million) Forecast, by Application 2020 & 2033
- Table 28: Global Ferro Vanadium Revenue million Forecast, by Application 2020 & 2033
- Table 29: Global Ferro Vanadium Revenue million Forecast, by Type 2020 & 2033
- Table 30: Global Ferro Vanadium Revenue million Forecast, by Country 2020 & 2033
- Table 31: Turkey Ferro Vanadium Revenue (million) Forecast, by Application 2020 & 2033
- Table 32: Israel Ferro Vanadium Revenue (million) Forecast, by Application 2020 & 2033
- Table 33: GCC Ferro Vanadium Revenue (million) Forecast, by Application 2020 & 2033
- Table 34: North Africa Ferro Vanadium Revenue (million) Forecast, by Application 2020 & 2033
- Table 35: South Africa Ferro Vanadium Revenue (million) Forecast, by Application 2020 & 2033
- Table 36: Rest of Middle East & Africa Ferro Vanadium Revenue (million) Forecast, by Application 2020 & 2033
- Table 37: Global Ferro Vanadium Revenue million Forecast, by Application 2020 & 2033
- Table 38: Global Ferro Vanadium Revenue million Forecast, by Type 2020 & 2033
- Table 39: Global Ferro Vanadium Revenue million Forecast, by Country 2020 & 2033
- Table 40: China Ferro Vanadium Revenue (million) Forecast, by Application 2020 & 2033
- Table 41: India Ferro Vanadium Revenue (million) Forecast, by Application 2020 & 2033
- Table 42: Japan Ferro Vanadium Revenue (million) Forecast, by Application 2020 & 2033
- Table 43: South Korea Ferro Vanadium Revenue (million) Forecast, by Application 2020 & 2033
- Table 44: ASEAN Ferro Vanadium Revenue (million) Forecast, by Application 2020 & 2033
- Table 45: Oceania Ferro Vanadium Revenue (million) Forecast, by Application 2020 & 2033
- Table 46: Rest of Asia Pacific Ferro Vanadium Revenue (million) Forecast, by Application 2020 & 2033
Frequently Asked Questions
1. What is the projected Compound Annual Growth Rate (CAGR) of the Ferro Vanadium?
The projected CAGR is approximately 3%.
2. Which companies are prominent players in the Ferro Vanadium?
Key companies in the market include Pangang, EVRAZ, HBIS Chengsteel, Jinzhou Xinwanbo, AMG, Taiyo Koko, JFE Material, Hickman,Williams & Co.
3. What are the main segments of the Ferro Vanadium?
The market segments include Application, Type.
4. Can you provide details about the market size?
The market size is estimated to be USD 2413 million as of 2022.
5. What are some drivers contributing to market growth?
N/A
6. What are the notable trends driving market growth?
N/A
7. Are there any restraints impacting market growth?
N/A
8. Can you provide examples of recent developments in the market?
N/A
9. What pricing options are available for accessing the report?
Pricing options include single-user, multi-user, and enterprise licenses priced at USD 5900.00, USD 8850.00, and USD 11800.00 respectively.
10. Is the market size provided in terms of value or volume?
The market size is provided in terms of value, measured in million.
11. Are there any specific market keywords associated with the report?
Yes, the market keyword associated with the report is "Ferro Vanadium," which aids in identifying and referencing the specific market segment covered.
12. How do I determine which pricing option suits my needs best?
The pricing options vary based on user requirements and access needs. Individual users may opt for single-user licenses, while businesses requiring broader access may choose multi-user or enterprise licenses for cost-effective access to the report.
13. Are there any additional resources or data provided in the Ferro Vanadium report?
While the report offers comprehensive insights, it's advisable to review the specific contents or supplementary materials provided to ascertain if additional resources or data are available.
14. How can I stay updated on further developments or reports in the Ferro Vanadium?
To stay informed about further developments, trends, and reports in the Ferro Vanadium, consider subscribing to industry newsletters, following relevant companies and organizations, or regularly checking reputable industry news sources and publications.
Methodology
Step 1 - Identification of Relevant Samples Size from Population Database


Step 2 - Approaches for Defining Global Market Size (Value, Volume* & Price*)

Note*: In applicable scenarios
Step 3 - Data Sources
Primary Research
- Web Analytics
- Survey Reports
- Research Institute
- Latest Research Reports
- Opinion Leaders
Secondary Research
- Annual Reports
- White Paper
- Latest Press Release
- Industry Association
- Paid Database
- Investor Presentations

Step 4 - Data Triangulation
Involves using different sources of information in order to increase the validity of a study
These sources are likely to be stakeholders in a program - participants, other researchers, program staff, other community members, and so on.
Then we put all data in single framework & apply various statistical tools to find out the dynamic on the market.
During the analysis stage, feedback from the stakeholder groups would be compared to determine areas of agreement as well as areas of divergence