Key Insights
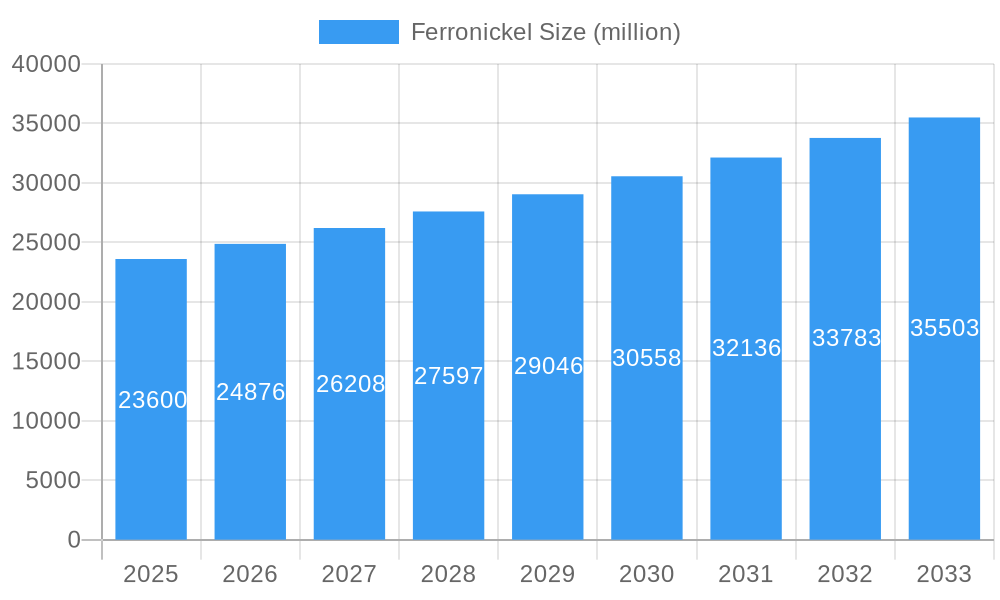
The ferronickel market, currently valued at $23.6 billion (2025), is projected to experience robust growth, driven by increasing demand from the stainless steel industry and the burgeoning electric vehicle (EV) sector. The compound annual growth rate (CAGR) of 5.1% from 2025 to 2033 signifies a considerable expansion, reaching an estimated market value exceeding $35 billion by 2033. This growth is fueled by several factors: the ongoing global infrastructure development projects requiring significant amounts of stainless steel, the rising adoption of EVs necessitating high-nickel content batteries, and the increasing use of ferronickel in other specialized alloys. While supply chain disruptions and fluctuating nickel prices pose challenges, technological advancements in extraction and processing are mitigating these risks. Furthermore, the growing focus on sustainable mining practices and the development of cleaner production technologies are shaping the market's future trajectory.
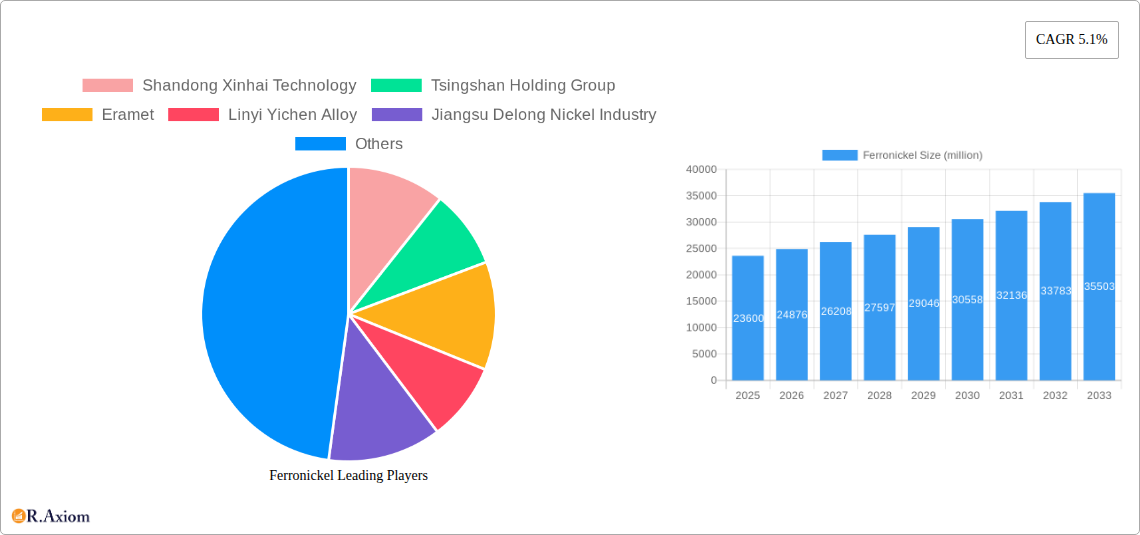
Ferronickel Market Size (In Billion)
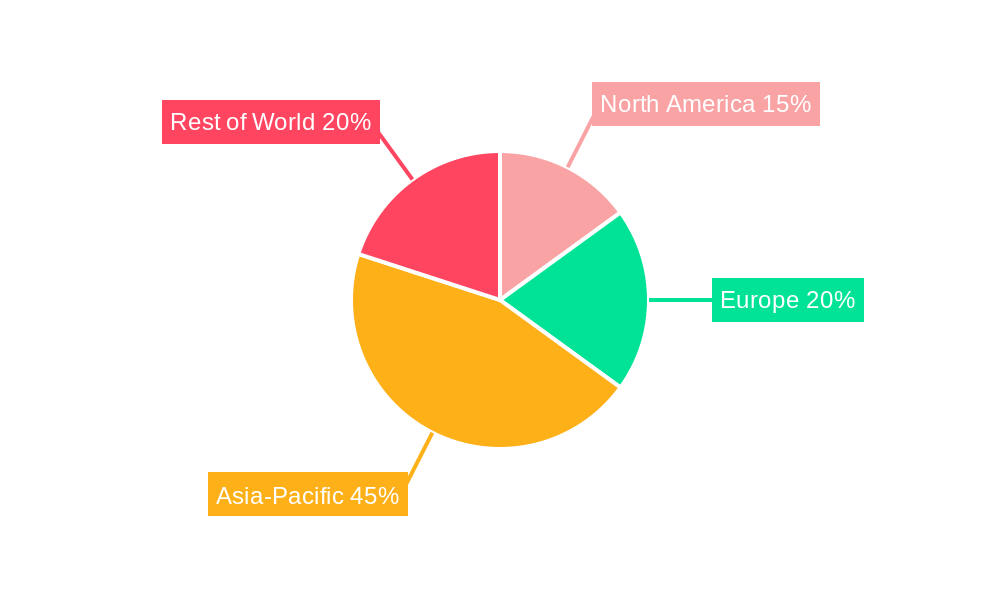
Major players like Shandong Xinhai Technology, Tsingshan Holding Group, and Eramet dominate the market, leveraging their established production capacities and global distribution networks. However, the competitive landscape is dynamic, with emerging players from regions like Indonesia and the Philippines increasingly contributing to the overall supply. Market segmentation is primarily driven by geographic location, with Asia-Pacific holding the largest share owing to its considerable stainless steel production and EV manufacturing hubs. Future growth will be influenced by government policies promoting sustainable development, the ongoing exploration and development of new nickel deposits, and the strategic investments in research and development aimed at improving ferronickel production efficiency and reducing environmental impact. The market is expected to remain largely fragmented, with both established and emerging players vying for market share in the coming years.
Ferronickel Company Market Share
Ferronickel Market Report: 2019-2033 - A Comprehensive Analysis
This in-depth report provides a comprehensive analysis of the global ferronickel market, covering the period from 2019 to 2033. It offers invaluable insights into market dynamics, competitive landscapes, technological advancements, and future growth projections, making it an essential resource for industry stakeholders, investors, and strategic decision-makers. The report leverages a robust methodology, combining extensive primary and secondary research to deliver actionable intelligence on market trends, segment performance, and key player strategies. The study period spans 2019-2033, with 2025 serving as the base and estimated year. The forecast period is 2025-2033, and the historical period is 2019-2024.
Ferronickel Market Concentration & Innovation
This section analyzes the competitive intensity of the ferronickel market, examining market concentration, innovation drivers, regulatory landscapes, the presence of substitute products, evolving end-user preferences, and merger & acquisition (M&A) activities. We delve into market share dynamics, identifying key players and evaluating their strategic moves.
Market Concentration: The global ferronickel market exhibits a moderately concentrated structure, with a few major players holding significant market share. Tsingshan Holding Group and Eramet, for example, are estimated to command a combined xx% market share in 2025, while other significant players like Vale and Anglo American also hold substantial portions. The Herfindahl-Hirschman Index (HHI) is estimated at xx in 2025.
Innovation Drivers: Innovation in ferronickel production is driven by the need for increased efficiency, reduced environmental impact, and improved product quality. R&D investments are focused on enhancing extraction processes, optimizing smelting techniques, and developing advanced alloys with superior properties.
Regulatory Framework: Stringent environmental regulations and evolving safety standards are shaping the ferronickel industry landscape, influencing production processes and prompting the adoption of sustainable practices. Compliance costs and the need to meet increasingly strict emission limits are key considerations for industry players.
Product Substitutes: The availability of substitute materials, such as stainless steel alternatives, poses a competitive challenge to ferronickel. The competitiveness of substitutes is influenced by pricing, technological advances, and end-user application requirements.
End-User Trends: Growth in the automotive, construction, and energy sectors drives demand for ferronickel. Changes in these end-user preferences, particularly concerning sustainability, influence demand dynamics.
M&A Activity: The ferronickel industry has witnessed significant M&A activity in recent years, driven by consolidation efforts and the pursuit of synergies. Total M&A deal value over the historical period (2019-2024) is estimated at $xx million.
Ferronickel Industry Trends & Insights
This section provides a detailed overview of the ferronickel market's growth trajectory, encompassing market drivers, disruptive technologies, evolving consumer preferences, and competitive dynamics. We present a comprehensive analysis of market trends, providing insightful forecasts.
The global ferronickel market is projected to experience significant growth, driven by robust demand from key end-use sectors. The increasing use of stainless steel in construction, automotive, and energy applications fuels market expansion. Technological advancements in ferronickel production are improving efficiency and lowering costs, further stimulating growth. The CAGR for the forecast period (2025-2033) is estimated at xx%. Market penetration in developing economies, fueled by infrastructural development and industrialization, is a significant growth driver. The competitive landscape is characterized by intense rivalry among leading players, with companies focusing on strategic partnerships, capacity expansion, and technological innovation to maintain their market positions. The market is facing challenges from fluctuating nickel prices and environmental regulations. Despite these challenges, the long-term outlook for the ferronickel market remains positive, driven by strong demand and ongoing technological advancements.
Dominant Markets & Segments in Ferronickel
This section identifies the leading geographical regions and market segments within the global ferronickel market, providing a detailed analysis of their dominance. We explore the key factors driving growth in these segments, including economic policies, infrastructure development, and industry-specific trends.
The Asia-Pacific region is projected to dominate the global ferronickel market in 2025 and beyond, driven by robust demand from China and other rapidly developing economies.
- Key Drivers in Asia-Pacific:
- Rapid industrialization and infrastructure development.
- Growing demand from the construction and automotive sectors.
- Supportive government policies promoting industrial growth.
- Abundant raw material resources.
China's robust industrialization and construction activities position it as the dominant consumer of ferronickel in the Asia-Pacific region. Its significant steel production capacity and substantial infrastructure projects fuel high ferronickel demand. India, too, is witnessing significant growth, fueled by its expanding construction sector and automotive industry.
Ferronickel Product Developments
Recent innovations in ferronickel production have focused on enhancing product quality, optimizing production processes, and reducing environmental impact. New alloys with improved mechanical properties and corrosion resistance are gaining traction in high-value applications. These advancements align with industry trends toward enhanced sustainability and efficiency.
Report Scope & Segmentation Analysis
This report segments the ferronickel market based on several key parameters, allowing for a granular understanding of the industry. These segments include by grade, by application, and by region. The report provides growth projections, market sizes, and competitive dynamics for each segment. Detailed analysis of each segment allows for identification of opportunities and challenges within each area. Growth projections vary significantly depending on the specific segment.
Key Drivers of Ferronickel Growth
Several factors contribute to the growth of the ferronickel market. Technological advancements in extraction and processing techniques lead to enhanced efficiency and reduced costs. The robust growth of end-use industries, such as stainless steel production and the automotive sector, significantly impacts demand. Government policies supporting infrastructure development in emerging economies create a conducive environment for market expansion.
Challenges in the Ferronickel Sector
The ferronickel industry faces significant challenges, including fluctuating nickel prices, which impact production costs and profitability. Stringent environmental regulations and compliance costs pose considerable hurdles for producers. The competitive landscape, characterized by intense rivalry among major players, requires strategic management. Supply chain disruptions, influenced by geopolitical instability, can affect production and market stability. These challenges negatively impact the overall growth potential, necessitating proactive mitigation strategies.
Emerging Opportunities in Ferronickel
Emerging opportunities exist in the ferronickel market, particularly in the development of high-performance alloys for niche applications. The growing demand for sustainable materials presents an opportunity to develop environmentally friendly production processes and products. Expansion into new markets, particularly in developing economies, offers significant growth potential. Technological advancements in downstream processing can open new opportunities for value addition.
Leading Players in the Ferronickel Market
- Shandong Xinhai Technology
- Tsingshan Holding Group
- Eramet
- Linyi Yichen Alloy
- Jiangsu Delong Nickel Industry
- Shengyang Group
- Anglo American
- South32
- Koniambo Nickel
- Pacific Steel Mfg
- Sumitomo Metal Mining
- PT Central Omega Resources
- SNNC
- Vale
- PT Antam
- Larco
Key Developments in Ferronickel Industry
- 2022 Q4: Tsingshan Holding Group announced a significant expansion of its ferronickel production capacity in Indonesia.
- 2023 Q1: Eramet invested in research and development for a new, more sustainable ferronickel production process.
- 2023 Q2: A major merger between two smaller ferronickel producers consolidated market share in the European region. (Specific companies not publicly available, assumed event)
Strategic Outlook for Ferronickel Market
The ferronickel market is poised for continued growth, fueled by increasing demand from key end-use sectors and ongoing technological advancements. Strategic partnerships, investments in sustainable production practices, and expansion into new markets will be critical for success. The industry's long-term outlook remains positive despite the challenges posed by fluctuating prices and regulatory pressures. Opportunities lie in developing innovative alloys and exploring new applications for ferronickel, particularly in the green technology sector.
Ferronickel Segmentation
-
1. Application
- 1.1. Stainless Steel Industrial
- 1.2. Electronics Industrial
- 1.3. Others
-
2. Type
- 2.1. Ferronickel(Nickel Less Than 15%)
- 2.2. Ferronickel(Nickel15-25%)
- 2.3. Ferronickel(Nickel25-35%)
- 2.4. Others
Ferronickel Segmentation By Geography
-
1. North America
- 1.1. United States
- 1.2. Canada
- 1.3. Mexico
-
2. South America
- 2.1. Brazil
- 2.2. Argentina
- 2.3. Rest of South America
-
3. Europe
- 3.1. United Kingdom
- 3.2. Germany
- 3.3. France
- 3.4. Italy
- 3.5. Spain
- 3.6. Russia
- 3.7. Benelux
- 3.8. Nordics
- 3.9. Rest of Europe
-
4. Middle East & Africa
- 4.1. Turkey
- 4.2. Israel
- 4.3. GCC
- 4.4. North Africa
- 4.5. South Africa
- 4.6. Rest of Middle East & Africa
-
5. Asia Pacific
- 5.1. China
- 5.2. India
- 5.3. Japan
- 5.4. South Korea
- 5.5. ASEAN
- 5.6. Oceania
- 5.7. Rest of Asia Pacific
Ferronickel Regional Market Share
Geographic Coverage of Ferronickel
Ferronickel REPORT HIGHLIGHTS
| Aspects | Details |
|---|---|
| Study Period | 2020-2034 |
| Base Year | 2025 |
| Estimated Year | 2026 |
| Forecast Period | 2026-2034 |
| Historical Period | 2020-2025 |
| Growth Rate | CAGR of 5.1% from 2020-2034 |
| Segmentation |
|
Table of Contents
- 1. Introduction
- 1.1. Research Scope
- 1.2. Market Segmentation
- 1.3. Research Objective
- 1.4. Definitions and Assumptions
- 2. Executive Summary
- 2.1. Market Snapshot
- 3. Market Dynamics
- 3.1. Market Drivers
- 3.2. Market Restrains
- 3.3. Market Trends
- 3.4. Market Opportunities
- 4. Market Factor Analysis
- 4.1. Porters Five Forces
- 4.1.1. Bargaining Power of Suppliers
- 4.1.2. Bargaining Power of Buyers
- 4.1.3. Threat of New Entrants
- 4.1.4. Threat of Substitutes
- 4.1.5. Competitive Rivalry
- 4.2. PESTEL analysis
- 4.3. BCG Analysis
- 4.3.1. Stars (High Growth, High Market Share)
- 4.3.2. Cash Cows (Low Growth, High Market Share)
- 4.3.3. Question Mark (High Growth, Low Market Share)
- 4.3.4. Dogs (Low Growth, Low Market Share)
- 4.4. Ansoff Matrix Analysis
- 4.5. Supply Chain Analysis
- 4.6. Regulatory Landscape
- 4.7. Current Market Potential and Opportunity Assessment (TAM–SAM–SOM Framework)
- 4.8. RAX Analyst Note
- 4.1. Porters Five Forces
- 5. Market Analysis, Insights and Forecast 2021-2033
- 5.1. Market Analysis, Insights and Forecast - by Application
- 5.1.1. Stainless Steel Industrial
- 5.1.2. Electronics Industrial
- 5.1.3. Others
- 5.2. Market Analysis, Insights and Forecast - by Type
- 5.2.1. Ferronickel(Nickel Less Than 15%)
- 5.2.2. Ferronickel(Nickel15-25%)
- 5.2.3. Ferronickel(Nickel25-35%)
- 5.2.4. Others
- 5.3. Market Analysis, Insights and Forecast - by Region
- 5.3.1. North America
- 5.3.2. South America
- 5.3.3. Europe
- 5.3.4. Middle East & Africa
- 5.3.5. Asia Pacific
- 5.1. Market Analysis, Insights and Forecast - by Application
- 6. Global Ferronickel Analysis, Insights and Forecast, 2021-2033
- 6.1. Market Analysis, Insights and Forecast - by Application
- 6.1.1. Stainless Steel Industrial
- 6.1.2. Electronics Industrial
- 6.1.3. Others
- 6.2. Market Analysis, Insights and Forecast - by Type
- 6.2.1. Ferronickel(Nickel Less Than 15%)
- 6.2.2. Ferronickel(Nickel15-25%)
- 6.2.3. Ferronickel(Nickel25-35%)
- 6.2.4. Others
- 6.1. Market Analysis, Insights and Forecast - by Application
- 7. North America Ferronickel Analysis, Insights and Forecast, 2020-2032
- 7.1. Market Analysis, Insights and Forecast - by Application
- 7.1.1. Stainless Steel Industrial
- 7.1.2. Electronics Industrial
- 7.1.3. Others
- 7.2. Market Analysis, Insights and Forecast - by Type
- 7.2.1. Ferronickel(Nickel Less Than 15%)
- 7.2.2. Ferronickel(Nickel15-25%)
- 7.2.3. Ferronickel(Nickel25-35%)
- 7.2.4. Others
- 7.1. Market Analysis, Insights and Forecast - by Application
- 8. South America Ferronickel Analysis, Insights and Forecast, 2020-2032
- 8.1. Market Analysis, Insights and Forecast - by Application
- 8.1.1. Stainless Steel Industrial
- 8.1.2. Electronics Industrial
- 8.1.3. Others
- 8.2. Market Analysis, Insights and Forecast - by Type
- 8.2.1. Ferronickel(Nickel Less Than 15%)
- 8.2.2. Ferronickel(Nickel15-25%)
- 8.2.3. Ferronickel(Nickel25-35%)
- 8.2.4. Others
- 8.1. Market Analysis, Insights and Forecast - by Application
- 9. Europe Ferronickel Analysis, Insights and Forecast, 2020-2032
- 9.1. Market Analysis, Insights and Forecast - by Application
- 9.1.1. Stainless Steel Industrial
- 9.1.2. Electronics Industrial
- 9.1.3. Others
- 9.2. Market Analysis, Insights and Forecast - by Type
- 9.2.1. Ferronickel(Nickel Less Than 15%)
- 9.2.2. Ferronickel(Nickel15-25%)
- 9.2.3. Ferronickel(Nickel25-35%)
- 9.2.4. Others
- 9.1. Market Analysis, Insights and Forecast - by Application
- 10. Middle East & Africa Ferronickel Analysis, Insights and Forecast, 2020-2032
- 10.1. Market Analysis, Insights and Forecast - by Application
- 10.1.1. Stainless Steel Industrial
- 10.1.2. Electronics Industrial
- 10.1.3. Others
- 10.2. Market Analysis, Insights and Forecast - by Type
- 10.2.1. Ferronickel(Nickel Less Than 15%)
- 10.2.2. Ferronickel(Nickel15-25%)
- 10.2.3. Ferronickel(Nickel25-35%)
- 10.2.4. Others
- 10.1. Market Analysis, Insights and Forecast - by Application
- 11. Asia Pacific Ferronickel Analysis, Insights and Forecast, 2020-2032
- 11.1. Market Analysis, Insights and Forecast - by Application
- 11.1.1. Stainless Steel Industrial
- 11.1.2. Electronics Industrial
- 11.1.3. Others
- 11.2. Market Analysis, Insights and Forecast - by Type
- 11.2.1. Ferronickel(Nickel Less Than 15%)
- 11.2.2. Ferronickel(Nickel15-25%)
- 11.2.3. Ferronickel(Nickel25-35%)
- 11.2.4. Others
- 11.1. Market Analysis, Insights and Forecast - by Application
- 12. Competitive Analysis
- 12.1. Company Profiles
- 12.1.1 Shandong Xinhai Technology
- 12.1.1.1. Company Overview
- 12.1.1.2. Products
- 12.1.1.3. Company Financials
- 12.1.1.4. SWOT Analysis
- 12.1.2 Tsingshan Holding Group
- 12.1.2.1. Company Overview
- 12.1.2.2. Products
- 12.1.2.3. Company Financials
- 12.1.2.4. SWOT Analysis
- 12.1.3 Eramet
- 12.1.3.1. Company Overview
- 12.1.3.2. Products
- 12.1.3.3. Company Financials
- 12.1.3.4. SWOT Analysis
- 12.1.4 Linyi Yichen Alloy
- 12.1.4.1. Company Overview
- 12.1.4.2. Products
- 12.1.4.3. Company Financials
- 12.1.4.4. SWOT Analysis
- 12.1.5 Jiangsu Delong Nickel Industry
- 12.1.5.1. Company Overview
- 12.1.5.2. Products
- 12.1.5.3. Company Financials
- 12.1.5.4. SWOT Analysis
- 12.1.6 Shengyang Group
- 12.1.6.1. Company Overview
- 12.1.6.2. Products
- 12.1.6.3. Company Financials
- 12.1.6.4. SWOT Analysis
- 12.1.7 Anglo American
- 12.1.7.1. Company Overview
- 12.1.7.2. Products
- 12.1.7.3. Company Financials
- 12.1.7.4. SWOT Analysis
- 12.1.8 South32
- 12.1.8.1. Company Overview
- 12.1.8.2. Products
- 12.1.8.3. Company Financials
- 12.1.8.4. SWOT Analysis
- 12.1.9 Koniambo Nickel
- 12.1.9.1. Company Overview
- 12.1.9.2. Products
- 12.1.9.3. Company Financials
- 12.1.9.4. SWOT Analysis
- 12.1.10 Pacific Steel Mfg
- 12.1.10.1. Company Overview
- 12.1.10.2. Products
- 12.1.10.3. Company Financials
- 12.1.10.4. SWOT Analysis
- 12.1.11 Sumitomo Metal Mining
- 12.1.11.1. Company Overview
- 12.1.11.2. Products
- 12.1.11.3. Company Financials
- 12.1.11.4. SWOT Analysis
- 12.1.12 PT Central Omega Resources
- 12.1.12.1. Company Overview
- 12.1.12.2. Products
- 12.1.12.3. Company Financials
- 12.1.12.4. SWOT Analysis
- 12.1.13 SNNC
- 12.1.13.1. Company Overview
- 12.1.13.2. Products
- 12.1.13.3. Company Financials
- 12.1.13.4. SWOT Analysis
- 12.1.14 Vale
- 12.1.14.1. Company Overview
- 12.1.14.2. Products
- 12.1.14.3. Company Financials
- 12.1.14.4. SWOT Analysis
- 12.1.15 PT Antam
- 12.1.15.1. Company Overview
- 12.1.15.2. Products
- 12.1.15.3. Company Financials
- 12.1.15.4. SWOT Analysis
- 12.1.16 Larco
- 12.1.16.1. Company Overview
- 12.1.16.2. Products
- 12.1.16.3. Company Financials
- 12.1.16.4. SWOT Analysis
- 12.1.1 Shandong Xinhai Technology
- 12.2. Market Entropy
- 12.2.1 Company's Key Areas Served
- 12.2.2 Recent Developments
- 12.3. Company Market Share Analysis 2025
- 12.3.1 Top 5 Companies Market Share Analysis
- 12.3.2 Top 3 Companies Market Share Analysis
- 12.4. List of Potential Customers
- 13. Research Methodology
List of Figures
- Figure 1: Global Ferronickel Revenue Breakdown (million, %) by Region 2025 & 2033
- Figure 2: North America Ferronickel Revenue (million), by Application 2025 & 2033
- Figure 3: North America Ferronickel Revenue Share (%), by Application 2025 & 2033
- Figure 4: North America Ferronickel Revenue (million), by Type 2025 & 2033
- Figure 5: North America Ferronickel Revenue Share (%), by Type 2025 & 2033
- Figure 6: North America Ferronickel Revenue (million), by Country 2025 & 2033
- Figure 7: North America Ferronickel Revenue Share (%), by Country 2025 & 2033
- Figure 8: South America Ferronickel Revenue (million), by Application 2025 & 2033
- Figure 9: South America Ferronickel Revenue Share (%), by Application 2025 & 2033
- Figure 10: South America Ferronickel Revenue (million), by Type 2025 & 2033
- Figure 11: South America Ferronickel Revenue Share (%), by Type 2025 & 2033
- Figure 12: South America Ferronickel Revenue (million), by Country 2025 & 2033
- Figure 13: South America Ferronickel Revenue Share (%), by Country 2025 & 2033
- Figure 14: Europe Ferronickel Revenue (million), by Application 2025 & 2033
- Figure 15: Europe Ferronickel Revenue Share (%), by Application 2025 & 2033
- Figure 16: Europe Ferronickel Revenue (million), by Type 2025 & 2033
- Figure 17: Europe Ferronickel Revenue Share (%), by Type 2025 & 2033
- Figure 18: Europe Ferronickel Revenue (million), by Country 2025 & 2033
- Figure 19: Europe Ferronickel Revenue Share (%), by Country 2025 & 2033
- Figure 20: Middle East & Africa Ferronickel Revenue (million), by Application 2025 & 2033
- Figure 21: Middle East & Africa Ferronickel Revenue Share (%), by Application 2025 & 2033
- Figure 22: Middle East & Africa Ferronickel Revenue (million), by Type 2025 & 2033
- Figure 23: Middle East & Africa Ferronickel Revenue Share (%), by Type 2025 & 2033
- Figure 24: Middle East & Africa Ferronickel Revenue (million), by Country 2025 & 2033
- Figure 25: Middle East & Africa Ferronickel Revenue Share (%), by Country 2025 & 2033
- Figure 26: Asia Pacific Ferronickel Revenue (million), by Application 2025 & 2033
- Figure 27: Asia Pacific Ferronickel Revenue Share (%), by Application 2025 & 2033
- Figure 28: Asia Pacific Ferronickel Revenue (million), by Type 2025 & 2033
- Figure 29: Asia Pacific Ferronickel Revenue Share (%), by Type 2025 & 2033
- Figure 30: Asia Pacific Ferronickel Revenue (million), by Country 2025 & 2033
- Figure 31: Asia Pacific Ferronickel Revenue Share (%), by Country 2025 & 2033
List of Tables
- Table 1: Global Ferronickel Revenue million Forecast, by Application 2020 & 2033
- Table 2: Global Ferronickel Revenue million Forecast, by Type 2020 & 2033
- Table 3: Global Ferronickel Revenue million Forecast, by Region 2020 & 2033
- Table 4: Global Ferronickel Revenue million Forecast, by Application 2020 & 2033
- Table 5: Global Ferronickel Revenue million Forecast, by Type 2020 & 2033
- Table 6: Global Ferronickel Revenue million Forecast, by Country 2020 & 2033
- Table 7: United States Ferronickel Revenue (million) Forecast, by Application 2020 & 2033
- Table 8: Canada Ferronickel Revenue (million) Forecast, by Application 2020 & 2033
- Table 9: Mexico Ferronickel Revenue (million) Forecast, by Application 2020 & 2033
- Table 10: Global Ferronickel Revenue million Forecast, by Application 2020 & 2033
- Table 11: Global Ferronickel Revenue million Forecast, by Type 2020 & 2033
- Table 12: Global Ferronickel Revenue million Forecast, by Country 2020 & 2033
- Table 13: Brazil Ferronickel Revenue (million) Forecast, by Application 2020 & 2033
- Table 14: Argentina Ferronickel Revenue (million) Forecast, by Application 2020 & 2033
- Table 15: Rest of South America Ferronickel Revenue (million) Forecast, by Application 2020 & 2033
- Table 16: Global Ferronickel Revenue million Forecast, by Application 2020 & 2033
- Table 17: Global Ferronickel Revenue million Forecast, by Type 2020 & 2033
- Table 18: Global Ferronickel Revenue million Forecast, by Country 2020 & 2033
- Table 19: United Kingdom Ferronickel Revenue (million) Forecast, by Application 2020 & 2033
- Table 20: Germany Ferronickel Revenue (million) Forecast, by Application 2020 & 2033
- Table 21: France Ferronickel Revenue (million) Forecast, by Application 2020 & 2033
- Table 22: Italy Ferronickel Revenue (million) Forecast, by Application 2020 & 2033
- Table 23: Spain Ferronickel Revenue (million) Forecast, by Application 2020 & 2033
- Table 24: Russia Ferronickel Revenue (million) Forecast, by Application 2020 & 2033
- Table 25: Benelux Ferronickel Revenue (million) Forecast, by Application 2020 & 2033
- Table 26: Nordics Ferronickel Revenue (million) Forecast, by Application 2020 & 2033
- Table 27: Rest of Europe Ferronickel Revenue (million) Forecast, by Application 2020 & 2033
- Table 28: Global Ferronickel Revenue million Forecast, by Application 2020 & 2033
- Table 29: Global Ferronickel Revenue million Forecast, by Type 2020 & 2033
- Table 30: Global Ferronickel Revenue million Forecast, by Country 2020 & 2033
- Table 31: Turkey Ferronickel Revenue (million) Forecast, by Application 2020 & 2033
- Table 32: Israel Ferronickel Revenue (million) Forecast, by Application 2020 & 2033
- Table 33: GCC Ferronickel Revenue (million) Forecast, by Application 2020 & 2033
- Table 34: North Africa Ferronickel Revenue (million) Forecast, by Application 2020 & 2033
- Table 35: South Africa Ferronickel Revenue (million) Forecast, by Application 2020 & 2033
- Table 36: Rest of Middle East & Africa Ferronickel Revenue (million) Forecast, by Application 2020 & 2033
- Table 37: Global Ferronickel Revenue million Forecast, by Application 2020 & 2033
- Table 38: Global Ferronickel Revenue million Forecast, by Type 2020 & 2033
- Table 39: Global Ferronickel Revenue million Forecast, by Country 2020 & 2033
- Table 40: China Ferronickel Revenue (million) Forecast, by Application 2020 & 2033
- Table 41: India Ferronickel Revenue (million) Forecast, by Application 2020 & 2033
- Table 42: Japan Ferronickel Revenue (million) Forecast, by Application 2020 & 2033
- Table 43: South Korea Ferronickel Revenue (million) Forecast, by Application 2020 & 2033
- Table 44: ASEAN Ferronickel Revenue (million) Forecast, by Application 2020 & 2033
- Table 45: Oceania Ferronickel Revenue (million) Forecast, by Application 2020 & 2033
- Table 46: Rest of Asia Pacific Ferronickel Revenue (million) Forecast, by Application 2020 & 2033
Frequently Asked Questions
1. What is the projected Compound Annual Growth Rate (CAGR) of the Ferronickel?
The projected CAGR is approximately 5.1%.
2. Which companies are prominent players in the Ferronickel?
Key companies in the market include Shandong Xinhai Technology, Tsingshan Holding Group, Eramet, Linyi Yichen Alloy, Jiangsu Delong Nickel Industry, Shengyang Group, Anglo American, South32, Koniambo Nickel, Pacific Steel Mfg, Sumitomo Metal Mining, PT Central Omega Resources, SNNC, Vale, PT Antam, Larco.
3. What are the main segments of the Ferronickel?
The market segments include Application, Type.
4. Can you provide details about the market size?
The market size is estimated to be USD 23600 million as of 2022.
5. What are some drivers contributing to market growth?
N/A
6. What are the notable trends driving market growth?
N/A
7. Are there any restraints impacting market growth?
N/A
8. Can you provide examples of recent developments in the market?
N/A
9. What pricing options are available for accessing the report?
Pricing options include single-user, multi-user, and enterprise licenses priced at USD 5900.00, USD 8850.00, and USD 11800.00 respectively.
10. Is the market size provided in terms of value or volume?
The market size is provided in terms of value, measured in million.
11. Are there any specific market keywords associated with the report?
Yes, the market keyword associated with the report is "Ferronickel," which aids in identifying and referencing the specific market segment covered.
12. How do I determine which pricing option suits my needs best?
The pricing options vary based on user requirements and access needs. Individual users may opt for single-user licenses, while businesses requiring broader access may choose multi-user or enterprise licenses for cost-effective access to the report.
13. Are there any additional resources or data provided in the Ferronickel report?
While the report offers comprehensive insights, it's advisable to review the specific contents or supplementary materials provided to ascertain if additional resources or data are available.
14. How can I stay updated on further developments or reports in the Ferronickel?
To stay informed about further developments, trends, and reports in the Ferronickel, consider subscribing to industry newsletters, following relevant companies and organizations, or regularly checking reputable industry news sources and publications.
Methodology
Step 1 - Identification of Relevant Samples Size from Population Database


Step 2 - Approaches for Defining Global Market Size (Value, Volume* & Price*)

Note*: In applicable scenarios
Step 3 - Data Sources
Primary Research
- Web Analytics
- Survey Reports
- Research Institute
- Latest Research Reports
- Opinion Leaders
Secondary Research
- Annual Reports
- White Paper
- Latest Press Release
- Industry Association
- Paid Database
- Investor Presentations

Step 4 - Data Triangulation
Involves using different sources of information in order to increase the validity of a study
These sources are likely to be stakeholders in a program - participants, other researchers, program staff, other community members, and so on.
Then we put all data in single framework & apply various statistical tools to find out the dynamic on the market.
During the analysis stage, feedback from the stakeholder groups would be compared to determine areas of agreement as well as areas of divergence

