

Key Insights
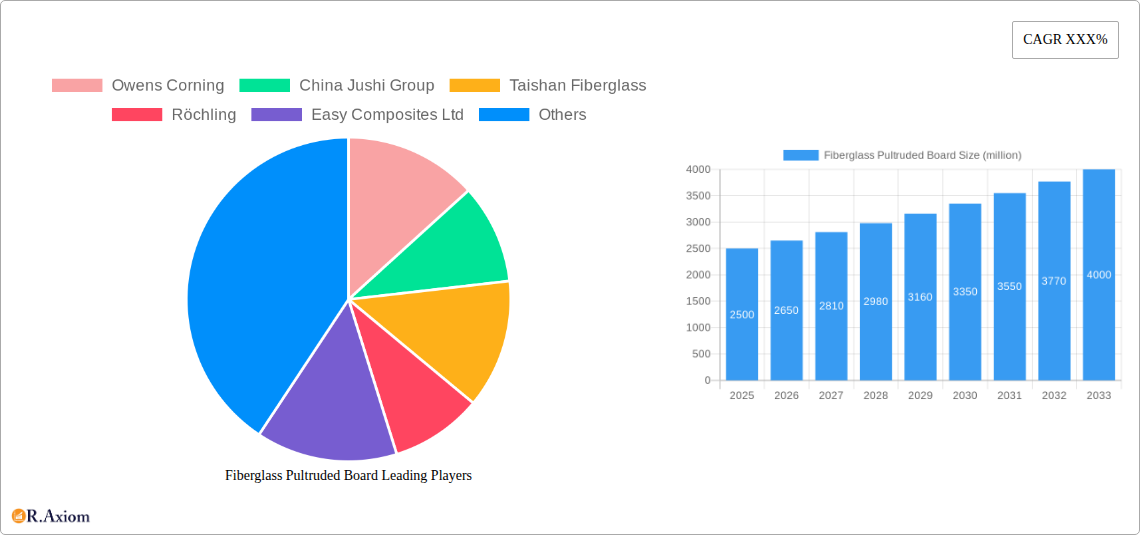
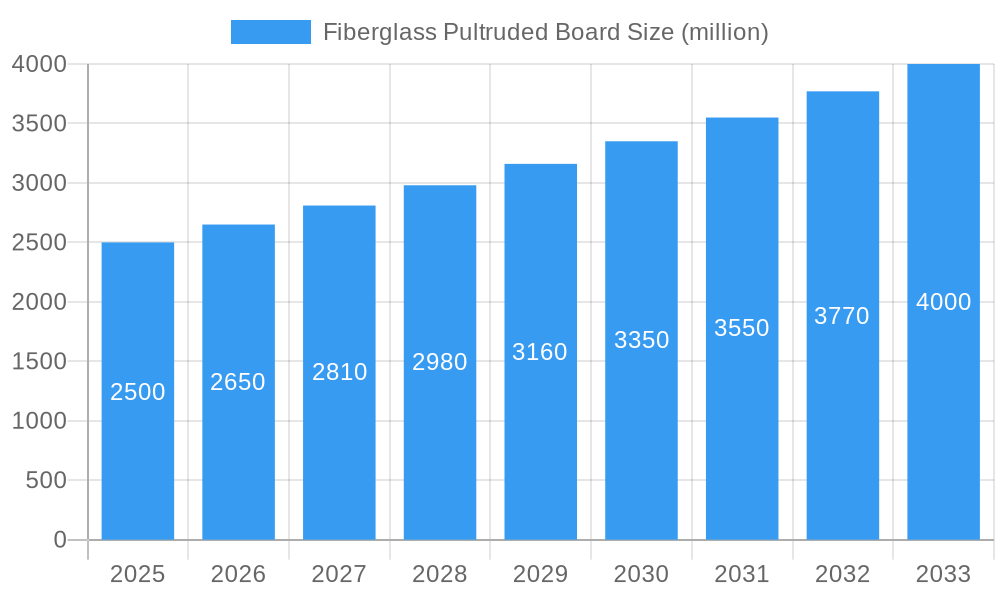
The global fiberglass pultruded board market is experiencing robust growth, driven by increasing demand across various sectors. While precise market sizing data is unavailable, considering the presence of major players like Owens Corning and China Jushi Group, along with a significant number of regional manufacturers, a conservative estimate places the 2025 market value at approximately $2.5 billion. This growth is fueled by the material's inherent advantages: high strength-to-weight ratio, corrosion resistance, and cost-effectiveness compared to other composite materials. Key application areas driving demand include construction (reinforcement in roofing, cladding, and structural components), transportation (railway sleepers, automotive parts), and infrastructure (bridges, walkways). Further expansion is expected due to ongoing trends such as the rise of sustainable construction practices and increasing investment in infrastructure projects globally. However, challenges remain, including fluctuations in raw material prices (fiberglass and resins) and the potential for increased competition from alternative materials. The market's growth trajectory over the next decade is anticipated to be moderately strong, with a Compound Annual Growth Rate (CAGR) likely within the range of 6-8%, projecting a market value exceeding $4 billion by 2033. This projection incorporates potential economic shifts and assumes continued technological advancements in pultrusion processes and material formulations.
Fiberglass Pultruded Board Market Size (In Billion)
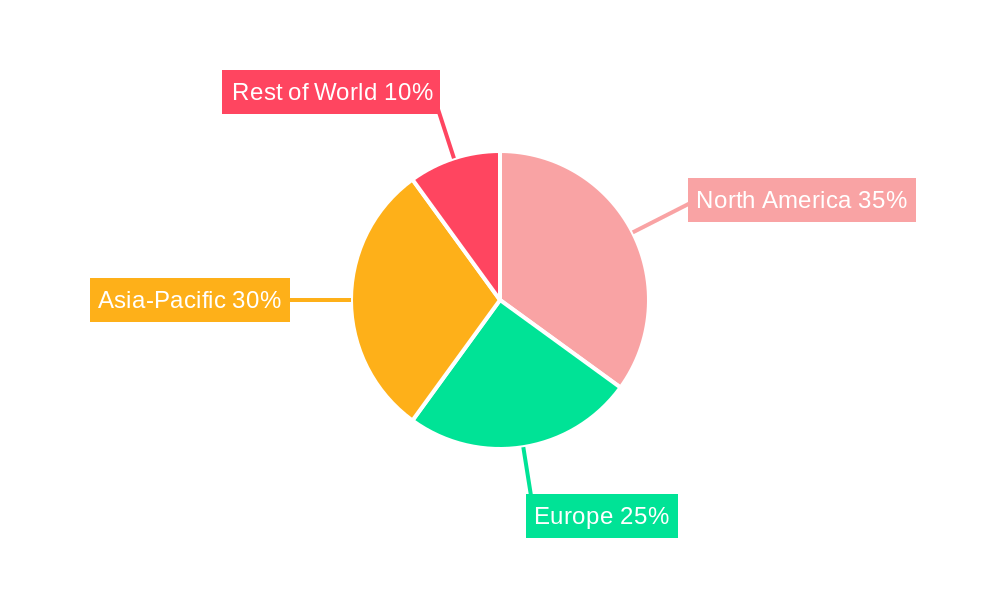
Market segmentation reveals a diverse landscape, with different types of fiberglass pultruded boards catering to specific application needs. This segmentation offers opportunities for specialized players to focus on niche markets and drive innovation. The geographic distribution of the market is likely spread across several regions, with North America and Asia-Pacific expected to hold significant shares, reflecting the strong presence of major manufacturers and substantial construction activity in these areas. Competition is intense, characterized by established players competing on pricing, product differentiation, and technological innovation. Smaller, regional companies focus on supplying niche market demands and catering to regional specific needs, providing a dynamic competitive landscape.
Fiberglass Pultruded Board Company Market Share
Fiberglass Pultruded Board Market Report: 2019-2033
This comprehensive report provides a detailed analysis of the global fiberglass pultruded board market, offering invaluable insights for stakeholders seeking to understand current market dynamics and future growth opportunities. The report covers the period 2019-2033, with a focus on the forecast period 2025-2033, utilizing 2025 as the base year and estimated year. The market is valued at millions of USD throughout.
Fiberglass Pultruded Board Market Concentration & Innovation
The global fiberglass pultruded board market exhibits a moderately concentrated landscape, with a few dominant players commanding significant market share. Owens Corning, China Jushi Group, and Taishan Fiberglass are among the leading companies, collectively accounting for an estimated xx% of the global market in 2025. Market concentration is influenced by factors such as economies of scale in production, technological advancements, and access to raw materials. Innovation is a key driver, with companies investing heavily in R&D to develop high-performance materials with improved properties like strength, durability, and thermal resistance. Regulatory frameworks, particularly those related to environmental sustainability and product safety, significantly impact market dynamics. The industry faces competition from alternative materials like wood, metal, and other composites. However, fiberglass pultruded boards retain a competitive edge due to their superior strength-to-weight ratio and cost-effectiveness. Mergers and acquisitions (M&A) activity is moderate, with deal values averaging xx million USD annually during the historical period (2019-2024).
- Market Share (2025): Owens Corning (xx%), China Jushi Group (xx%), Taishan Fiberglass (xx%), Others (xx%)
- Average M&A Deal Value (2019-2024): xx million USD
- Key Innovation Drivers: Improved material properties, sustainable manufacturing processes, enhanced product design.
- Regulatory Impact: Stringent environmental regulations driving adoption of eco-friendly manufacturing practices.
Fiberglass Pultruded Board Industry Trends & Insights
The global fiberglass pultruded board market is witnessing robust growth, driven by increasing demand across various end-use industries. The Compound Annual Growth Rate (CAGR) is projected to be xx% during the forecast period (2025-2033), fueled by several key factors. Technological advancements, such as the development of novel pultrusion techniques and improved resin systems, have led to the production of high-performance materials with enhanced properties. Consumer preferences are shifting towards sustainable and lightweight materials, aligning well with the inherent characteristics of fiberglass pultruded boards. Intense competition among manufacturers is driving innovation and price optimization. Market penetration is growing rapidly in emerging economies, particularly in construction and infrastructure projects. The market is also witnessing increased adoption in specialized applications, such as wind energy, transportation, and aerospace.
Dominant Markets & Segments in Fiberglass Pultruded Board
The construction sector is the dominant end-use segment for fiberglass pultruded board, accounting for an estimated xx% of the market in 2025. North America and Asia-Pacific represent the leading regional markets, driven by significant infrastructural development and growth in the construction industry.
- Key Drivers in North America: Robust construction activity, stringent building codes promoting use of high-performance materials, government investments in infrastructure projects.
- Key Drivers in Asia-Pacific: Rapid urbanization, increasing industrialization, significant investments in infrastructure development, growing adoption of sustainable building practices.
- Dominance Analysis: The high growth in Asia-Pacific is driven by rapid industrialization and urbanization, while North America benefits from its strong construction sector and regulatory push for high-performance materials.
Fiberglass Pultruded Board Product Developments
Recent innovations in fiberglass pultruded board technology include the development of high-strength, lightweight materials with enhanced fire resistance and improved durability. These advancements broaden the range of applications, allowing for use in demanding environments. The focus on producing eco-friendly products using recycled materials is gaining traction, improving the environmental profile of fiberglass pultruded boards. These advancements are strengthening the market position of fiberglass pultruded boards in various applications, while improving product performance and sustainability.
Report Scope & Segmentation Analysis
This report segments the fiberglass pultruded board market based on several factors, including type (e.g., thickness, surface finish), application (e.g., construction, transportation, industrial), and region. Each segment presents unique growth projections and competitive dynamics. The construction segment holds the largest market share, with significant growth potential in emerging economies. The transportation segment is experiencing steady growth, driven by the lightweighting trend in automotive and aerospace industries. The industrial segment offers diverse applications and presents opportunities for specialized product development.
Key Drivers of Fiberglass Pultruded Board Growth
Several factors are driving the growth of the fiberglass pultruded board market. Technological advancements are leading to the development of lighter, stronger, and more durable products. The increasing demand for sustainable building materials and a growing preference for lightweight construction materials are bolstering market growth. Government initiatives supporting infrastructure development and stringent building codes are creating favorable market conditions. The rising adoption of fiberglass pultruded boards in the renewable energy sector is another significant driver.
Challenges in the Fiberglass Pultruded Board Sector
The fiberglass pultruded board market faces challenges such as fluctuations in raw material prices, competition from alternative materials, and potential environmental concerns related to manufacturing processes. Supply chain disruptions can impact production and availability, while stringent regulatory requirements might increase production costs. Intense competition necessitates continuous innovation to retain market share and expand applications.
Emerging Opportunities in Fiberglass Pultruded Board
The market presents significant opportunities for growth in emerging applications, including wind turbine blades, marine structures, and advanced composites. The development of high-performance materials with improved properties, like increased fire resistance and enhanced durability, opens new avenues for application expansion. The rising adoption of sustainable manufacturing practices will positively impact market expansion and strengthen the environmental profile of fiberglass pultruded boards.
Leading Players in the Fiberglass Pultruded Board Market
- Owens Corning [Owens Corning]
- China Jushi Group
- Taishan Fiberglass
- Röchling [Röchling]
- Easy Composites Ltd [Easy Composites Ltd]
- NitPro Composites
- Jilin GuoXing Composite Materials
- BaoWu Carbon Technology
- Zhejiang Jinggong Technology
- Jiangsu Hengshen
- Weihai Guangwei Composites
- Hongwei Tech
- Zhenshi Group
- Henglong Composite Material
- Nanjing Hitech Composites
- Aosheng Technology
Key Developments in Fiberglass Pultruded Board Industry
- 2022 Q3: Owens Corning announced a new line of high-strength fiberglass pultruded boards.
- 2021 Q4: China Jushi Group invested xx million USD in expanding its production capacity.
- 2020 Q1: Taishan Fiberglass acquired a smaller competitor, enhancing its market position. (Further key developments can be added here with specific details)
Strategic Outlook for Fiberglass Pultruded Board Market
The fiberglass pultruded board market is poised for continued growth, driven by technological advancements, increasing demand in key end-use industries, and favorable regulatory environments. The focus on sustainability and lightweighting trends will continue to propel market expansion. Investment in R&D and strategic partnerships will play a crucial role in shaping the future competitive landscape. The market anticipates significant growth across various segments and regions, creating ample opportunities for industry players to expand their market share and contribute to the evolution of high-performance materials.
Fiberglass Pultruded Board Segmentation
-
1. Application
- 1.1. Wind Turbine Blades
- 1.2. Industrial
- 1.3. Rail Transportation
- 1.4. Construction
-
2. Type
- 2.1. E Fiberglass
- 2.2. S Fiberglass
- 2.3. T Fiberglass
- 2.4. Other
Fiberglass Pultruded Board Segmentation By Geography
-
1. North America
- 1.1. United States
- 1.2. Canada
- 1.3. Mexico
-
2. South America
- 2.1. Brazil
- 2.2. Argentina
- 2.3. Rest of South America
-
3. Europe
- 3.1. United Kingdom
- 3.2. Germany
- 3.3. France
- 3.4. Italy
- 3.5. Spain
- 3.6. Russia
- 3.7. Benelux
- 3.8. Nordics
- 3.9. Rest of Europe
-
4. Middle East & Africa
- 4.1. Turkey
- 4.2. Israel
- 4.3. GCC
- 4.4. North Africa
- 4.5. South Africa
- 4.6. Rest of Middle East & Africa
-
5. Asia Pacific
- 5.1. China
- 5.2. India
- 5.3. Japan
- 5.4. South Korea
- 5.5. ASEAN
- 5.6. Oceania
- 5.7. Rest of Asia Pacific
Fiberglass Pultruded Board Regional Market Share
Geographic Coverage of Fiberglass Pultruded Board
Fiberglass Pultruded Board REPORT HIGHLIGHTS
| Aspects | Details |
|---|---|
| Study Period | 2020-2034 |
| Base Year | 2025 |
| Estimated Year | 2026 |
| Forecast Period | 2026-2034 |
| Historical Period | 2020-2025 |
| Growth Rate | CAGR of XXX% from 2020-2034 |
| Segmentation |
|
Table of Contents
- 1. Introduction
- 1.1. Research Scope
- 1.2. Market Segmentation
- 1.3. Research Objective
- 1.4. Definitions and Assumptions
- 2. Executive Summary
- 2.1. Market Snapshot
- 3. Market Dynamics
- 3.1. Market Drivers
- 3.2. Market Restrains
- 3.3. Market Trends
- 3.4. Market Opportunities
- 4. Market Factor Analysis
- 4.1. Porters Five Forces
- 4.1.1. Bargaining Power of Suppliers
- 4.1.2. Bargaining Power of Buyers
- 4.1.3. Threat of New Entrants
- 4.1.4. Threat of Substitutes
- 4.1.5. Competitive Rivalry
- 4.2. PESTEL analysis
- 4.3. BCG Analysis
- 4.3.1. Stars (High Growth, High Market Share)
- 4.3.2. Cash Cows (Low Growth, High Market Share)
- 4.3.3. Question Mark (High Growth, Low Market Share)
- 4.3.4. Dogs (Low Growth, Low Market Share)
- 4.4. Ansoff Matrix Analysis
- 4.5. Supply Chain Analysis
- 4.6. Regulatory Landscape
- 4.7. Current Market Potential and Opportunity Assessment (TAM–SAM–SOM Framework)
- 4.8. RAX Analyst Note
- 4.1. Porters Five Forces
- 5. Market Analysis, Insights and Forecast 2021-2033
- 5.1. Market Analysis, Insights and Forecast - by Application
- 5.1.1. Wind Turbine Blades
- 5.1.2. Industrial
- 5.1.3. Rail Transportation
- 5.1.4. Construction
- 5.2. Market Analysis, Insights and Forecast - by Type
- 5.2.1. E Fiberglass
- 5.2.2. S Fiberglass
- 5.2.3. T Fiberglass
- 5.2.4. Other
- 5.3. Market Analysis, Insights and Forecast - by Region
- 5.3.1. North America
- 5.3.2. South America
- 5.3.3. Europe
- 5.3.4. Middle East & Africa
- 5.3.5. Asia Pacific
- 5.1. Market Analysis, Insights and Forecast - by Application
- 6. Global Fiberglass Pultruded Board Analysis, Insights and Forecast, 2021-2033
- 6.1. Market Analysis, Insights and Forecast - by Application
- 6.1.1. Wind Turbine Blades
- 6.1.2. Industrial
- 6.1.3. Rail Transportation
- 6.1.4. Construction
- 6.2. Market Analysis, Insights and Forecast - by Type
- 6.2.1. E Fiberglass
- 6.2.2. S Fiberglass
- 6.2.3. T Fiberglass
- 6.2.4. Other
- 6.1. Market Analysis, Insights and Forecast - by Application
- 7. North America Fiberglass Pultruded Board Analysis, Insights and Forecast, 2020-2032
- 7.1. Market Analysis, Insights and Forecast - by Application
- 7.1.1. Wind Turbine Blades
- 7.1.2. Industrial
- 7.1.3. Rail Transportation
- 7.1.4. Construction
- 7.2. Market Analysis, Insights and Forecast - by Type
- 7.2.1. E Fiberglass
- 7.2.2. S Fiberglass
- 7.2.3. T Fiberglass
- 7.2.4. Other
- 7.1. Market Analysis, Insights and Forecast - by Application
- 8. South America Fiberglass Pultruded Board Analysis, Insights and Forecast, 2020-2032
- 8.1. Market Analysis, Insights and Forecast - by Application
- 8.1.1. Wind Turbine Blades
- 8.1.2. Industrial
- 8.1.3. Rail Transportation
- 8.1.4. Construction
- 8.2. Market Analysis, Insights and Forecast - by Type
- 8.2.1. E Fiberglass
- 8.2.2. S Fiberglass
- 8.2.3. T Fiberglass
- 8.2.4. Other
- 8.1. Market Analysis, Insights and Forecast - by Application
- 9. Europe Fiberglass Pultruded Board Analysis, Insights and Forecast, 2020-2032
- 9.1. Market Analysis, Insights and Forecast - by Application
- 9.1.1. Wind Turbine Blades
- 9.1.2. Industrial
- 9.1.3. Rail Transportation
- 9.1.4. Construction
- 9.2. Market Analysis, Insights and Forecast - by Type
- 9.2.1. E Fiberglass
- 9.2.2. S Fiberglass
- 9.2.3. T Fiberglass
- 9.2.4. Other
- 9.1. Market Analysis, Insights and Forecast - by Application
- 10. Middle East & Africa Fiberglass Pultruded Board Analysis, Insights and Forecast, 2020-2032
- 10.1. Market Analysis, Insights and Forecast - by Application
- 10.1.1. Wind Turbine Blades
- 10.1.2. Industrial
- 10.1.3. Rail Transportation
- 10.1.4. Construction
- 10.2. Market Analysis, Insights and Forecast - by Type
- 10.2.1. E Fiberglass
- 10.2.2. S Fiberglass
- 10.2.3. T Fiberglass
- 10.2.4. Other
- 10.1. Market Analysis, Insights and Forecast - by Application
- 11. Asia Pacific Fiberglass Pultruded Board Analysis, Insights and Forecast, 2020-2032
- 11.1. Market Analysis, Insights and Forecast - by Application
- 11.1.1. Wind Turbine Blades
- 11.1.2. Industrial
- 11.1.3. Rail Transportation
- 11.1.4. Construction
- 11.2. Market Analysis, Insights and Forecast - by Type
- 11.2.1. E Fiberglass
- 11.2.2. S Fiberglass
- 11.2.3. T Fiberglass
- 11.2.4. Other
- 11.1. Market Analysis, Insights and Forecast - by Application
- 12. Competitive Analysis
- 12.1. Company Profiles
- 12.1.1 Owens Corning
- 12.1.1.1. Company Overview
- 12.1.1.2. Products
- 12.1.1.3. Company Financials
- 12.1.1.4. SWOT Analysis
- 12.1.2 China Jushi Group
- 12.1.2.1. Company Overview
- 12.1.2.2. Products
- 12.1.2.3. Company Financials
- 12.1.2.4. SWOT Analysis
- 12.1.3 Taishan Fiberglass
- 12.1.3.1. Company Overview
- 12.1.3.2. Products
- 12.1.3.3. Company Financials
- 12.1.3.4. SWOT Analysis
- 12.1.4 Röchling
- 12.1.4.1. Company Overview
- 12.1.4.2. Products
- 12.1.4.3. Company Financials
- 12.1.4.4. SWOT Analysis
- 12.1.5 Easy Composites Ltd
- 12.1.5.1. Company Overview
- 12.1.5.2. Products
- 12.1.5.3. Company Financials
- 12.1.5.4. SWOT Analysis
- 12.1.6 NitPro Composites
- 12.1.6.1. Company Overview
- 12.1.6.2. Products
- 12.1.6.3. Company Financials
- 12.1.6.4. SWOT Analysis
- 12.1.7 Jilin GuoXing Composite Materials
- 12.1.7.1. Company Overview
- 12.1.7.2. Products
- 12.1.7.3. Company Financials
- 12.1.7.4. SWOT Analysis
- 12.1.8 BaoWu Carbon Technology
- 12.1.8.1. Company Overview
- 12.1.8.2. Products
- 12.1.8.3. Company Financials
- 12.1.8.4. SWOT Analysis
- 12.1.9 Zhejiang Jinggong Technology
- 12.1.9.1. Company Overview
- 12.1.9.2. Products
- 12.1.9.3. Company Financials
- 12.1.9.4. SWOT Analysis
- 12.1.10 Jiangsu Hengshen
- 12.1.10.1. Company Overview
- 12.1.10.2. Products
- 12.1.10.3. Company Financials
- 12.1.10.4. SWOT Analysis
- 12.1.11 Weihai Guangwei Composites
- 12.1.11.1. Company Overview
- 12.1.11.2. Products
- 12.1.11.3. Company Financials
- 12.1.11.4. SWOT Analysis
- 12.1.12 Hongwei Tech
- 12.1.12.1. Company Overview
- 12.1.12.2. Products
- 12.1.12.3. Company Financials
- 12.1.12.4. SWOT Analysis
- 12.1.13 Zhenshi Group
- 12.1.13.1. Company Overview
- 12.1.13.2. Products
- 12.1.13.3. Company Financials
- 12.1.13.4. SWOT Analysis
- 12.1.14 Henglong Composite Material
- 12.1.14.1. Company Overview
- 12.1.14.2. Products
- 12.1.14.3. Company Financials
- 12.1.14.4. SWOT Analysis
- 12.1.15 Nanjing Hitech Composites
- 12.1.15.1. Company Overview
- 12.1.15.2. Products
- 12.1.15.3. Company Financials
- 12.1.15.4. SWOT Analysis
- 12.1.16 Aosheng Technology
- 12.1.16.1. Company Overview
- 12.1.16.2. Products
- 12.1.16.3. Company Financials
- 12.1.16.4. SWOT Analysis
- 12.1.1 Owens Corning
- 12.2. Market Entropy
- 12.2.1 Company's Key Areas Served
- 12.2.2 Recent Developments
- 12.3. Company Market Share Analysis 2025
- 12.3.1 Top 5 Companies Market Share Analysis
- 12.3.2 Top 3 Companies Market Share Analysis
- 12.4. List of Potential Customers
- 13. Research Methodology
List of Figures
- Figure 1: Global Fiberglass Pultruded Board Revenue Breakdown (million, %) by Region 2025 & 2033
- Figure 2: Global Fiberglass Pultruded Board Volume Breakdown (K, %) by Region 2025 & 2033
- Figure 3: North America Fiberglass Pultruded Board Revenue (million), by Application 2025 & 2033
- Figure 4: North America Fiberglass Pultruded Board Volume (K), by Application 2025 & 2033
- Figure 5: North America Fiberglass Pultruded Board Revenue Share (%), by Application 2025 & 2033
- Figure 6: North America Fiberglass Pultruded Board Volume Share (%), by Application 2025 & 2033
- Figure 7: North America Fiberglass Pultruded Board Revenue (million), by Type 2025 & 2033
- Figure 8: North America Fiberglass Pultruded Board Volume (K), by Type 2025 & 2033
- Figure 9: North America Fiberglass Pultruded Board Revenue Share (%), by Type 2025 & 2033
- Figure 10: North America Fiberglass Pultruded Board Volume Share (%), by Type 2025 & 2033
- Figure 11: North America Fiberglass Pultruded Board Revenue (million), by Country 2025 & 2033
- Figure 12: North America Fiberglass Pultruded Board Volume (K), by Country 2025 & 2033
- Figure 13: North America Fiberglass Pultruded Board Revenue Share (%), by Country 2025 & 2033
- Figure 14: North America Fiberglass Pultruded Board Volume Share (%), by Country 2025 & 2033
- Figure 15: South America Fiberglass Pultruded Board Revenue (million), by Application 2025 & 2033
- Figure 16: South America Fiberglass Pultruded Board Volume (K), by Application 2025 & 2033
- Figure 17: South America Fiberglass Pultruded Board Revenue Share (%), by Application 2025 & 2033
- Figure 18: South America Fiberglass Pultruded Board Volume Share (%), by Application 2025 & 2033
- Figure 19: South America Fiberglass Pultruded Board Revenue (million), by Type 2025 & 2033
- Figure 20: South America Fiberglass Pultruded Board Volume (K), by Type 2025 & 2033
- Figure 21: South America Fiberglass Pultruded Board Revenue Share (%), by Type 2025 & 2033
- Figure 22: South America Fiberglass Pultruded Board Volume Share (%), by Type 2025 & 2033
- Figure 23: South America Fiberglass Pultruded Board Revenue (million), by Country 2025 & 2033
- Figure 24: South America Fiberglass Pultruded Board Volume (K), by Country 2025 & 2033
- Figure 25: South America Fiberglass Pultruded Board Revenue Share (%), by Country 2025 & 2033
- Figure 26: South America Fiberglass Pultruded Board Volume Share (%), by Country 2025 & 2033
- Figure 27: Europe Fiberglass Pultruded Board Revenue (million), by Application 2025 & 2033
- Figure 28: Europe Fiberglass Pultruded Board Volume (K), by Application 2025 & 2033
- Figure 29: Europe Fiberglass Pultruded Board Revenue Share (%), by Application 2025 & 2033
- Figure 30: Europe Fiberglass Pultruded Board Volume Share (%), by Application 2025 & 2033
- Figure 31: Europe Fiberglass Pultruded Board Revenue (million), by Type 2025 & 2033
- Figure 32: Europe Fiberglass Pultruded Board Volume (K), by Type 2025 & 2033
- Figure 33: Europe Fiberglass Pultruded Board Revenue Share (%), by Type 2025 & 2033
- Figure 34: Europe Fiberglass Pultruded Board Volume Share (%), by Type 2025 & 2033
- Figure 35: Europe Fiberglass Pultruded Board Revenue (million), by Country 2025 & 2033
- Figure 36: Europe Fiberglass Pultruded Board Volume (K), by Country 2025 & 2033
- Figure 37: Europe Fiberglass Pultruded Board Revenue Share (%), by Country 2025 & 2033
- Figure 38: Europe Fiberglass Pultruded Board Volume Share (%), by Country 2025 & 2033
- Figure 39: Middle East & Africa Fiberglass Pultruded Board Revenue (million), by Application 2025 & 2033
- Figure 40: Middle East & Africa Fiberglass Pultruded Board Volume (K), by Application 2025 & 2033
- Figure 41: Middle East & Africa Fiberglass Pultruded Board Revenue Share (%), by Application 2025 & 2033
- Figure 42: Middle East & Africa Fiberglass Pultruded Board Volume Share (%), by Application 2025 & 2033
- Figure 43: Middle East & Africa Fiberglass Pultruded Board Revenue (million), by Type 2025 & 2033
- Figure 44: Middle East & Africa Fiberglass Pultruded Board Volume (K), by Type 2025 & 2033
- Figure 45: Middle East & Africa Fiberglass Pultruded Board Revenue Share (%), by Type 2025 & 2033
- Figure 46: Middle East & Africa Fiberglass Pultruded Board Volume Share (%), by Type 2025 & 2033
- Figure 47: Middle East & Africa Fiberglass Pultruded Board Revenue (million), by Country 2025 & 2033
- Figure 48: Middle East & Africa Fiberglass Pultruded Board Volume (K), by Country 2025 & 2033
- Figure 49: Middle East & Africa Fiberglass Pultruded Board Revenue Share (%), by Country 2025 & 2033
- Figure 50: Middle East & Africa Fiberglass Pultruded Board Volume Share (%), by Country 2025 & 2033
- Figure 51: Asia Pacific Fiberglass Pultruded Board Revenue (million), by Application 2025 & 2033
- Figure 52: Asia Pacific Fiberglass Pultruded Board Volume (K), by Application 2025 & 2033
- Figure 53: Asia Pacific Fiberglass Pultruded Board Revenue Share (%), by Application 2025 & 2033
- Figure 54: Asia Pacific Fiberglass Pultruded Board Volume Share (%), by Application 2025 & 2033
- Figure 55: Asia Pacific Fiberglass Pultruded Board Revenue (million), by Type 2025 & 2033
- Figure 56: Asia Pacific Fiberglass Pultruded Board Volume (K), by Type 2025 & 2033
- Figure 57: Asia Pacific Fiberglass Pultruded Board Revenue Share (%), by Type 2025 & 2033
- Figure 58: Asia Pacific Fiberglass Pultruded Board Volume Share (%), by Type 2025 & 2033
- Figure 59: Asia Pacific Fiberglass Pultruded Board Revenue (million), by Country 2025 & 2033
- Figure 60: Asia Pacific Fiberglass Pultruded Board Volume (K), by Country 2025 & 2033
- Figure 61: Asia Pacific Fiberglass Pultruded Board Revenue Share (%), by Country 2025 & 2033
- Figure 62: Asia Pacific Fiberglass Pultruded Board Volume Share (%), by Country 2025 & 2033
List of Tables
- Table 1: Global Fiberglass Pultruded Board Revenue million Forecast, by Application 2020 & 2033
- Table 2: Global Fiberglass Pultruded Board Volume K Forecast, by Application 2020 & 2033
- Table 3: Global Fiberglass Pultruded Board Revenue million Forecast, by Type 2020 & 2033
- Table 4: Global Fiberglass Pultruded Board Volume K Forecast, by Type 2020 & 2033
- Table 5: Global Fiberglass Pultruded Board Revenue million Forecast, by Region 2020 & 2033
- Table 6: Global Fiberglass Pultruded Board Volume K Forecast, by Region 2020 & 2033
- Table 7: Global Fiberglass Pultruded Board Revenue million Forecast, by Application 2020 & 2033
- Table 8: Global Fiberglass Pultruded Board Volume K Forecast, by Application 2020 & 2033
- Table 9: Global Fiberglass Pultruded Board Revenue million Forecast, by Type 2020 & 2033
- Table 10: Global Fiberglass Pultruded Board Volume K Forecast, by Type 2020 & 2033
- Table 11: Global Fiberglass Pultruded Board Revenue million Forecast, by Country 2020 & 2033
- Table 12: Global Fiberglass Pultruded Board Volume K Forecast, by Country 2020 & 2033
- Table 13: United States Fiberglass Pultruded Board Revenue (million) Forecast, by Application 2020 & 2033
- Table 14: United States Fiberglass Pultruded Board Volume (K) Forecast, by Application 2020 & 2033
- Table 15: Canada Fiberglass Pultruded Board Revenue (million) Forecast, by Application 2020 & 2033
- Table 16: Canada Fiberglass Pultruded Board Volume (K) Forecast, by Application 2020 & 2033
- Table 17: Mexico Fiberglass Pultruded Board Revenue (million) Forecast, by Application 2020 & 2033
- Table 18: Mexico Fiberglass Pultruded Board Volume (K) Forecast, by Application 2020 & 2033
- Table 19: Global Fiberglass Pultruded Board Revenue million Forecast, by Application 2020 & 2033
- Table 20: Global Fiberglass Pultruded Board Volume K Forecast, by Application 2020 & 2033
- Table 21: Global Fiberglass Pultruded Board Revenue million Forecast, by Type 2020 & 2033
- Table 22: Global Fiberglass Pultruded Board Volume K Forecast, by Type 2020 & 2033
- Table 23: Global Fiberglass Pultruded Board Revenue million Forecast, by Country 2020 & 2033
- Table 24: Global Fiberglass Pultruded Board Volume K Forecast, by Country 2020 & 2033
- Table 25: Brazil Fiberglass Pultruded Board Revenue (million) Forecast, by Application 2020 & 2033
- Table 26: Brazil Fiberglass Pultruded Board Volume (K) Forecast, by Application 2020 & 2033
- Table 27: Argentina Fiberglass Pultruded Board Revenue (million) Forecast, by Application 2020 & 2033
- Table 28: Argentina Fiberglass Pultruded Board Volume (K) Forecast, by Application 2020 & 2033
- Table 29: Rest of South America Fiberglass Pultruded Board Revenue (million) Forecast, by Application 2020 & 2033
- Table 30: Rest of South America Fiberglass Pultruded Board Volume (K) Forecast, by Application 2020 & 2033
- Table 31: Global Fiberglass Pultruded Board Revenue million Forecast, by Application 2020 & 2033
- Table 32: Global Fiberglass Pultruded Board Volume K Forecast, by Application 2020 & 2033
- Table 33: Global Fiberglass Pultruded Board Revenue million Forecast, by Type 2020 & 2033
- Table 34: Global Fiberglass Pultruded Board Volume K Forecast, by Type 2020 & 2033
- Table 35: Global Fiberglass Pultruded Board Revenue million Forecast, by Country 2020 & 2033
- Table 36: Global Fiberglass Pultruded Board Volume K Forecast, by Country 2020 & 2033
- Table 37: United Kingdom Fiberglass Pultruded Board Revenue (million) Forecast, by Application 2020 & 2033
- Table 38: United Kingdom Fiberglass Pultruded Board Volume (K) Forecast, by Application 2020 & 2033
- Table 39: Germany Fiberglass Pultruded Board Revenue (million) Forecast, by Application 2020 & 2033
- Table 40: Germany Fiberglass Pultruded Board Volume (K) Forecast, by Application 2020 & 2033
- Table 41: France Fiberglass Pultruded Board Revenue (million) Forecast, by Application 2020 & 2033
- Table 42: France Fiberglass Pultruded Board Volume (K) Forecast, by Application 2020 & 2033
- Table 43: Italy Fiberglass Pultruded Board Revenue (million) Forecast, by Application 2020 & 2033
- Table 44: Italy Fiberglass Pultruded Board Volume (K) Forecast, by Application 2020 & 2033
- Table 45: Spain Fiberglass Pultruded Board Revenue (million) Forecast, by Application 2020 & 2033
- Table 46: Spain Fiberglass Pultruded Board Volume (K) Forecast, by Application 2020 & 2033
- Table 47: Russia Fiberglass Pultruded Board Revenue (million) Forecast, by Application 2020 & 2033
- Table 48: Russia Fiberglass Pultruded Board Volume (K) Forecast, by Application 2020 & 2033
- Table 49: Benelux Fiberglass Pultruded Board Revenue (million) Forecast, by Application 2020 & 2033
- Table 50: Benelux Fiberglass Pultruded Board Volume (K) Forecast, by Application 2020 & 2033
- Table 51: Nordics Fiberglass Pultruded Board Revenue (million) Forecast, by Application 2020 & 2033
- Table 52: Nordics Fiberglass Pultruded Board Volume (K) Forecast, by Application 2020 & 2033
- Table 53: Rest of Europe Fiberglass Pultruded Board Revenue (million) Forecast, by Application 2020 & 2033
- Table 54: Rest of Europe Fiberglass Pultruded Board Volume (K) Forecast, by Application 2020 & 2033
- Table 55: Global Fiberglass Pultruded Board Revenue million Forecast, by Application 2020 & 2033
- Table 56: Global Fiberglass Pultruded Board Volume K Forecast, by Application 2020 & 2033
- Table 57: Global Fiberglass Pultruded Board Revenue million Forecast, by Type 2020 & 2033
- Table 58: Global Fiberglass Pultruded Board Volume K Forecast, by Type 2020 & 2033
- Table 59: Global Fiberglass Pultruded Board Revenue million Forecast, by Country 2020 & 2033
- Table 60: Global Fiberglass Pultruded Board Volume K Forecast, by Country 2020 & 2033
- Table 61: Turkey Fiberglass Pultruded Board Revenue (million) Forecast, by Application 2020 & 2033
- Table 62: Turkey Fiberglass Pultruded Board Volume (K) Forecast, by Application 2020 & 2033
- Table 63: Israel Fiberglass Pultruded Board Revenue (million) Forecast, by Application 2020 & 2033
- Table 64: Israel Fiberglass Pultruded Board Volume (K) Forecast, by Application 2020 & 2033
- Table 65: GCC Fiberglass Pultruded Board Revenue (million) Forecast, by Application 2020 & 2033
- Table 66: GCC Fiberglass Pultruded Board Volume (K) Forecast, by Application 2020 & 2033
- Table 67: North Africa Fiberglass Pultruded Board Revenue (million) Forecast, by Application 2020 & 2033
- Table 68: North Africa Fiberglass Pultruded Board Volume (K) Forecast, by Application 2020 & 2033
- Table 69: South Africa Fiberglass Pultruded Board Revenue (million) Forecast, by Application 2020 & 2033
- Table 70: South Africa Fiberglass Pultruded Board Volume (K) Forecast, by Application 2020 & 2033
- Table 71: Rest of Middle East & Africa Fiberglass Pultruded Board Revenue (million) Forecast, by Application 2020 & 2033
- Table 72: Rest of Middle East & Africa Fiberglass Pultruded Board Volume (K) Forecast, by Application 2020 & 2033
- Table 73: Global Fiberglass Pultruded Board Revenue million Forecast, by Application 2020 & 2033
- Table 74: Global Fiberglass Pultruded Board Volume K Forecast, by Application 2020 & 2033
- Table 75: Global Fiberglass Pultruded Board Revenue million Forecast, by Type 2020 & 2033
- Table 76: Global Fiberglass Pultruded Board Volume K Forecast, by Type 2020 & 2033
- Table 77: Global Fiberglass Pultruded Board Revenue million Forecast, by Country 2020 & 2033
- Table 78: Global Fiberglass Pultruded Board Volume K Forecast, by Country 2020 & 2033
- Table 79: China Fiberglass Pultruded Board Revenue (million) Forecast, by Application 2020 & 2033
- Table 80: China Fiberglass Pultruded Board Volume (K) Forecast, by Application 2020 & 2033
- Table 81: India Fiberglass Pultruded Board Revenue (million) Forecast, by Application 2020 & 2033
- Table 82: India Fiberglass Pultruded Board Volume (K) Forecast, by Application 2020 & 2033
- Table 83: Japan Fiberglass Pultruded Board Revenue (million) Forecast, by Application 2020 & 2033
- Table 84: Japan Fiberglass Pultruded Board Volume (K) Forecast, by Application 2020 & 2033
- Table 85: South Korea Fiberglass Pultruded Board Revenue (million) Forecast, by Application 2020 & 2033
- Table 86: South Korea Fiberglass Pultruded Board Volume (K) Forecast, by Application 2020 & 2033
- Table 87: ASEAN Fiberglass Pultruded Board Revenue (million) Forecast, by Application 2020 & 2033
- Table 88: ASEAN Fiberglass Pultruded Board Volume (K) Forecast, by Application 2020 & 2033
- Table 89: Oceania Fiberglass Pultruded Board Revenue (million) Forecast, by Application 2020 & 2033
- Table 90: Oceania Fiberglass Pultruded Board Volume (K) Forecast, by Application 2020 & 2033
- Table 91: Rest of Asia Pacific Fiberglass Pultruded Board Revenue (million) Forecast, by Application 2020 & 2033
- Table 92: Rest of Asia Pacific Fiberglass Pultruded Board Volume (K) Forecast, by Application 2020 & 2033
Frequently Asked Questions
1. What is the projected Compound Annual Growth Rate (CAGR) of the Fiberglass Pultruded Board?
The projected CAGR is approximately XXX%.
2. Which companies are prominent players in the Fiberglass Pultruded Board?
Key companies in the market include Owens Corning, China Jushi Group, Taishan Fiberglass, Röchling, Easy Composites Ltd, NitPro Composites, Jilin GuoXing Composite Materials, BaoWu Carbon Technology, Zhejiang Jinggong Technology, Jiangsu Hengshen, Weihai Guangwei Composites, Hongwei Tech, Zhenshi Group, Henglong Composite Material, Nanjing Hitech Composites, Aosheng Technology.
3. What are the main segments of the Fiberglass Pultruded Board?
The market segments include Application, Type.
4. Can you provide details about the market size?
The market size is estimated to be USD XXX million as of 2022.
5. What are some drivers contributing to market growth?
N/A
6. What are the notable trends driving market growth?
N/A
7. Are there any restraints impacting market growth?
N/A
8. Can you provide examples of recent developments in the market?
N/A
9. What pricing options are available for accessing the report?
Pricing options include single-user, multi-user, and enterprise licenses priced at USD 3950.00, USD 5925.00, and USD 7900.00 respectively.
10. Is the market size provided in terms of value or volume?
The market size is provided in terms of value, measured in million and volume, measured in K.
11. Are there any specific market keywords associated with the report?
Yes, the market keyword associated with the report is "Fiberglass Pultruded Board," which aids in identifying and referencing the specific market segment covered.
12. How do I determine which pricing option suits my needs best?
The pricing options vary based on user requirements and access needs. Individual users may opt for single-user licenses, while businesses requiring broader access may choose multi-user or enterprise licenses for cost-effective access to the report.
13. Are there any additional resources or data provided in the Fiberglass Pultruded Board report?
While the report offers comprehensive insights, it's advisable to review the specific contents or supplementary materials provided to ascertain if additional resources or data are available.
14. How can I stay updated on further developments or reports in the Fiberglass Pultruded Board?
To stay informed about further developments, trends, and reports in the Fiberglass Pultruded Board, consider subscribing to industry newsletters, following relevant companies and organizations, or regularly checking reputable industry news sources and publications.
Methodology
Step 1 - Identification of Relevant Samples Size from Population Database


Step 2 - Approaches for Defining Global Market Size (Value, Volume* & Price*)

Note*: In applicable scenarios
Step 3 - Data Sources
Primary Research
- Web Analytics
- Survey Reports
- Research Institute
- Latest Research Reports
- Opinion Leaders
Secondary Research
- Annual Reports
- White Paper
- Latest Press Release
- Industry Association
- Paid Database
- Investor Presentations

Step 4 - Data Triangulation
Involves using different sources of information in order to increase the validity of a study
These sources are likely to be stakeholders in a program - participants, other researchers, program staff, other community members, and so on.
Then we put all data in single framework & apply various statistical tools to find out the dynamic on the market.
During the analysis stage, feedback from the stakeholder groups would be compared to determine areas of agreement as well as areas of divergence