

Key Insights
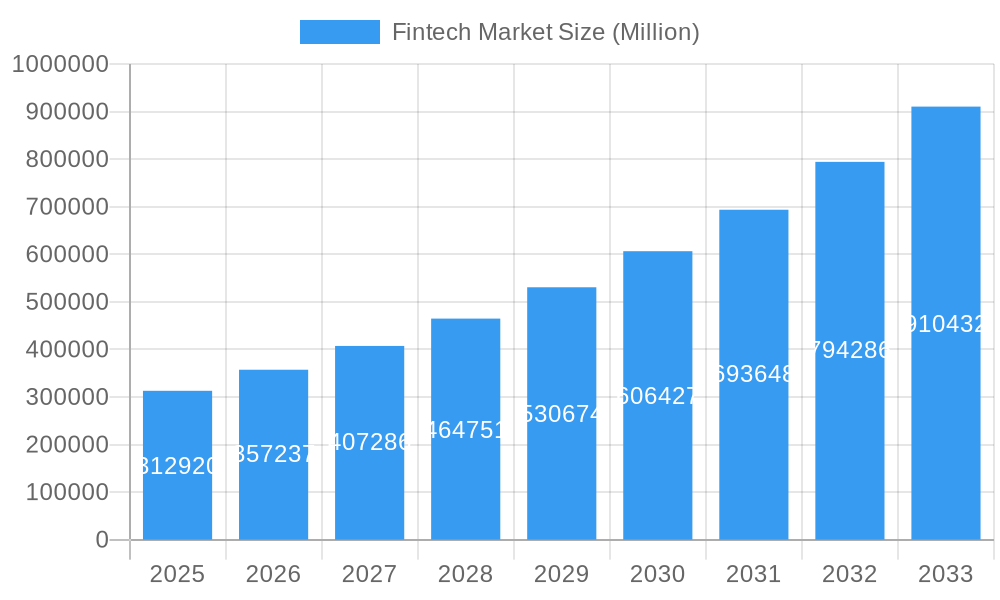
The global Fintech market, valued at $312.92 billion in 2025, is experiencing explosive growth, projected to maintain a Compound Annual Growth Rate (CAGR) exceeding 14% from 2025 to 2033. This robust expansion is fueled by several key drivers. The increasing adoption of smartphones and internet penetration, particularly in emerging economies, is creating a massive, untapped market for digital financial services. Consumers and businesses alike are demanding more convenient, efficient, and cost-effective financial solutions, pushing innovation in areas like mobile payments, digital lending, and online insurance. Furthermore, supportive government regulations and initiatives in many regions are fostering a favorable environment for Fintech growth. The market is segmented by service proposition (money transfer & payments, savings & investments, digital lending, online insurance, and others) and end-user (consumers, SMEs, and large enterprises). The competitive landscape is dynamic, featuring established players like PayPal and newcomers such as Robinhood and Klarna, vying for market share across diverse geographic regions. North America and Europe currently hold significant market shares, but the Asia-Pacific region, driven by rapid digitalization in countries like China and India, is poised for exceptional growth in the coming years.
Fintech Market Market Size (In Billion)
The Fintech market's growth trajectory is shaped by several trends. The rise of Open Banking and APIs is facilitating seamless data exchange and integration between financial institutions and Fintech companies, leading to innovative product development and enhanced customer experiences. The increasing use of Artificial Intelligence (AI) and machine learning is improving fraud detection, risk assessment, and personalized financial advice. The growing focus on financial inclusion is expanding access to financial services for underserved populations. However, challenges remain. Regulatory hurdles, cybersecurity risks, and data privacy concerns pose significant obstacles to market expansion. Furthermore, competition among established and emerging players is intense, demanding continuous innovation and adaptation to maintain market relevance. Despite these challenges, the long-term outlook for the Fintech market remains exceptionally positive, driven by unrelenting technological advancements and evolving consumer expectations.
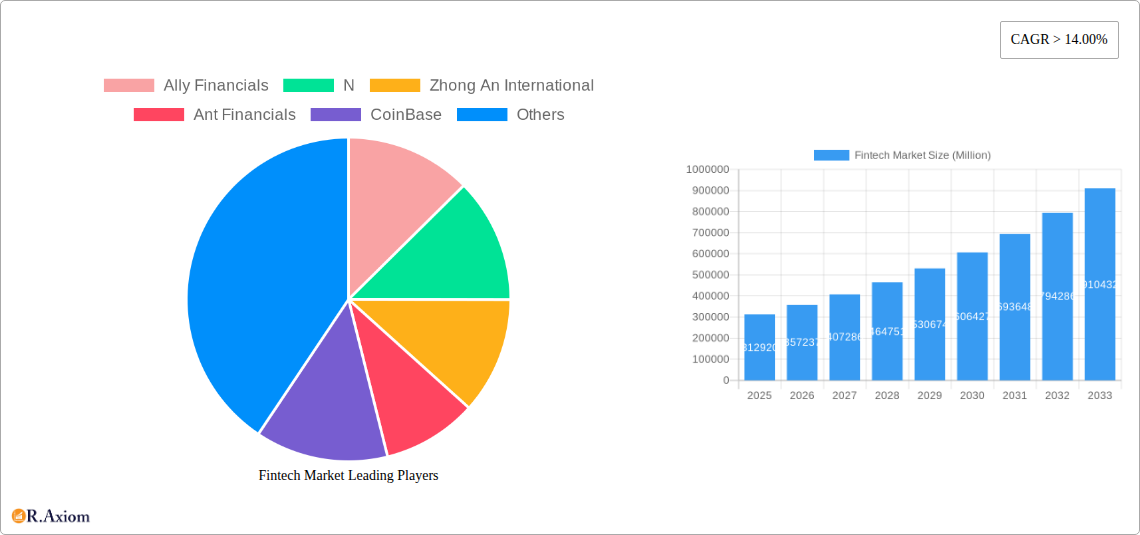
Fintech Market Company Market Share
Fintech Market: A Comprehensive Report (2019-2033)
This in-depth report provides a comprehensive analysis of the Fintech market, covering its evolution from 2019 to 2033, with a focus on market size, segmentation, key players, and future trends. The report leverages extensive data analysis to provide actionable insights for stakeholders across the Fintech ecosystem. The study period spans 2019-2033, with 2025 serving as the base and estimated year. The forecast period is 2025-2033, and the historical period is 2019-2024. The total market value is projected to reach xx Million by 2033.
Fintech Market Concentration & Innovation
This section analyzes the competitive landscape of the Fintech market, examining market concentration, innovation drivers, regulatory frameworks, product substitutes, end-user trends, and M&A activities. The market is characterized by a dynamic mix of established players and agile startups.
The market share is currently dominated by a few large players like PayPal and Ant Financials, but the landscape is rapidly evolving due to continuous innovation and disruption. The global Fintech market exhibits a moderately concentrated structure, with a Herfindahl-Hirschman Index (HHI) of xx. This indicates a considerable presence of a few prominent market participants.
- Innovation Drivers: Technological advancements (AI, blockchain, cloud computing), changing consumer preferences (demand for digital financial services), and regulatory changes are driving innovation.
- Regulatory Frameworks: Varying regulatory landscapes across regions present both opportunities and challenges for Fintech companies. Compliance and licensing requirements differ significantly, impacting market entry and expansion strategies.
- Product Substitutes: Traditional financial services act as substitutes, but the increasing convenience and cost-effectiveness of Fintech solutions are driving market adoption.
- End-User Trends: Growing digital literacy, increasing smartphone penetration, and the rising adoption of online and mobile banking are significant drivers of market growth.
- M&A Activities: The Fintech sector has witnessed significant M&A activity in recent years, with deal values exceeding xx Million in 2024. These acquisitions aim to enhance product portfolios, expand market reach, and gain access to new technologies. Examples include the PayPal-MANGOPAY collaboration and Mastercard's partnership with Synctera.
Fintech Market Industry Trends & Insights
This section delves into the key trends shaping the Fintech market, including market growth drivers, technological disruptions, consumer preferences, and competitive dynamics. The Fintech market is experiencing substantial growth, driven by factors such as increasing mobile penetration, the rising adoption of digital payments, and the growing demand for personalized financial services. The Compound Annual Growth Rate (CAGR) for the period 2025-2033 is projected to be xx%.
Market penetration of Fintech services varies across regions, with developed economies showing higher adoption rates than emerging markets. However, emerging markets represent substantial growth potential due to their large and largely untapped populations. Competitive dynamics are intense, with companies vying for market share through innovation, strategic partnerships, and mergers and acquisitions. Consumer preferences are shifting towards user-friendly, secure, and personalized financial services, forcing Fintech companies to continually adapt their offerings. Technological disruptions, particularly in areas such as artificial intelligence (AI) and blockchain technology, are reshaping the industry landscape.
Dominant Markets & Segments in Fintech Market
This section identifies the leading regions, countries, and segments within the Fintech market, providing insights into their dominance. The North American market currently holds a significant share, but the Asia-Pacific region is projected to experience rapid growth.
By Service Proposition:
- Money Transfer and Payments: This segment holds the largest market share due to high consumer adoption and increasing cross-border transactions. Key drivers include rising e-commerce activity and the increasing adoption of mobile payment platforms.
- Savings and Investments: This segment is growing rapidly due to the popularity of robo-advisors and online investment platforms. Key drivers are increasing financial literacy and the search for higher returns.
- Digital Lending and Lending Marketplaces: This segment is experiencing significant growth due to the convenience and speed of online lending platforms.
- Online Insurance and Insurance Marketplaces: This segment is growing steadily, driven by rising demand for customized insurance products and greater price transparency.
- Other Service Propositions: This includes areas like wealth management, budgeting tools, and financial education, which are gaining traction.
By End User:
- Consumers/Individuals: This segment accounts for the largest share, driven by the convenience and accessibility of digital financial services.
- Small and Medium-sized Enterprises (SMEs): This segment is increasingly adopting Fintech solutions for their operational efficiency and access to credit.
- Large Enterprises: This segment uses Fintech for streamlining financial operations, risk management, and improving customer experiences.
Fintech Market Product Developments
Recent product innovations reflect a focus on enhancing user experience, security, and personalization. New features include AI-powered financial planning tools, blockchain-based payment systems, and biometric authentication. These innovations are improving market fit by addressing specific consumer needs and preferences, driving broader adoption and creating new competitive advantages.
Report Scope & Segmentation Analysis
This report segments the Fintech market by service proposition (Money Transfer and Payments, Savings and Investments, Digital Lending and Lending Marketplaces, Online Insurance and Insurance Marketplaces, Other Service Propositions) and by end-user (Consumers, SMEs, Large Enterprises). Each segment's market size, growth projections, and competitive dynamics are analyzed, providing a comprehensive overview of the market landscape. Growth projections vary significantly across segments, reflecting their differing levels of maturity and adoption.
Key Drivers of Fintech Market Growth
The Fintech market is experiencing robust growth driven by several factors. Technological advancements, such as AI, blockchain, and big data analytics, are enabling the creation of innovative financial products and services. Favorable economic conditions, particularly in emerging markets, are contributing to increased consumer spending and investment in financial technologies. Regulatory initiatives aimed at promoting financial inclusion and innovation are creating a supportive environment for Fintech growth.
Challenges in the Fintech Market Sector
Several challenges hinder the growth of the Fintech market. Stringent regulatory requirements and compliance costs pose significant hurdles for market entry and expansion. Concerns over data security and privacy are impacting consumer trust and adoption. Intense competition among established players and new entrants is leading to price wars and margin compression. Supply chain disruptions, particularly in hardware and software components, can affect the availability and cost of Fintech products and services.
Emerging Opportunities in Fintech Market
Emerging opportunities in the Fintech market include the expansion into underserved markets, the development of new financial products and services based on AI and blockchain technologies, and the increasing demand for personalized financial advice. The growth of the Internet of Things (IoT) and the increasing use of wearable devices are creating new avenues for Fintech innovation. The focus on sustainable finance and the growing demand for green financial products are also generating substantial opportunities.
Leading Players in the Fintech Market Market
Key Developments in Fintech Market Industry
- March 2023: MANGOPAY and PayPal expanded their long-term strategic collaboration, providing marketplaces with instant access to PayPal's international payment capabilities. This significantly improves cross-border payment processing efficiency for online marketplaces.
- May 2022: Mastercard partnered with Synctera, a FinTech banking service, to offer account validation solutions for Synctera-powered FinTechs via Mastercard's open banking platform. This collaboration expands the reach of open banking solutions within the Fintech ecosystem.
- March 2022: Envestnet partnered with Productfy, a B2B Fintech platform developer, providing fintech creators with direct access to Envestnet through a single interface. This streamlines the integration of Envestnet's services into new Fintech applications.
Strategic Outlook for Fintech Market Market
The Fintech market is poised for continued growth, driven by technological innovation, evolving consumer preferences, and supportive regulatory environments. Future opportunities lie in leveraging emerging technologies such as AI, blockchain, and IoT to create innovative financial products and services that meet the evolving needs of consumers and businesses. The focus on financial inclusion and sustainable finance will further shape the market's future trajectory. Strategic partnerships and mergers and acquisitions will continue to play a crucial role in shaping the competitive landscape.
Fintech Market Segmentation
-
1. Service Proposition
- 1.1. Money Transfer and Payments
- 1.2. Savings and Investments
- 1.3. Digital Lending and Lending Marketplaces
- 1.4. Online Insurance and Insurance Marketplaces
- 1.5. Other Service Propositions
Fintech Market Segmentation By Geography
-
1. North America
- 1.1. United States
- 1.2. Canada
- 1.3. Rest of North America
-
2. Europe
- 2.1. United Kingdom
- 2.2. Germany
- 2.3. France
- 2.4. Spain
- 2.5. Rest of Europe
-
3. Latin America
- 3.1. Brazil
- 3.2. Argentina
- 3.3. Mexico
- 3.4. Rest of Latin America
-
4. Asia Pacific
- 4.1. China
- 4.2. India
- 4.3. Japan
- 4.4. South Korea
- 4.5. Rest of Asia Pacific
-
5. Middle East and Africa
- 5.1. United Arab Emirates
- 5.2. Saudi Arabia
- 5.3. Rest of Middle East and Africa
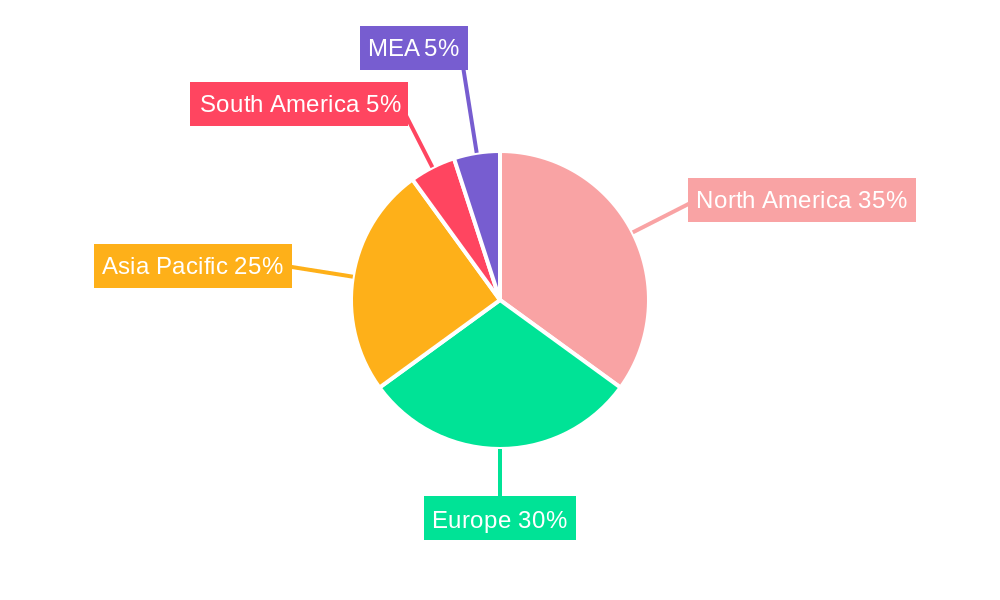
Fintech Market Regional Market Share
Geographic Coverage of Fintech Market
Fintech Market REPORT HIGHLIGHTS
| Aspects | Details |
|---|---|
| Study Period | 2020-2034 |
| Base Year | 2025 |
| Estimated Year | 2026 |
| Forecast Period | 2026-2034 |
| Historical Period | 2020-2025 |
| Growth Rate | CAGR of > 14.00% from 2020-2034 |
| Segmentation |
|
Table of Contents
- 1. Introduction
- 1.1. Research Scope
- 1.2. Market Segmentation
- 1.3. Research Objective
- 1.4. Definitions and Assumptions
- 2. Executive Summary
- 2.1. Market Snapshot
- 3. Market Dynamics
- 3.1. Market Drivers
- 3.2. Market Restrains
- 3.3. Market Trends
- 3.4. Market Opportunities
- 4. Market Factor Analysis
- 4.1. Porters Five Forces
- 4.1.1. Bargaining Power of Suppliers
- 4.1.2. Bargaining Power of Buyers
- 4.1.3. Threat of New Entrants
- 4.1.4. Threat of Substitutes
- 4.1.5. Competitive Rivalry
- 4.2. PESTEL analysis
- 4.3. BCG Analysis
- 4.3.1. Stars (High Growth, High Market Share)
- 4.3.2. Cash Cows (Low Growth, High Market Share)
- 4.3.3. Question Mark (High Growth, Low Market Share)
- 4.3.4. Dogs (Low Growth, Low Market Share)
- 4.4. Ansoff Matrix Analysis
- 4.5. Supply Chain Analysis
- 4.6. Regulatory Landscape
- 4.7. Current Market Potential and Opportunity Assessment (TAM–SAM–SOM Framework)
- 4.8. RAX Analyst Note
- 4.1. Porters Five Forces
- 5. Market Analysis, Insights and Forecast 2021-2033
- 5.1. Market Analysis, Insights and Forecast - by Service Proposition
- 5.1.1. Money Transfer and Payments
- 5.1.2. Savings and Investments
- 5.1.3. Digital Lending and Lending Marketplaces
- 5.1.4. Online Insurance and Insurance Marketplaces
- 5.1.5. Other Service Propositions
- 5.2. Market Analysis, Insights and Forecast - by Region
- 5.2.1. North America
- 5.2.2. Europe
- 5.2.3. Latin America
- 5.2.4. Asia Pacific
- 5.2.5. Middle East and Africa
- 5.1. Market Analysis, Insights and Forecast - by Service Proposition
- 6. Global Fintech Market Analysis, Insights and Forecast, 2021-2033
- 6.1. Market Analysis, Insights and Forecast - by Service Proposition
- 6.1.1. Money Transfer and Payments
- 6.1.2. Savings and Investments
- 6.1.3. Digital Lending and Lending Marketplaces
- 6.1.4. Online Insurance and Insurance Marketplaces
- 6.1.5. Other Service Propositions
- 6.1. Market Analysis, Insights and Forecast - by Service Proposition
- 7. North America Fintech Market Analysis, Insights and Forecast, 2020-2032
- 7.1. Market Analysis, Insights and Forecast - by Service Proposition
- 7.1.1. Money Transfer and Payments
- 7.1.2. Savings and Investments
- 7.1.3. Digital Lending and Lending Marketplaces
- 7.1.4. Online Insurance and Insurance Marketplaces
- 7.1.5. Other Service Propositions
- 7.1. Market Analysis, Insights and Forecast - by Service Proposition
- 8. Europe Fintech Market Analysis, Insights and Forecast, 2020-2032
- 8.1. Market Analysis, Insights and Forecast - by Service Proposition
- 8.1.1. Money Transfer and Payments
- 8.1.2. Savings and Investments
- 8.1.3. Digital Lending and Lending Marketplaces
- 8.1.4. Online Insurance and Insurance Marketplaces
- 8.1.5. Other Service Propositions
- 8.1. Market Analysis, Insights and Forecast - by Service Proposition
- 9. Latin America Fintech Market Analysis, Insights and Forecast, 2020-2032
- 9.1. Market Analysis, Insights and Forecast - by Service Proposition
- 9.1.1. Money Transfer and Payments
- 9.1.2. Savings and Investments
- 9.1.3. Digital Lending and Lending Marketplaces
- 9.1.4. Online Insurance and Insurance Marketplaces
- 9.1.5. Other Service Propositions
- 9.1. Market Analysis, Insights and Forecast - by Service Proposition
- 10. Asia Pacific Fintech Market Analysis, Insights and Forecast, 2020-2032
- 10.1. Market Analysis, Insights and Forecast - by Service Proposition
- 10.1.1. Money Transfer and Payments
- 10.1.2. Savings and Investments
- 10.1.3. Digital Lending and Lending Marketplaces
- 10.1.4. Online Insurance and Insurance Marketplaces
- 10.1.5. Other Service Propositions
- 10.1. Market Analysis, Insights and Forecast - by Service Proposition
- 11. Middle East and Africa Fintech Market Analysis, Insights and Forecast, 2020-2032
- 11.1. Market Analysis, Insights and Forecast - by Service Proposition
- 11.1.1. Money Transfer and Payments
- 11.1.2. Savings and Investments
- 11.1.3. Digital Lending and Lending Marketplaces
- 11.1.4. Online Insurance and Insurance Marketplaces
- 11.1.5. Other Service Propositions
- 11.1. Market Analysis, Insights and Forecast - by Service Proposition
- 12. Competitive Analysis
- 12.1. Company Profiles
- 12.1.1 Ally Financials
- 12.1.1.1. Company Overview
- 12.1.1.2. Products
- 12.1.1.3. Company Financials
- 12.1.1.4. SWOT Analysis
- 12.1.2 N
- 12.1.2.1. Company Overview
- 12.1.2.2. Products
- 12.1.2.3. Company Financials
- 12.1.2.4. SWOT Analysis
- 12.1.3 Zhong An International
- 12.1.3.1. Company Overview
- 12.1.3.2. Products
- 12.1.3.3. Company Financials
- 12.1.3.4. SWOT Analysis
- 12.1.4 Ant Financials
- 12.1.4.1. Company Overview
- 12.1.4.2. Products
- 12.1.4.3. Company Financials
- 12.1.4.4. SWOT Analysis
- 12.1.5 CoinBase
- 12.1.5.1. Company Overview
- 12.1.5.2. Products
- 12.1.5.3. Company Financials
- 12.1.5.4. SWOT Analysis
- 12.1.6 Klarna
- 12.1.6.1. Company Overview
- 12.1.6.2. Products
- 12.1.6.3. Company Financials
- 12.1.6.4. SWOT Analysis
- 12.1.7 Robinhood
- 12.1.7.1. Company Overview
- 12.1.7.2. Products
- 12.1.7.3. Company Financials
- 12.1.7.4. SWOT Analysis
- 12.1.8 SoFi
- 12.1.8.1. Company Overview
- 12.1.8.2. Products
- 12.1.8.3. Company Financials
- 12.1.8.4. SWOT Analysis
- 12.1.9 Oscar Health
- 12.1.9.1. Company Overview
- 12.1.9.2. Products
- 12.1.9.3. Company Financials
- 12.1.9.4. SWOT Analysis
- 12.1.10 Adyen
- 12.1.10.1. Company Overview
- 12.1.10.2. Products
- 12.1.10.3. Company Financials
- 12.1.10.4. SWOT Analysis
- 12.1.11 Avant**List Not Exhaustive
- 12.1.11.1. Company Overview
- 12.1.11.2. Products
- 12.1.11.3. Company Financials
- 12.1.11.4. SWOT Analysis
- 12.1.12 Paypal
- 12.1.12.1. Company Overview
- 12.1.12.2. Products
- 12.1.12.3. Company Financials
- 12.1.12.4. SWOT Analysis
- 12.1.13 Atom Bank
- 12.1.13.1. Company Overview
- 12.1.13.2. Products
- 12.1.13.3. Company Financials
- 12.1.13.4. SWOT Analysis
- 12.1.1 Ally Financials
- 12.2. Market Entropy
- 12.2.1 Company's Key Areas Served
- 12.2.2 Recent Developments
- 12.3. Company Market Share Analysis 2025
- 12.3.1 Top 5 Companies Market Share Analysis
- 12.3.2 Top 3 Companies Market Share Analysis
- 12.4. List of Potential Customers
- 13. Research Methodology
List of Figures
- Figure 1: Global Fintech Market Revenue Breakdown (Million, %) by Region 2025 & 2033
- Figure 2: North America Fintech Market Revenue (Million), by Service Proposition 2025 & 2033
- Figure 3: North America Fintech Market Revenue Share (%), by Service Proposition 2025 & 2033
- Figure 4: North America Fintech Market Revenue (Million), by Country 2025 & 2033
- Figure 5: North America Fintech Market Revenue Share (%), by Country 2025 & 2033
- Figure 6: Europe Fintech Market Revenue (Million), by Service Proposition 2025 & 2033
- Figure 7: Europe Fintech Market Revenue Share (%), by Service Proposition 2025 & 2033
- Figure 8: Europe Fintech Market Revenue (Million), by Country 2025 & 2033
- Figure 9: Europe Fintech Market Revenue Share (%), by Country 2025 & 2033
- Figure 10: Latin America Fintech Market Revenue (Million), by Service Proposition 2025 & 2033
- Figure 11: Latin America Fintech Market Revenue Share (%), by Service Proposition 2025 & 2033
- Figure 12: Latin America Fintech Market Revenue (Million), by Country 2025 & 2033
- Figure 13: Latin America Fintech Market Revenue Share (%), by Country 2025 & 2033
- Figure 14: Asia Pacific Fintech Market Revenue (Million), by Service Proposition 2025 & 2033
- Figure 15: Asia Pacific Fintech Market Revenue Share (%), by Service Proposition 2025 & 2033
- Figure 16: Asia Pacific Fintech Market Revenue (Million), by Country 2025 & 2033
- Figure 17: Asia Pacific Fintech Market Revenue Share (%), by Country 2025 & 2033
- Figure 18: Middle East and Africa Fintech Market Revenue (Million), by Service Proposition 2025 & 2033
- Figure 19: Middle East and Africa Fintech Market Revenue Share (%), by Service Proposition 2025 & 2033
- Figure 20: Middle East and Africa Fintech Market Revenue (Million), by Country 2025 & 2033
- Figure 21: Middle East and Africa Fintech Market Revenue Share (%), by Country 2025 & 2033
List of Tables
- Table 1: Global Fintech Market Revenue Million Forecast, by Service Proposition 2020 & 2033
- Table 2: Global Fintech Market Revenue Million Forecast, by Region 2020 & 2033
- Table 3: Global Fintech Market Revenue Million Forecast, by Service Proposition 2020 & 2033
- Table 4: Global Fintech Market Revenue Million Forecast, by Country 2020 & 2033
- Table 5: United States Fintech Market Revenue (Million) Forecast, by Application 2020 & 2033
- Table 6: Canada Fintech Market Revenue (Million) Forecast, by Application 2020 & 2033
- Table 7: Rest of North America Fintech Market Revenue (Million) Forecast, by Application 2020 & 2033
- Table 8: Global Fintech Market Revenue Million Forecast, by Service Proposition 2020 & 2033
- Table 9: Global Fintech Market Revenue Million Forecast, by Country 2020 & 2033
- Table 10: United Kingdom Fintech Market Revenue (Million) Forecast, by Application 2020 & 2033
- Table 11: Germany Fintech Market Revenue (Million) Forecast, by Application 2020 & 2033
- Table 12: France Fintech Market Revenue (Million) Forecast, by Application 2020 & 2033
- Table 13: Spain Fintech Market Revenue (Million) Forecast, by Application 2020 & 2033
- Table 14: Rest of Europe Fintech Market Revenue (Million) Forecast, by Application 2020 & 2033
- Table 15: Global Fintech Market Revenue Million Forecast, by Service Proposition 2020 & 2033
- Table 16: Global Fintech Market Revenue Million Forecast, by Country 2020 & 2033
- Table 17: Brazil Fintech Market Revenue (Million) Forecast, by Application 2020 & 2033
- Table 18: Argentina Fintech Market Revenue (Million) Forecast, by Application 2020 & 2033
- Table 19: Mexico Fintech Market Revenue (Million) Forecast, by Application 2020 & 2033
- Table 20: Rest of Latin America Fintech Market Revenue (Million) Forecast, by Application 2020 & 2033
- Table 21: Global Fintech Market Revenue Million Forecast, by Service Proposition 2020 & 2033
- Table 22: Global Fintech Market Revenue Million Forecast, by Country 2020 & 2033
- Table 23: China Fintech Market Revenue (Million) Forecast, by Application 2020 & 2033
- Table 24: India Fintech Market Revenue (Million) Forecast, by Application 2020 & 2033
- Table 25: Japan Fintech Market Revenue (Million) Forecast, by Application 2020 & 2033
- Table 26: South Korea Fintech Market Revenue (Million) Forecast, by Application 2020 & 2033
- Table 27: Rest of Asia Pacific Fintech Market Revenue (Million) Forecast, by Application 2020 & 2033
- Table 28: Global Fintech Market Revenue Million Forecast, by Service Proposition 2020 & 2033
- Table 29: Global Fintech Market Revenue Million Forecast, by Country 2020 & 2033
- Table 30: United Arab Emirates Fintech Market Revenue (Million) Forecast, by Application 2020 & 2033
- Table 31: Saudi Arabia Fintech Market Revenue (Million) Forecast, by Application 2020 & 2033
- Table 32: Rest of Middle East and Africa Fintech Market Revenue (Million) Forecast, by Application 2020 & 2033
Frequently Asked Questions
1. What is the projected Compound Annual Growth Rate (CAGR) of the Fintech Market?
The projected CAGR is approximately > 14.00%.
2. Which companies are prominent players in the Fintech Market?
Key companies in the market include Ally Financials, N, Zhong An International, Ant Financials, CoinBase, Klarna, Robinhood, SoFi, Oscar Health, Adyen, Avant**List Not Exhaustive, Paypal, Atom Bank.
3. What are the main segments of the Fintech Market?
The market segments include Service Proposition.
4. Can you provide details about the market size?
The market size is estimated to be USD 312.92 Million as of 2022.
5. What are some drivers contributing to market growth?
Rise of Digital Payments; Rising Investments in FinTech Firms.
6. What are the notable trends driving market growth?
Surging Adoption of Digital Payments is Driving the Market.
7. Are there any restraints impacting market growth?
Intense Competition; Increasing Cybersecurity Risks.
8. Can you provide examples of recent developments in the market?
March 2023: MANGOPAY and PayPal expanded their long-term strategic collaboration to give marketplaces instant access to PayPal's international payment capabilities.
9. What pricing options are available for accessing the report?
Pricing options include single-user, multi-user, and enterprise licenses priced at USD 4750, USD 5250, and USD 8750 respectively.
10. Is the market size provided in terms of value or volume?
The market size is provided in terms of value, measured in Million.
11. Are there any specific market keywords associated with the report?
Yes, the market keyword associated with the report is "Fintech Market," which aids in identifying and referencing the specific market segment covered.
12. How do I determine which pricing option suits my needs best?
The pricing options vary based on user requirements and access needs. Individual users may opt for single-user licenses, while businesses requiring broader access may choose multi-user or enterprise licenses for cost-effective access to the report.
13. Are there any additional resources or data provided in the Fintech Market report?
While the report offers comprehensive insights, it's advisable to review the specific contents or supplementary materials provided to ascertain if additional resources or data are available.
14. How can I stay updated on further developments or reports in the Fintech Market?
To stay informed about further developments, trends, and reports in the Fintech Market, consider subscribing to industry newsletters, following relevant companies and organizations, or regularly checking reputable industry news sources and publications.
Methodology
Step 1 - Identification of Relevant Samples Size from Population Database


Step 2 - Approaches for Defining Global Market Size (Value, Volume* & Price*)

Note*: In applicable scenarios
Step 3 - Data Sources
Primary Research
- Web Analytics
- Survey Reports
- Research Institute
- Latest Research Reports
- Opinion Leaders
Secondary Research
- Annual Reports
- White Paper
- Latest Press Release
- Industry Association
- Paid Database
- Investor Presentations

Step 4 - Data Triangulation
Involves using different sources of information in order to increase the validity of a study
These sources are likely to be stakeholders in a program - participants, other researchers, program staff, other community members, and so on.
Then we put all data in single framework & apply various statistical tools to find out the dynamic on the market.
During the analysis stage, feedback from the stakeholder groups would be compared to determine areas of agreement as well as areas of divergence