
Key Insights
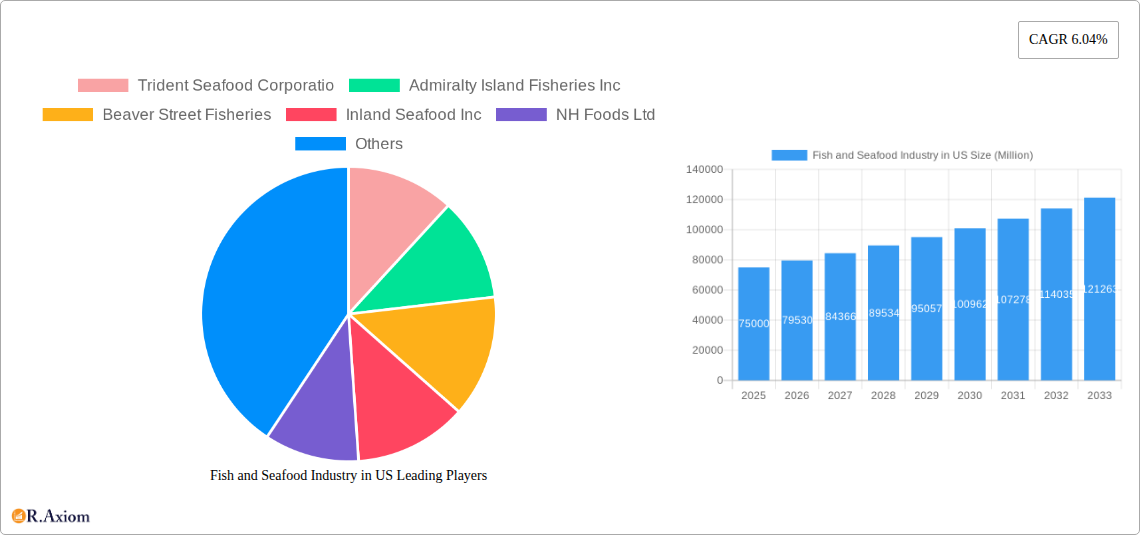
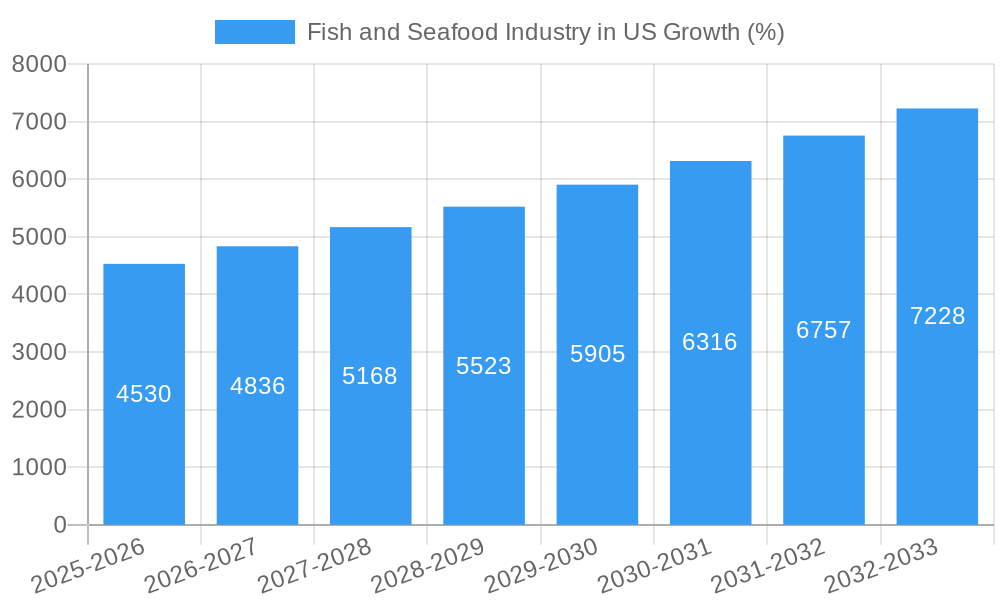
The US fish and seafood market, a substantial sector within the broader food industry, is experiencing steady growth, projected to maintain a Compound Annual Growth Rate (CAGR) of 6.04% from 2025 to 2033. This expansion is fueled by several key factors. Increasing consumer awareness of the health benefits associated with seafood consumption, particularly its high protein and omega-3 fatty acid content, is driving demand. Growing popularity of seafood-centric diets, including the Mediterranean diet and various other health-conscious eating plans, further contributes to market growth. Simultaneously, the food service industry's increasing incorporation of seafood into menus, encompassing both fine dining and casual eateries, significantly boosts demand. Innovation within the seafood processing and packaging sectors also plays a role, extending shelf life and improving product quality, thereby enhancing consumer appeal. While supply chain disruptions and fluctuating prices pose challenges, the overall market outlook remains positive, driven by consumer preference shifts and industry adaptations.
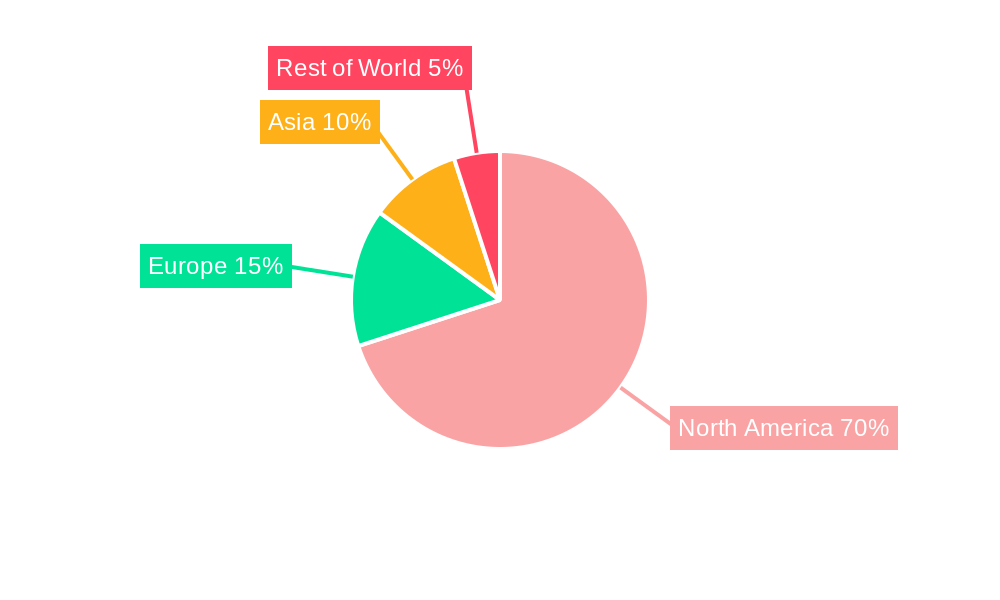
The market segmentation reveals important trends. While frozen seafood remains a dominant segment due to convenience and extended shelf life, fresh/chilled seafood is experiencing notable growth, reflecting consumers' increasing preference for quality and freshness. The canned seafood segment maintains a steady presence, catering to specific consumer needs and price sensitivities. Distribution channels also influence market dynamics. The off-trade segment (grocery stores, supermarkets) dominates, although the on-trade segment (restaurants, hotels) is witnessing growth aligned with the expanding food service sector. Major players such as Trident Seafood Corporation, High Liner Foods Inc., and Thai Union Group PCL are actively shaping market dynamics through product innovation, strategic acquisitions, and expansion into new markets. Regional variations exist, with the United States representing the largest market within North America, followed by Canada and Mexico. Future market growth will likely be influenced by factors such as sustainable fishing practices, regulatory changes, and evolving consumer preferences.
Fish and Seafood Industry in US: A Comprehensive Market Analysis (2019-2033)
This comprehensive report provides a detailed analysis of the US fish and seafood industry, covering market size, segmentation, key players, and future trends. The study period spans from 2019 to 2033, with 2025 as the base and estimated year. The report offers actionable insights for industry stakeholders, including producers, distributors, retailers, and investors. It leverages extensive primary and secondary research, incorporating data from government agencies, industry publications, and company reports. The report is crucial for understanding the evolving dynamics of this vital sector and making informed business decisions.
Fish and Seafood Industry in US Market Concentration & Innovation
The US fish and seafood industry exhibits a moderately concentrated market structure, with several large players dominating specific segments. Market share data for 2024 reveals that the top five companies collectively hold approximately xx% of the total market value (USD xx Million). However, the market also supports numerous smaller, regional players specializing in niche products or distribution channels. Innovation is driven by consumer demand for sustainable, traceable, and value-added products. The industry is actively exploring advanced processing techniques, improved packaging solutions, and innovative product formulations. Regulatory frameworks, including those related to sustainability, food safety, and labeling, significantly influence market dynamics. Product substitutes, such as plant-based seafood alternatives, are gaining traction, though their market penetration remains relatively low at xx% in 2024. End-user trends indicate a growing preference for convenient, ready-to-eat products and a heightened focus on health and wellness. Mergers and acquisitions (M&A) activity has been relatively robust in recent years. Significant M&A deals during the historical period totaled an estimated USD xx Million. Key examples include:
- Inland Seafood's acquisition of Lonestar Seafood in January 2023.
- Several smaller acquisitions and partnerships not publicly disclosed.
Fish and Seafood Industry in US Industry Trends & Insights
The US fish and seafood market is experiencing steady growth, driven by increasing consumer demand, expanding distribution networks, and rising disposable incomes. The market's Compound Annual Growth Rate (CAGR) during the historical period (2019-2024) was approximately xx%, reaching an estimated USD xx Million in 2024. Technological disruptions, such as the adoption of automation in processing and improved traceability systems, are enhancing efficiency and product quality. Consumer preferences are shifting towards healthier, sustainable, and ethically sourced seafood products. Competitive dynamics are shaped by factors such as product differentiation, branding, pricing strategies, and supply chain management. Market penetration of frozen seafood remains high, exceeding xx% in 2024, reflecting consumer convenience and product preservation advantages. The increasing popularity of online grocery shopping is also reshaping distribution channels, driving growth in e-commerce sales and prompting investment in digital marketing strategies. Concerns about overfishing and sustainable practices exert considerable influence on the industry's development trajectory.
Dominant Markets & Segments in Fish and Seafood Industry in US
The frozen segment of the US fish and seafood market holds the largest share, driven by its extended shelf life and convenience. This segment is estimated to account for xx% of the total market value in 2025. The off-trade distribution channel remains the primary sales route for most seafood products, though on-trade channels (restaurants and food service) are experiencing steady growth fueled by the increasing popularity of seafood in culinary applications.
Key Drivers of Frozen Segment Dominance:
- Extended shelf life, reducing waste.
- Convenience for consumers and retailers.
- Suitability for large-scale distribution.
Key Drivers of Off-Trade Channel Dominance:
- Established retail infrastructure.
- Consumer preference for home consumption.
- Lower operational costs compared to on-trade.
Within product types, fish constitutes the largest segment, followed by shrimp and other seafood categories. Regional variations in consumption patterns exist, with higher seafood consumption observed in coastal regions compared to inland areas. Economic policies, infrastructure developments, and consumer demographics all influence the regional distribution of market share.
Fish and Seafood Industry in US Product Developments
Recent product innovations focus on convenience, health, and sustainability. Ready-to-eat meals, pre-portioned packs, and value-added products are gaining popularity. Technological advancements such as improved freezing techniques, modified atmosphere packaging (MAP), and high-pressure processing (HPP) are enhancing product quality, safety, and shelf life. The emphasis on sustainable sourcing and traceability is driving the development of certification programs and supply chain transparency initiatives, enhancing consumer confidence and brand differentiation.
Report Scope & Segmentation Analysis
This report segments the US fish and seafood market based on product type (fish, shrimp, other seafood), form (canned, fresh/chilled, frozen, processed), and distribution channel (off-trade, on-trade). Each segment is analyzed in detail, with projections for market size, growth rate, and competitive dynamics presented for the forecast period (2025-2033).
- Product Type: Growth projections vary across segments, with fish and shrimp exhibiting relatively higher growth rates than other seafood categories.
- Form: Frozen products are expected to dominate, though growth in convenient ready-to-eat formats will impact other segments.
- Distribution Channel: The off-trade channel is projected to maintain its leading position, but the on-trade channel is poised for faster growth.
Key Drivers of Fish and Seafood Industry in US Growth
Several factors are driving the growth of the US fish and seafood industry. These include growing consumer awareness of the health benefits of seafood, increasing demand for convenient and ready-to-eat products, and technological advancements leading to improved product quality and shelf life. Furthermore, rising disposable incomes and changing dietary preferences are contributing to increased seafood consumption. Government regulations promoting sustainable fishing practices and responsible aquaculture also influence market growth.
Challenges in the Fish and Seafood Industry in US Sector
The US fish and seafood industry faces challenges, including fluctuating raw material prices, concerns over sustainability and overfishing, and stringent regulatory compliance requirements. Supply chain disruptions, particularly transportation and logistics issues, impact profitability and product availability. Intense competition from both domestic and imported products also presents ongoing challenges. These factors lead to reduced margins and pressure on operational efficiency.
Emerging Opportunities in Fish and Seafood Industry in US
Emerging opportunities include the growing demand for sustainably sourced seafood, the rise of plant-based seafood alternatives, and the expansion of e-commerce channels for seafood sales. Technological advancements in aquaculture, processing, and packaging are creating new possibilities for product innovation and efficiency improvements. The increasing focus on health and wellness is driving consumer interest in nutritious and convenient seafood options.
Leading Players in the Fish and Seafood Industry in US Market
- Trident Seafood Corporation
- Admiralty Island Fisheries Inc
- Beaver Street Fisheries
- Inland Seafood Inc
- NH Foods Ltd
- High Liner Foods Inc
- Sysco Corporation
- The Kraft Heinz Company
- Thai Union Group PCL
- Mowi ASA
Key Developments in Fish and Seafood Industry in US Industry
- May 2023: Trident Seafood Corporation launched a new Prized Fish product range in collaboration with Copper River Prince William Sound Marketing Association.
- April 2023: Inland Seafood opened a new facility in Jefferson Parish, Louisiana, creating 55 jobs.
- January 2023: Inland Seafood acquired Texas-based Lonestar Seafood, expanding its operations in the western US.
Strategic Outlook for Fish and Seafood Industry in US Market
The US fish and seafood industry is poised for continued growth, driven by consumer demand, technological advancements, and a focus on sustainability. Opportunities exist in value-added products, e-commerce, and innovative processing techniques. Companies focusing on sustainable sourcing, traceability, and brand building will be best positioned for success in this dynamic market. The industry’s future hinges on adapting to evolving consumer preferences, addressing supply chain challenges, and embracing technological advancements to enhance efficiency and product quality.
Fish and Seafood Industry in US Segmentation
-
1. Type
- 1.1. Fish
- 1.2. Shrimp
- 1.3. Other Seafood
-
2. Form
- 2.1. Canned
- 2.2. Fresh / Chilled
- 2.3. Frozen
- 2.4. Processed
-
3. Distribution Channel
-
3.1. Off-Trade
- 3.1.1. Convenience Stores
- 3.1.2. Online Channel
- 3.1.3. Supermarkets and Hypermarkets
- 3.1.4. Others
- 3.2. On-Trade
-
3.1. Off-Trade
Fish and Seafood Industry in US Segmentation By Geography
-
1. North America
- 1.1. United States
- 1.2. Canada
- 1.3. Mexico
-
2. South America
- 2.1. Brazil
- 2.2. Argentina
- 2.3. Rest of South America
-
3. Europe
- 3.1. United Kingdom
- 3.2. Germany
- 3.3. France
- 3.4. Italy
- 3.5. Spain
- 3.6. Russia
- 3.7. Benelux
- 3.8. Nordics
- 3.9. Rest of Europe
-
4. Middle East & Africa
- 4.1. Turkey
- 4.2. Israel
- 4.3. GCC
- 4.4. North Africa
- 4.5. South Africa
- 4.6. Rest of Middle East & Africa
-
5. Asia Pacific
- 5.1. China
- 5.2. India
- 5.3. Japan
- 5.4. South Korea
- 5.5. ASEAN
- 5.6. Oceania
- 5.7. Rest of Asia Pacific
Fish and Seafood Industry in US REPORT HIGHLIGHTS
| Aspects | Details |
|---|---|
| Study Period | 2019-2033 |
| Base Year | 2024 |
| Estimated Year | 2025 |
| Forecast Period | 2025-2033 |
| Historical Period | 2019-2024 |
| Growth Rate | CAGR of 6.04% from 2019-2033 |
| Segmentation |
|
Table of Contents
- 1. Introduction
- 1.1. Research Scope
- 1.2. Market Segmentation
- 1.3. Research Methodology
- 1.4. Definitions and Assumptions
- 2. Executive Summary
- 2.1. Introduction
- 3. Market Dynamics
- 3.1. Introduction
- 3.2. Market Drivers
- 3.2.1. Increasing Focus on Maintaining Health and Well-Being; Launching Supplements For Specific Purposes and Targeted Population
- 3.3. Market Restrains
- 3.3.1. Supplement Consumption and Their Side-effects; Inclination Towards Substitute Products
- 3.4. Market Trends
- 3.4.1. OTHER KEY INDUSTRY TRENDS COVERED IN THE REPORT
- 4. Market Factor Analysis
- 4.1. Porters Five Forces
- 4.2. Supply/Value Chain
- 4.3. PESTEL analysis
- 4.4. Market Entropy
- 4.5. Patent/Trademark Analysis
- 5. Global Fish and Seafood Industry in US Analysis, Insights and Forecast, 2019-2031
- 5.1. Market Analysis, Insights and Forecast - by Type
- 5.1.1. Fish
- 5.1.2. Shrimp
- 5.1.3. Other Seafood
- 5.2. Market Analysis, Insights and Forecast - by Form
- 5.2.1. Canned
- 5.2.2. Fresh / Chilled
- 5.2.3. Frozen
- 5.2.4. Processed
- 5.3. Market Analysis, Insights and Forecast - by Distribution Channel
- 5.3.1. Off-Trade
- 5.3.1.1. Convenience Stores
- 5.3.1.2. Online Channel
- 5.3.1.3. Supermarkets and Hypermarkets
- 5.3.1.4. Others
- 5.3.2. On-Trade
- 5.3.1. Off-Trade
- 5.4. Market Analysis, Insights and Forecast - by Region
- 5.4.1. North America
- 5.4.2. South America
- 5.4.3. Europe
- 5.4.4. Middle East & Africa
- 5.4.5. Asia Pacific
- 5.1. Market Analysis, Insights and Forecast - by Type
- 6. North America Fish and Seafood Industry in US Analysis, Insights and Forecast, 2019-2031
- 6.1. Market Analysis, Insights and Forecast - by Type
- 6.1.1. Fish
- 6.1.2. Shrimp
- 6.1.3. Other Seafood
- 6.2. Market Analysis, Insights and Forecast - by Form
- 6.2.1. Canned
- 6.2.2. Fresh / Chilled
- 6.2.3. Frozen
- 6.2.4. Processed
- 6.3. Market Analysis, Insights and Forecast - by Distribution Channel
- 6.3.1. Off-Trade
- 6.3.1.1. Convenience Stores
- 6.3.1.2. Online Channel
- 6.3.1.3. Supermarkets and Hypermarkets
- 6.3.1.4. Others
- 6.3.2. On-Trade
- 6.3.1. Off-Trade
- 6.1. Market Analysis, Insights and Forecast - by Type
- 7. South America Fish and Seafood Industry in US Analysis, Insights and Forecast, 2019-2031
- 7.1. Market Analysis, Insights and Forecast - by Type
- 7.1.1. Fish
- 7.1.2. Shrimp
- 7.1.3. Other Seafood
- 7.2. Market Analysis, Insights and Forecast - by Form
- 7.2.1. Canned
- 7.2.2. Fresh / Chilled
- 7.2.3. Frozen
- 7.2.4. Processed
- 7.3. Market Analysis, Insights and Forecast - by Distribution Channel
- 7.3.1. Off-Trade
- 7.3.1.1. Convenience Stores
- 7.3.1.2. Online Channel
- 7.3.1.3. Supermarkets and Hypermarkets
- 7.3.1.4. Others
- 7.3.2. On-Trade
- 7.3.1. Off-Trade
- 7.1. Market Analysis, Insights and Forecast - by Type
- 8. Europe Fish and Seafood Industry in US Analysis, Insights and Forecast, 2019-2031
- 8.1. Market Analysis, Insights and Forecast - by Type
- 8.1.1. Fish
- 8.1.2. Shrimp
- 8.1.3. Other Seafood
- 8.2. Market Analysis, Insights and Forecast - by Form
- 8.2.1. Canned
- 8.2.2. Fresh / Chilled
- 8.2.3. Frozen
- 8.2.4. Processed
- 8.3. Market Analysis, Insights and Forecast - by Distribution Channel
- 8.3.1. Off-Trade
- 8.3.1.1. Convenience Stores
- 8.3.1.2. Online Channel
- 8.3.1.3. Supermarkets and Hypermarkets
- 8.3.1.4. Others
- 8.3.2. On-Trade
- 8.3.1. Off-Trade
- 8.1. Market Analysis, Insights and Forecast - by Type
- 9. Middle East & Africa Fish and Seafood Industry in US Analysis, Insights and Forecast, 2019-2031
- 9.1. Market Analysis, Insights and Forecast - by Type
- 9.1.1. Fish
- 9.1.2. Shrimp
- 9.1.3. Other Seafood
- 9.2. Market Analysis, Insights and Forecast - by Form
- 9.2.1. Canned
- 9.2.2. Fresh / Chilled
- 9.2.3. Frozen
- 9.2.4. Processed
- 9.3. Market Analysis, Insights and Forecast - by Distribution Channel
- 9.3.1. Off-Trade
- 9.3.1.1. Convenience Stores
- 9.3.1.2. Online Channel
- 9.3.1.3. Supermarkets and Hypermarkets
- 9.3.1.4. Others
- 9.3.2. On-Trade
- 9.3.1. Off-Trade
- 9.1. Market Analysis, Insights and Forecast - by Type
- 10. Asia Pacific Fish and Seafood Industry in US Analysis, Insights and Forecast, 2019-2031
- 10.1. Market Analysis, Insights and Forecast - by Type
- 10.1.1. Fish
- 10.1.2. Shrimp
- 10.1.3. Other Seafood
- 10.2. Market Analysis, Insights and Forecast - by Form
- 10.2.1. Canned
- 10.2.2. Fresh / Chilled
- 10.2.3. Frozen
- 10.2.4. Processed
- 10.3. Market Analysis, Insights and Forecast - by Distribution Channel
- 10.3.1. Off-Trade
- 10.3.1.1. Convenience Stores
- 10.3.1.2. Online Channel
- 10.3.1.3. Supermarkets and Hypermarkets
- 10.3.1.4. Others
- 10.3.2. On-Trade
- 10.3.1. Off-Trade
- 10.1. Market Analysis, Insights and Forecast - by Type
- 11. United States Fish and Seafood Industry in US Analysis, Insights and Forecast, 2019-2031
- 12. Canada Fish and Seafood Industry in US Analysis, Insights and Forecast, 2019-2031
- 13. Mexico Fish and Seafood Industry in US Analysis, Insights and Forecast, 2019-2031
- 14. Rest of North America Fish and Seafood Industry in US Analysis, Insights and Forecast, 2019-2031
- 15. Competitive Analysis
- 15.1. Global Market Share Analysis 2024
- 15.2. Company Profiles
- 15.2.1 Trident Seafood Corporatio
- 15.2.1.1. Overview
- 15.2.1.2. Products
- 15.2.1.3. SWOT Analysis
- 15.2.1.4. Recent Developments
- 15.2.1.5. Financials (Based on Availability)
- 15.2.2 Admiralty Island Fisheries Inc
- 15.2.2.1. Overview
- 15.2.2.2. Products
- 15.2.2.3. SWOT Analysis
- 15.2.2.4. Recent Developments
- 15.2.2.5. Financials (Based on Availability)
- 15.2.3 Beaver Street Fisheries
- 15.2.3.1. Overview
- 15.2.3.2. Products
- 15.2.3.3. SWOT Analysis
- 15.2.3.4. Recent Developments
- 15.2.3.5. Financials (Based on Availability)
- 15.2.4 Inland Seafood Inc
- 15.2.4.1. Overview
- 15.2.4.2. Products
- 15.2.4.3. SWOT Analysis
- 15.2.4.4. Recent Developments
- 15.2.4.5. Financials (Based on Availability)
- 15.2.5 NH Foods Ltd
- 15.2.5.1. Overview
- 15.2.5.2. Products
- 15.2.5.3. SWOT Analysis
- 15.2.5.4. Recent Developments
- 15.2.5.5. Financials (Based on Availability)
- 15.2.6 High Liner Foods Inc
- 15.2.6.1. Overview
- 15.2.6.2. Products
- 15.2.6.3. SWOT Analysis
- 15.2.6.4. Recent Developments
- 15.2.6.5. Financials (Based on Availability)
- 15.2.7 Sysco Corporation
- 15.2.7.1. Overview
- 15.2.7.2. Products
- 15.2.7.3. SWOT Analysis
- 15.2.7.4. Recent Developments
- 15.2.7.5. Financials (Based on Availability)
- 15.2.8 The Kraft Heinz Company
- 15.2.8.1. Overview
- 15.2.8.2. Products
- 15.2.8.3. SWOT Analysis
- 15.2.8.4. Recent Developments
- 15.2.8.5. Financials (Based on Availability)
- 15.2.9 Thai Union Group PCL
- 15.2.9.1. Overview
- 15.2.9.2. Products
- 15.2.9.3. SWOT Analysis
- 15.2.9.4. Recent Developments
- 15.2.9.5. Financials (Based on Availability)
- 15.2.10 Mowi ASA
- 15.2.10.1. Overview
- 15.2.10.2. Products
- 15.2.10.3. SWOT Analysis
- 15.2.10.4. Recent Developments
- 15.2.10.5. Financials (Based on Availability)
- 15.2.1 Trident Seafood Corporatio
List of Figures
- Figure 1: Global Fish and Seafood Industry in US Revenue Breakdown (Million, %) by Region 2024 & 2032
- Figure 2: North America Fish and Seafood Industry in US Revenue (Million), by Country 2024 & 2032
- Figure 3: North America Fish and Seafood Industry in US Revenue Share (%), by Country 2024 & 2032
- Figure 4: North America Fish and Seafood Industry in US Revenue (Million), by Type 2024 & 2032
- Figure 5: North America Fish and Seafood Industry in US Revenue Share (%), by Type 2024 & 2032
- Figure 6: North America Fish and Seafood Industry in US Revenue (Million), by Form 2024 & 2032
- Figure 7: North America Fish and Seafood Industry in US Revenue Share (%), by Form 2024 & 2032
- Figure 8: North America Fish and Seafood Industry in US Revenue (Million), by Distribution Channel 2024 & 2032
- Figure 9: North America Fish and Seafood Industry in US Revenue Share (%), by Distribution Channel 2024 & 2032
- Figure 10: North America Fish and Seafood Industry in US Revenue (Million), by Country 2024 & 2032
- Figure 11: North America Fish and Seafood Industry in US Revenue Share (%), by Country 2024 & 2032
- Figure 12: South America Fish and Seafood Industry in US Revenue (Million), by Type 2024 & 2032
- Figure 13: South America Fish and Seafood Industry in US Revenue Share (%), by Type 2024 & 2032
- Figure 14: South America Fish and Seafood Industry in US Revenue (Million), by Form 2024 & 2032
- Figure 15: South America Fish and Seafood Industry in US Revenue Share (%), by Form 2024 & 2032
- Figure 16: South America Fish and Seafood Industry in US Revenue (Million), by Distribution Channel 2024 & 2032
- Figure 17: South America Fish and Seafood Industry in US Revenue Share (%), by Distribution Channel 2024 & 2032
- Figure 18: South America Fish and Seafood Industry in US Revenue (Million), by Country 2024 & 2032
- Figure 19: South America Fish and Seafood Industry in US Revenue Share (%), by Country 2024 & 2032
- Figure 20: Europe Fish and Seafood Industry in US Revenue (Million), by Type 2024 & 2032
- Figure 21: Europe Fish and Seafood Industry in US Revenue Share (%), by Type 2024 & 2032
- Figure 22: Europe Fish and Seafood Industry in US Revenue (Million), by Form 2024 & 2032
- Figure 23: Europe Fish and Seafood Industry in US Revenue Share (%), by Form 2024 & 2032
- Figure 24: Europe Fish and Seafood Industry in US Revenue (Million), by Distribution Channel 2024 & 2032
- Figure 25: Europe Fish and Seafood Industry in US Revenue Share (%), by Distribution Channel 2024 & 2032
- Figure 26: Europe Fish and Seafood Industry in US Revenue (Million), by Country 2024 & 2032
- Figure 27: Europe Fish and Seafood Industry in US Revenue Share (%), by Country 2024 & 2032
- Figure 28: Middle East & Africa Fish and Seafood Industry in US Revenue (Million), by Type 2024 & 2032
- Figure 29: Middle East & Africa Fish and Seafood Industry in US Revenue Share (%), by Type 2024 & 2032
- Figure 30: Middle East & Africa Fish and Seafood Industry in US Revenue (Million), by Form 2024 & 2032
- Figure 31: Middle East & Africa Fish and Seafood Industry in US Revenue Share (%), by Form 2024 & 2032
- Figure 32: Middle East & Africa Fish and Seafood Industry in US Revenue (Million), by Distribution Channel 2024 & 2032
- Figure 33: Middle East & Africa Fish and Seafood Industry in US Revenue Share (%), by Distribution Channel 2024 & 2032
- Figure 34: Middle East & Africa Fish and Seafood Industry in US Revenue (Million), by Country 2024 & 2032
- Figure 35: Middle East & Africa Fish and Seafood Industry in US Revenue Share (%), by Country 2024 & 2032
- Figure 36: Asia Pacific Fish and Seafood Industry in US Revenue (Million), by Type 2024 & 2032
- Figure 37: Asia Pacific Fish and Seafood Industry in US Revenue Share (%), by Type 2024 & 2032
- Figure 38: Asia Pacific Fish and Seafood Industry in US Revenue (Million), by Form 2024 & 2032
- Figure 39: Asia Pacific Fish and Seafood Industry in US Revenue Share (%), by Form 2024 & 2032
- Figure 40: Asia Pacific Fish and Seafood Industry in US Revenue (Million), by Distribution Channel 2024 & 2032
- Figure 41: Asia Pacific Fish and Seafood Industry in US Revenue Share (%), by Distribution Channel 2024 & 2032
- Figure 42: Asia Pacific Fish and Seafood Industry in US Revenue (Million), by Country 2024 & 2032
- Figure 43: Asia Pacific Fish and Seafood Industry in US Revenue Share (%), by Country 2024 & 2032
List of Tables
- Table 1: Global Fish and Seafood Industry in US Revenue Million Forecast, by Region 2019 & 2032
- Table 2: Global Fish and Seafood Industry in US Revenue Million Forecast, by Type 2019 & 2032
- Table 3: Global Fish and Seafood Industry in US Revenue Million Forecast, by Form 2019 & 2032
- Table 4: Global Fish and Seafood Industry in US Revenue Million Forecast, by Distribution Channel 2019 & 2032
- Table 5: Global Fish and Seafood Industry in US Revenue Million Forecast, by Region 2019 & 2032
- Table 6: Global Fish and Seafood Industry in US Revenue Million Forecast, by Country 2019 & 2032
- Table 7: United States Fish and Seafood Industry in US Revenue (Million) Forecast, by Application 2019 & 2032
- Table 8: Canada Fish and Seafood Industry in US Revenue (Million) Forecast, by Application 2019 & 2032
- Table 9: Mexico Fish and Seafood Industry in US Revenue (Million) Forecast, by Application 2019 & 2032
- Table 10: Rest of North America Fish and Seafood Industry in US Revenue (Million) Forecast, by Application 2019 & 2032
- Table 11: Global Fish and Seafood Industry in US Revenue Million Forecast, by Type 2019 & 2032
- Table 12: Global Fish and Seafood Industry in US Revenue Million Forecast, by Form 2019 & 2032
- Table 13: Global Fish and Seafood Industry in US Revenue Million Forecast, by Distribution Channel 2019 & 2032
- Table 14: Global Fish and Seafood Industry in US Revenue Million Forecast, by Country 2019 & 2032
- Table 15: United States Fish and Seafood Industry in US Revenue (Million) Forecast, by Application 2019 & 2032
- Table 16: Canada Fish and Seafood Industry in US Revenue (Million) Forecast, by Application 2019 & 2032
- Table 17: Mexico Fish and Seafood Industry in US Revenue (Million) Forecast, by Application 2019 & 2032
- Table 18: Global Fish and Seafood Industry in US Revenue Million Forecast, by Type 2019 & 2032
- Table 19: Global Fish and Seafood Industry in US Revenue Million Forecast, by Form 2019 & 2032
- Table 20: Global Fish and Seafood Industry in US Revenue Million Forecast, by Distribution Channel 2019 & 2032
- Table 21: Global Fish and Seafood Industry in US Revenue Million Forecast, by Country 2019 & 2032
- Table 22: Brazil Fish and Seafood Industry in US Revenue (Million) Forecast, by Application 2019 & 2032
- Table 23: Argentina Fish and Seafood Industry in US Revenue (Million) Forecast, by Application 2019 & 2032
- Table 24: Rest of South America Fish and Seafood Industry in US Revenue (Million) Forecast, by Application 2019 & 2032
- Table 25: Global Fish and Seafood Industry in US Revenue Million Forecast, by Type 2019 & 2032
- Table 26: Global Fish and Seafood Industry in US Revenue Million Forecast, by Form 2019 & 2032
- Table 27: Global Fish and Seafood Industry in US Revenue Million Forecast, by Distribution Channel 2019 & 2032
- Table 28: Global Fish and Seafood Industry in US Revenue Million Forecast, by Country 2019 & 2032
- Table 29: United Kingdom Fish and Seafood Industry in US Revenue (Million) Forecast, by Application 2019 & 2032
- Table 30: Germany Fish and Seafood Industry in US Revenue (Million) Forecast, by Application 2019 & 2032
- Table 31: France Fish and Seafood Industry in US Revenue (Million) Forecast, by Application 2019 & 2032
- Table 32: Italy Fish and Seafood Industry in US Revenue (Million) Forecast, by Application 2019 & 2032
- Table 33: Spain Fish and Seafood Industry in US Revenue (Million) Forecast, by Application 2019 & 2032
- Table 34: Russia Fish and Seafood Industry in US Revenue (Million) Forecast, by Application 2019 & 2032
- Table 35: Benelux Fish and Seafood Industry in US Revenue (Million) Forecast, by Application 2019 & 2032
- Table 36: Nordics Fish and Seafood Industry in US Revenue (Million) Forecast, by Application 2019 & 2032
- Table 37: Rest of Europe Fish and Seafood Industry in US Revenue (Million) Forecast, by Application 2019 & 2032
- Table 38: Global Fish and Seafood Industry in US Revenue Million Forecast, by Type 2019 & 2032
- Table 39: Global Fish and Seafood Industry in US Revenue Million Forecast, by Form 2019 & 2032
- Table 40: Global Fish and Seafood Industry in US Revenue Million Forecast, by Distribution Channel 2019 & 2032
- Table 41: Global Fish and Seafood Industry in US Revenue Million Forecast, by Country 2019 & 2032
- Table 42: Turkey Fish and Seafood Industry in US Revenue (Million) Forecast, by Application 2019 & 2032
- Table 43: Israel Fish and Seafood Industry in US Revenue (Million) Forecast, by Application 2019 & 2032
- Table 44: GCC Fish and Seafood Industry in US Revenue (Million) Forecast, by Application 2019 & 2032
- Table 45: North Africa Fish and Seafood Industry in US Revenue (Million) Forecast, by Application 2019 & 2032
- Table 46: South Africa Fish and Seafood Industry in US Revenue (Million) Forecast, by Application 2019 & 2032
- Table 47: Rest of Middle East & Africa Fish and Seafood Industry in US Revenue (Million) Forecast, by Application 2019 & 2032
- Table 48: Global Fish and Seafood Industry in US Revenue Million Forecast, by Type 2019 & 2032
- Table 49: Global Fish and Seafood Industry in US Revenue Million Forecast, by Form 2019 & 2032
- Table 50: Global Fish and Seafood Industry in US Revenue Million Forecast, by Distribution Channel 2019 & 2032
- Table 51: Global Fish and Seafood Industry in US Revenue Million Forecast, by Country 2019 & 2032
- Table 52: China Fish and Seafood Industry in US Revenue (Million) Forecast, by Application 2019 & 2032
- Table 53: India Fish and Seafood Industry in US Revenue (Million) Forecast, by Application 2019 & 2032
- Table 54: Japan Fish and Seafood Industry in US Revenue (Million) Forecast, by Application 2019 & 2032
- Table 55: South Korea Fish and Seafood Industry in US Revenue (Million) Forecast, by Application 2019 & 2032
- Table 56: ASEAN Fish and Seafood Industry in US Revenue (Million) Forecast, by Application 2019 & 2032
- Table 57: Oceania Fish and Seafood Industry in US Revenue (Million) Forecast, by Application 2019 & 2032
- Table 58: Rest of Asia Pacific Fish and Seafood Industry in US Revenue (Million) Forecast, by Application 2019 & 2032
Frequently Asked Questions
1. What is the projected Compound Annual Growth Rate (CAGR) of the Fish and Seafood Industry in US?
The projected CAGR is approximately 6.04%.
2. Which companies are prominent players in the Fish and Seafood Industry in US?
Key companies in the market include Trident Seafood Corporatio, Admiralty Island Fisheries Inc, Beaver Street Fisheries, Inland Seafood Inc, NH Foods Ltd, High Liner Foods Inc, Sysco Corporation, The Kraft Heinz Company, Thai Union Group PCL, Mowi ASA.
3. What are the main segments of the Fish and Seafood Industry in US?
The market segments include Type, Form, Distribution Channel.
4. Can you provide details about the market size?
The market size is estimated to be USD XX Million as of 2022.
5. What are some drivers contributing to market growth?
Increasing Focus on Maintaining Health and Well-Being; Launching Supplements For Specific Purposes and Targeted Population.
6. What are the notable trends driving market growth?
OTHER KEY INDUSTRY TRENDS COVERED IN THE REPORT.
7. Are there any restraints impacting market growth?
Supplement Consumption and Their Side-effects; Inclination Towards Substitute Products.
8. Can you provide examples of recent developments in the market?
May 2023: Trident Seafood Corporation has collaborated with Copper River Prince William Sound Marketing Association to introduce new Prized Fish product range in the United Staes Market.April 2023: Inland Seafood opened a new facility of its own in Jefferson Parish. They invested approximately USD 4 million in order to purchase and renovate a 14,000-square-foot facility in Elmwood, bringing 55 jobs to Jefferson Parish.January 2023: In order to expand their operations in the western part of the United States Inland Seafood acquired Texas-based Lonestar Seafood. The Texas-based supplier is famous for the quality of lobsters they supply.
9. What pricing options are available for accessing the report?
Pricing options include single-user, multi-user, and enterprise licenses priced at USD 3800, USD 4500, and USD 5800 respectively.
10. Is the market size provided in terms of value or volume?
The market size is provided in terms of value, measured in Million.
11. Are there any specific market keywords associated with the report?
Yes, the market keyword associated with the report is "Fish and Seafood Industry in US," which aids in identifying and referencing the specific market segment covered.
12. How do I determine which pricing option suits my needs best?
The pricing options vary based on user requirements and access needs. Individual users may opt for single-user licenses, while businesses requiring broader access may choose multi-user or enterprise licenses for cost-effective access to the report.
13. Are there any additional resources or data provided in the Fish and Seafood Industry in US report?
While the report offers comprehensive insights, it's advisable to review the specific contents or supplementary materials provided to ascertain if additional resources or data are available.
14. How can I stay updated on further developments or reports in the Fish and Seafood Industry in US?
To stay informed about further developments, trends, and reports in the Fish and Seafood Industry in US, consider subscribing to industry newsletters, following relevant companies and organizations, or regularly checking reputable industry news sources and publications.
Methodology
Step 1 - Identification of Relevant Samples Size from Population Database


Step 2 - Approaches for Defining Global Market Size (Value, Volume* & Price*)

Note*: In applicable scenarios
Step 3 - Data Sources
Primary Research
- Web Analytics
- Survey Reports
- Research Institute
- Latest Research Reports
- Opinion Leaders
Secondary Research
- Annual Reports
- White Paper
- Latest Press Release
- Industry Association
- Paid Database
- Investor Presentations

Step 4 - Data Triangulation
Involves using different sources of information in order to increase the validity of a study
These sources are likely to be stakeholders in a program - participants, other researchers, program staff, other community members, and so on.
Then we put all data in single framework & apply various statistical tools to find out the dynamic on the market.
During the analysis stage, feedback from the stakeholder groups would be compared to determine areas of agreement as well as areas of divergence


