
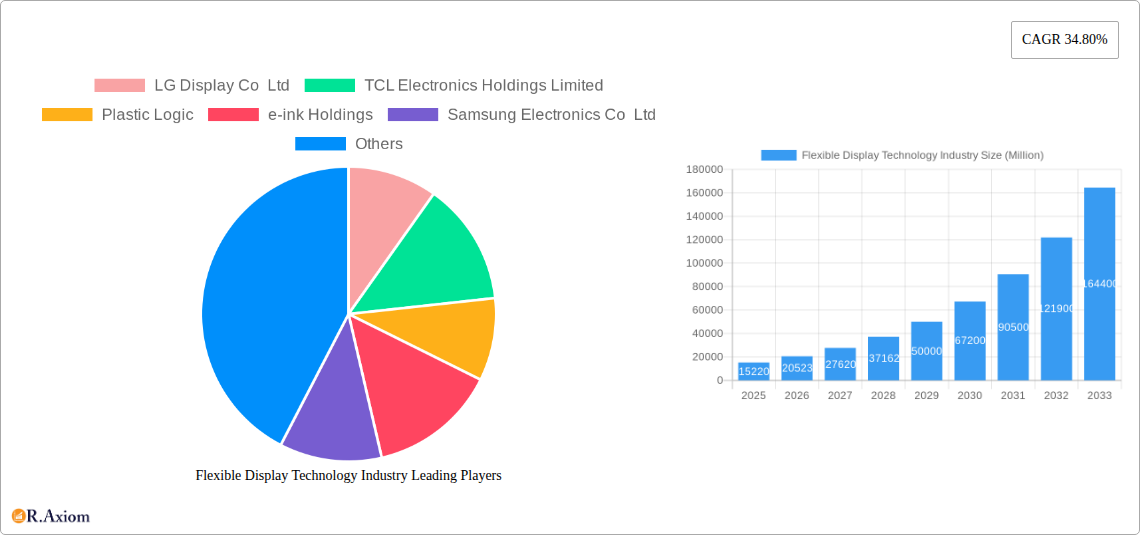
Key Insights
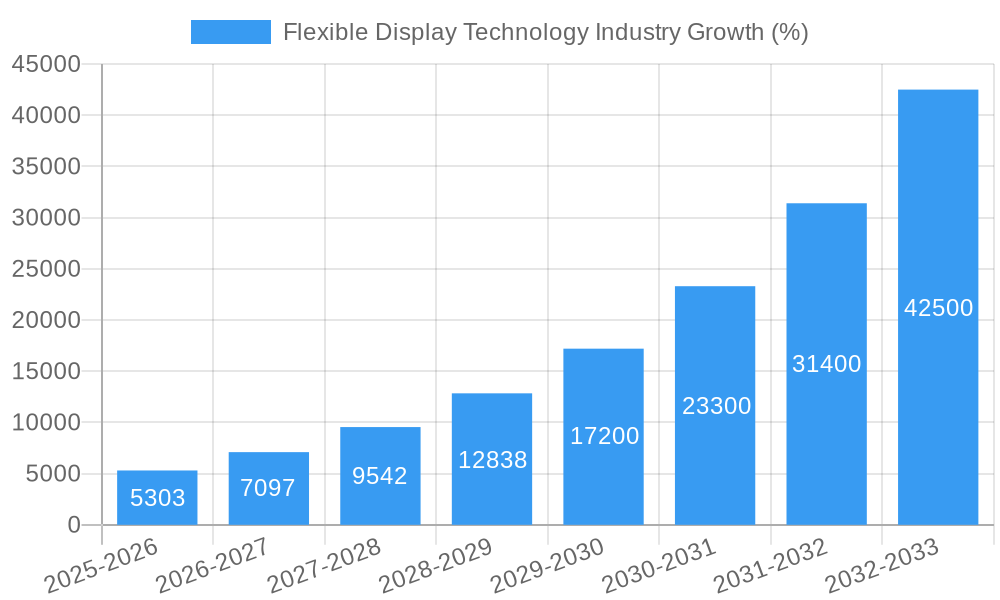
The flexible display technology market is experiencing robust growth, projected to reach \$15.22 billion in 2025 and expand significantly over the forecast period (2025-2033). A compound annual growth rate (CAGR) of 34.80% signifies substantial market dynamism driven by several key factors. The increasing demand for foldable smartphones and wearable devices is a major catalyst, pushing manufacturers to innovate and integrate flexible displays into their products. Furthermore, the automotive industry's adoption of flexible displays in dashboards and infotainment systems is another significant driver, contributing to market expansion. Technological advancements in materials science, particularly the development of more durable and cost-effective flexible substrates like plastic, are also fueling this growth trajectory. While challenges remain, such as the higher manufacturing costs compared to traditional rigid displays and potential durability concerns, the overall market outlook remains overwhelmingly positive. Segmentation analysis reveals that OLED displays currently hold a dominant position within the flexible display market, followed by LCD and EPD. The Asia Pacific region is expected to maintain a leading market share owing to the concentration of major display manufacturers and strong demand from the consumer electronics sector in countries like China, South Korea, and Japan. Companies such as Samsung, LG, BOE, and others are at the forefront of innovation, driving both technological advancements and market competition.
The continued miniaturization and enhanced functionalities of flexible displays are poised to further expand their application across various sectors. This includes growth in smartwatches, augmented reality (AR) and virtual reality (VR) headsets, and even healthcare applications where flexible displays can be incorporated into wearable health monitors. The market is also seeing increased investment in research and development focused on improving display flexibility, resolution, and energy efficiency. Addressing the challenges related to cost and durability is crucial for wider market penetration; however, ongoing technological breakthroughs suggest these hurdles are progressively being overcome. Competitive pressures are encouraging innovation and price reductions, making flexible displays increasingly accessible to a wider range of applications and consumers. The long-term forecast indicates sustained growth, solidifying flexible displays' role as a transformative technology across multiple sectors.
Flexible Display Technology Industry: A Comprehensive Market Report (2019-2033)
This in-depth report provides a comprehensive analysis of the Flexible Display Technology industry, covering market size, segmentation, growth drivers, challenges, and key players. The study period spans from 2019 to 2033, with 2025 as the base and estimated year. The forecast period is 2025-2033, and the historical period covers 2019-2024. This report is invaluable for industry stakeholders, investors, and strategic decision-makers seeking to understand and capitalize on the opportunities within this dynamic market, projected to reach xx Million by 2033.
Flexible Display Technology Industry Market Concentration & Innovation
The flexible display technology market is characterized by a moderately concentrated landscape, with a few major players holding significant market share. Companies like Samsung Electronics Co Ltd, LG Display Co Ltd, and BOE Technology Group Co Ltd dominate the market, accounting for an estimated xx% of global revenue in 2024. However, several smaller, innovative companies are challenging the incumbents through technological advancements and niche applications.
Market Concentration Metrics (2024 Estimates):
- Top 3 players market share: xx%
- Top 5 players market share: xx%
- Average market share of top 10 players: xx%
Innovation Drivers:
- Advancements in materials science: Development of flexible substrates (plastic, etc.) enabling lighter, thinner, and more durable displays.
- Improved display technologies: OLED, AMOLED, and EPD technologies offer enhanced visuals and power efficiency.
- Miniaturization and integration: Smaller, more energy-efficient components are driving integration into wearable devices and IoT applications.
Regulatory Frameworks & Standards: Global regulatory bodies are increasingly focusing on the environmental impact of electronic waste and promoting sustainable manufacturing processes. This necessitates adherence to standards related to materials sourcing, energy efficiency, and end-of-life management.
Product Substitutes: Traditional rigid displays remain a significant substitute, particularly in cost-sensitive applications. However, the increasing demand for flexible, foldable, and rollable displays is driving market growth.
End-User Trends: Growing consumer preference for portable, sleek, and aesthetically pleasing devices fuels the demand for flexible displays in smartphones, wearables, and foldable laptops.
M&A Activities: The industry has witnessed several mergers and acquisitions in recent years, primarily focused on acquiring smaller technology firms with specialized expertise and securing access to new technologies. The total value of M&A deals in the flexible display industry from 2019 to 2024 is estimated at xx Million.
Flexible Display Technology Industry Industry Trends & Insights
The flexible display technology market is experiencing robust growth, driven by several factors. The Compound Annual Growth Rate (CAGR) from 2025 to 2033 is projected to be xx%, indicating significant market expansion. This growth is fueled by increasing demand from various applications, particularly smartphones, wearables, and foldable devices. Market penetration is steadily increasing, particularly in high-growth regions like Asia-Pacific. Technological advancements such as improved OLED technology, the development of stretchable displays, and the integration of advanced functionalities are shaping the market landscape. Consumer preferences for stylish, compact, and multi-functional devices further drive the demand. Competitive dynamics are intense, with established players and new entrants vying for market share through innovation and strategic partnerships.
Dominant Markets & Segments in Flexible Display Technology Industry
Leading Region: Asia-Pacific dominates the flexible display technology market due to a strong manufacturing base, high consumer electronics adoption rates, and favorable government policies. China, South Korea, and Taiwan are key contributors to regional growth.
Dominant Segments:
By Substrate Material: Plastic substrates are gaining traction due to their flexibility and lightweight characteristics, although glass continues to maintain a dominant share due to its established manufacturing processes and superior image quality. Other substrate materials account for a relatively smaller share but are expected to grow significantly as technologies advance.
By Application: Smartphones and tablets are the largest application segment, followed by televisions and digital signage. Smart wearables are a rapidly expanding segment with significant growth potential. The automotive sector and public transportation sectors offer emerging opportunities.
By Display Type: OLED displays dominate the flexible display market due to their superior image quality, power efficiency, and flexible form factor. LCDs hold a significant share, although OLED adoption is increasing. EPD (Electronic Paper Display) technologies find niche applications in e-readers and digital signage.
Key Drivers for Dominant Segments (using examples):
- Smartphones & Tablets: High demand for foldable smartphones and tablets is propelling this segment’s growth.
- Wearables: The burgeoning smartwatch and fitness tracker market is fostering demand for smaller, lighter, and more flexible displays.
- OLED Displays: OLED's superior image quality and flexible nature are driving its popularity.
Flexible Display Technology Industry Product Developments
Recent advancements focus on higher resolution, improved brightness, and enhanced durability. The development of stretchable displays represents a significant leap forward, promising greater flexibility and integration into various applications beyond the conventional rigid formats. Companies are increasingly focusing on improving power efficiency and reducing manufacturing costs to enhance market competitiveness. This technological push towards thinner, lighter, and more durable flexible displays is creating diverse applications and expanding the market's reach into new sectors like automotive and healthcare.
Report Scope & Segmentation Analysis
This report comprehensively analyzes the flexible display technology market based on substrate material (glass, plastic, other), application (smartphones and tablets, smart wearables, televisions and digital signage, personal computers and laptops, other applications), and display type (OLED, LCD, EPD, other). Each segment is analyzed for its market size, growth projections, and competitive dynamics. The report provides detailed forecasts for the period 2025-2033, outlining the market's trajectory for each segment. The competitive landscape within each segment is also examined, identifying key players and their strategies.
Key Drivers of Flexible Display Technology Industry Growth
The industry is propelled by several key drivers:
- Technological advancements: Continuous improvements in display technology, materials science, and manufacturing processes. Examples include the introduction of new OLED technologies and the development of flexible and stretchable displays.
- Rising consumer demand: Growing demand for sleek, portable, and multifunctional devices across diverse applications.
- Favorable government policies: Support from governments in promoting advanced technology sectors through subsidies and investments.
Challenges in the Flexible Display Technology Industry Sector
Several challenges hinder industry growth:
- High manufacturing costs: The production of flexible displays involves complex processes and specialized materials, resulting in high manufacturing costs.
- Supply chain disruptions: Geopolitical factors and resource scarcity can disrupt the supply chain, affecting production and costs.
- Intense competition: Established players and new entrants are vying for market share, creating a highly competitive environment. This puts pressure on pricing and profit margins.
Emerging Opportunities in Flexible Display Technology Industry
Emerging opportunities include:
- New applications: Expanding into emerging markets like automotive, healthcare, and industrial applications.
- Next-generation technologies: The development of micro-LED, quantum dot displays, and other advanced technologies.
- Sustainable manufacturing: Adopting sustainable practices to reduce the environmental impact and meet growing environmental regulations.
Leading Players in the Flexible Display Technology Industry Market
- LG Display Co Ltd
- TCL Electronics Holdings Limited
- Plastic Logic
- e-ink Holdings
- Samsung Electronics Co Ltd
- FlexEnable Technology Limited
- Innolux Corporation
- Guangzhou Oed Technologies Co Ltd
- Chunghwa Picture Tubes Ltd
- Microtips Technology
- Huawei Technologies Co Ltd
- Sharp Corporation
- ROYOLE Corporation
- AU Optronics Corp
- BOE Technology Group Co Ltd
Key Developments in Flexible Display Technology Industry Industry
- May 2022: LG Display showcased its next-generation OLED solutions at SID 2022, highlighting advancements in bendable and foldable OLED panels. This development solidified LG Display's position in the premium flexible display market.
- March 2022: Stanford engineers announced a high-brightness, stretchable display, representing a breakthrough in flexible display technology and opening up new possibilities for human-computer interaction.
Strategic Outlook for Flexible Display Technology Industry Market
The flexible display technology market is poised for substantial growth, driven by continuous technological innovation, increasing consumer demand, and expansion into new applications. The market's future will be shaped by the adoption of advanced technologies, strategic partnerships, and the ability of companies to meet the evolving needs of consumers and diverse industry sectors. The market's potential is significant, with further expansion across various sectors.
Flexible Display Technology Industry Segmentation
-
1. Display Type
- 1.1. OLED
- 1.2. LCD
- 1.3. EPD (Electronic Paper Display)
- 1.4. Other Display Types (LED)
-
2. Substrate Material
- 2.1. Glass
- 2.2. Plastic
- 2.3. Other Substrate Materials
-
3. Application
- 3.1. Smartphones and Tablets
- 3.2. Smart Wearables
- 3.3. Televisions and Digital Signage Systems
- 3.4. Personal Computers and Laptops
- 3.5. Other Ap
Flexible Display Technology Industry Segmentation By Geography
- 1. North America
- 2. Europe
- 3. Asia Pacific
- 4. Rest of the World

Flexible Display Technology Industry REPORT HIGHLIGHTS
| Aspects | Details |
|---|---|
| Study Period | 2019-2033 |
| Base Year | 2024 |
| Estimated Year | 2025 |
| Forecast Period | 2025-2033 |
| Historical Period | 2019-2024 |
| Growth Rate | CAGR of 34.80% from 2019-2033 |
| Segmentation |
|
Table of Contents
- 1. Introduction
- 1.1. Research Scope
- 1.2. Market Segmentation
- 1.3. Research Methodology
- 1.4. Definitions and Assumptions
- 2. Executive Summary
- 2.1. Introduction
- 3. Market Dynamics
- 3.1. Introduction
- 3.2. Market Drivers
- 3.2.1. Innovation in Consumer Electronics; Increase in Demand for Greater Picture Quality
- 3.3. Market Restrains
- 3.3.1. Higher R&D Cost and Highly Dynamic Market
- 3.4. Market Trends
- 3.4.1. Adoption of Flexible Display to Grow Significantly in Smartphones and Tablets
- 4. Market Factor Analysis
- 4.1. Porters Five Forces
- 4.2. Supply/Value Chain
- 4.3. PESTEL analysis
- 4.4. Market Entropy
- 4.5. Patent/Trademark Analysis
- 5. Global Flexible Display Technology Industry Analysis, Insights and Forecast, 2019-2031
- 5.1. Market Analysis, Insights and Forecast - by Display Type
- 5.1.1. OLED
- 5.1.2. LCD
- 5.1.3. EPD (Electronic Paper Display)
- 5.1.4. Other Display Types (LED)
- 5.2. Market Analysis, Insights and Forecast - by Substrate Material
- 5.2.1. Glass
- 5.2.2. Plastic
- 5.2.3. Other Substrate Materials
- 5.3. Market Analysis, Insights and Forecast - by Application
- 5.3.1. Smartphones and Tablets
- 5.3.2. Smart Wearables
- 5.3.3. Televisions and Digital Signage Systems
- 5.3.4. Personal Computers and Laptops
- 5.3.5. Other Ap
- 5.4. Market Analysis, Insights and Forecast - by Region
- 5.4.1. North America
- 5.4.2. Europe
- 5.4.3. Asia Pacific
- 5.4.4. Rest of the World
- 5.1. Market Analysis, Insights and Forecast - by Display Type
- 6. North America Flexible Display Technology Industry Analysis, Insights and Forecast, 2019-2031
- 6.1. Market Analysis, Insights and Forecast - by Display Type
- 6.1.1. OLED
- 6.1.2. LCD
- 6.1.3. EPD (Electronic Paper Display)
- 6.1.4. Other Display Types (LED)
- 6.2. Market Analysis, Insights and Forecast - by Substrate Material
- 6.2.1. Glass
- 6.2.2. Plastic
- 6.2.3. Other Substrate Materials
- 6.3. Market Analysis, Insights and Forecast - by Application
- 6.3.1. Smartphones and Tablets
- 6.3.2. Smart Wearables
- 6.3.3. Televisions and Digital Signage Systems
- 6.3.4. Personal Computers and Laptops
- 6.3.5. Other Ap
- 6.1. Market Analysis, Insights and Forecast - by Display Type
- 7. Europe Flexible Display Technology Industry Analysis, Insights and Forecast, 2019-2031
- 7.1. Market Analysis, Insights and Forecast - by Display Type
- 7.1.1. OLED
- 7.1.2. LCD
- 7.1.3. EPD (Electronic Paper Display)
- 7.1.4. Other Display Types (LED)
- 7.2. Market Analysis, Insights and Forecast - by Substrate Material
- 7.2.1. Glass
- 7.2.2. Plastic
- 7.2.3. Other Substrate Materials
- 7.3. Market Analysis, Insights and Forecast - by Application
- 7.3.1. Smartphones and Tablets
- 7.3.2. Smart Wearables
- 7.3.3. Televisions and Digital Signage Systems
- 7.3.4. Personal Computers and Laptops
- 7.3.5. Other Ap
- 7.1. Market Analysis, Insights and Forecast - by Display Type
- 8. Asia Pacific Flexible Display Technology Industry Analysis, Insights and Forecast, 2019-2031
- 8.1. Market Analysis, Insights and Forecast - by Display Type
- 8.1.1. OLED
- 8.1.2. LCD
- 8.1.3. EPD (Electronic Paper Display)
- 8.1.4. Other Display Types (LED)
- 8.2. Market Analysis, Insights and Forecast - by Substrate Material
- 8.2.1. Glass
- 8.2.2. Plastic
- 8.2.3. Other Substrate Materials
- 8.3. Market Analysis, Insights and Forecast - by Application
- 8.3.1. Smartphones and Tablets
- 8.3.2. Smart Wearables
- 8.3.3. Televisions and Digital Signage Systems
- 8.3.4. Personal Computers and Laptops
- 8.3.5. Other Ap
- 8.1. Market Analysis, Insights and Forecast - by Display Type
- 9. Rest of the World Flexible Display Technology Industry Analysis, Insights and Forecast, 2019-2031
- 9.1. Market Analysis, Insights and Forecast - by Display Type
- 9.1.1. OLED
- 9.1.2. LCD
- 9.1.3. EPD (Electronic Paper Display)
- 9.1.4. Other Display Types (LED)
- 9.2. Market Analysis, Insights and Forecast - by Substrate Material
- 9.2.1. Glass
- 9.2.2. Plastic
- 9.2.3. Other Substrate Materials
- 9.3. Market Analysis, Insights and Forecast - by Application
- 9.3.1. Smartphones and Tablets
- 9.3.2. Smart Wearables
- 9.3.3. Televisions and Digital Signage Systems
- 9.3.4. Personal Computers and Laptops
- 9.3.5. Other Ap
- 9.1. Market Analysis, Insights and Forecast - by Display Type
- 10. North America Flexible Display Technology Industry Analysis, Insights and Forecast, 2019-2031
- 10.1. Market Analysis, Insights and Forecast - By Country/Sub-region
- 10.1.1.
- 11. Europe Flexible Display Technology Industry Analysis, Insights and Forecast, 2019-2031
- 11.1. Market Analysis, Insights and Forecast - By Country/Sub-region
- 11.1.1.
- 12. Asia Pacific Flexible Display Technology Industry Analysis, Insights and Forecast, 2019-2031
- 12.1. Market Analysis, Insights and Forecast - By Country/Sub-region
- 12.1.1.
- 13. Rest of the World Flexible Display Technology Industry Analysis, Insights and Forecast, 2019-2031
- 13.1. Market Analysis, Insights and Forecast - By Country/Sub-region
- 13.1.1.
- 14. Competitive Analysis
- 14.1. Global Market Share Analysis 2024
- 14.2. Company Profiles
- 14.2.1 LG Display Co Ltd
- 14.2.1.1. Overview
- 14.2.1.2. Products
- 14.2.1.3. SWOT Analysis
- 14.2.1.4. Recent Developments
- 14.2.1.5. Financials (Based on Availability)
- 14.2.2 TCL Electronics Holdings Limited
- 14.2.2.1. Overview
- 14.2.2.2. Products
- 14.2.2.3. SWOT Analysis
- 14.2.2.4. Recent Developments
- 14.2.2.5. Financials (Based on Availability)
- 14.2.3 Plastic Logic
- 14.2.3.1. Overview
- 14.2.3.2. Products
- 14.2.3.3. SWOT Analysis
- 14.2.3.4. Recent Developments
- 14.2.3.5. Financials (Based on Availability)
- 14.2.4 e-ink Holdings
- 14.2.4.1. Overview
- 14.2.4.2. Products
- 14.2.4.3. SWOT Analysis
- 14.2.4.4. Recent Developments
- 14.2.4.5. Financials (Based on Availability)
- 14.2.5 Samsung Electronics Co Ltd
- 14.2.5.1. Overview
- 14.2.5.2. Products
- 14.2.5.3. SWOT Analysis
- 14.2.5.4. Recent Developments
- 14.2.5.5. Financials (Based on Availability)
- 14.2.6 FlexEnable Technology Limited
- 14.2.6.1. Overview
- 14.2.6.2. Products
- 14.2.6.3. SWOT Analysis
- 14.2.6.4. Recent Developments
- 14.2.6.5. Financials (Based on Availability)
- 14.2.7 Innolux Corporation
- 14.2.7.1. Overview
- 14.2.7.2. Products
- 14.2.7.3. SWOT Analysis
- 14.2.7.4. Recent Developments
- 14.2.7.5. Financials (Based on Availability)
- 14.2.8 Guangzhou Oed Technologies Co Ltd
- 14.2.8.1. Overview
- 14.2.8.2. Products
- 14.2.8.3. SWOT Analysis
- 14.2.8.4. Recent Developments
- 14.2.8.5. Financials (Based on Availability)
- 14.2.9 Chunghwa Picture Tubes Ltd
- 14.2.9.1. Overview
- 14.2.9.2. Products
- 14.2.9.3. SWOT Analysis
- 14.2.9.4. Recent Developments
- 14.2.9.5. Financials (Based on Availability)
- 14.2.10 Microtips Technology*List Not Exhaustive
- 14.2.10.1. Overview
- 14.2.10.2. Products
- 14.2.10.3. SWOT Analysis
- 14.2.10.4. Recent Developments
- 14.2.10.5. Financials (Based on Availability)
- 14.2.11 Huawei Technologies Co Ltd
- 14.2.11.1. Overview
- 14.2.11.2. Products
- 14.2.11.3. SWOT Analysis
- 14.2.11.4. Recent Developments
- 14.2.11.5. Financials (Based on Availability)
- 14.2.12 Sharp Corporation
- 14.2.12.1. Overview
- 14.2.12.2. Products
- 14.2.12.3. SWOT Analysis
- 14.2.12.4. Recent Developments
- 14.2.12.5. Financials (Based on Availability)
- 14.2.13 ROYOLE Corporation
- 14.2.13.1. Overview
- 14.2.13.2. Products
- 14.2.13.3. SWOT Analysis
- 14.2.13.4. Recent Developments
- 14.2.13.5. Financials (Based on Availability)
- 14.2.14 AU Optronics Corp
- 14.2.14.1. Overview
- 14.2.14.2. Products
- 14.2.14.3. SWOT Analysis
- 14.2.14.4. Recent Developments
- 14.2.14.5. Financials (Based on Availability)
- 14.2.15 BOE Technology Group Co Ltd
- 14.2.15.1. Overview
- 14.2.15.2. Products
- 14.2.15.3. SWOT Analysis
- 14.2.15.4. Recent Developments
- 14.2.15.5. Financials (Based on Availability)
- 14.2.1 LG Display Co Ltd
List of Figures
- Figure 1: Global Flexible Display Technology Industry Revenue Breakdown (Million, %) by Region 2024 & 2032
- Figure 2: North America Flexible Display Technology Industry Revenue (Million), by Country 2024 & 2032
- Figure 3: North America Flexible Display Technology Industry Revenue Share (%), by Country 2024 & 2032
- Figure 4: Europe Flexible Display Technology Industry Revenue (Million), by Country 2024 & 2032
- Figure 5: Europe Flexible Display Technology Industry Revenue Share (%), by Country 2024 & 2032
- Figure 6: Asia Pacific Flexible Display Technology Industry Revenue (Million), by Country 2024 & 2032
- Figure 7: Asia Pacific Flexible Display Technology Industry Revenue Share (%), by Country 2024 & 2032
- Figure 8: Rest of the World Flexible Display Technology Industry Revenue (Million), by Country 2024 & 2032
- Figure 9: Rest of the World Flexible Display Technology Industry Revenue Share (%), by Country 2024 & 2032
- Figure 10: North America Flexible Display Technology Industry Revenue (Million), by Display Type 2024 & 2032
- Figure 11: North America Flexible Display Technology Industry Revenue Share (%), by Display Type 2024 & 2032
- Figure 12: North America Flexible Display Technology Industry Revenue (Million), by Substrate Material 2024 & 2032
- Figure 13: North America Flexible Display Technology Industry Revenue Share (%), by Substrate Material 2024 & 2032
- Figure 14: North America Flexible Display Technology Industry Revenue (Million), by Application 2024 & 2032
- Figure 15: North America Flexible Display Technology Industry Revenue Share (%), by Application 2024 & 2032
- Figure 16: North America Flexible Display Technology Industry Revenue (Million), by Country 2024 & 2032
- Figure 17: North America Flexible Display Technology Industry Revenue Share (%), by Country 2024 & 2032
- Figure 18: Europe Flexible Display Technology Industry Revenue (Million), by Display Type 2024 & 2032
- Figure 19: Europe Flexible Display Technology Industry Revenue Share (%), by Display Type 2024 & 2032
- Figure 20: Europe Flexible Display Technology Industry Revenue (Million), by Substrate Material 2024 & 2032
- Figure 21: Europe Flexible Display Technology Industry Revenue Share (%), by Substrate Material 2024 & 2032
- Figure 22: Europe Flexible Display Technology Industry Revenue (Million), by Application 2024 & 2032
- Figure 23: Europe Flexible Display Technology Industry Revenue Share (%), by Application 2024 & 2032
- Figure 24: Europe Flexible Display Technology Industry Revenue (Million), by Country 2024 & 2032
- Figure 25: Europe Flexible Display Technology Industry Revenue Share (%), by Country 2024 & 2032
- Figure 26: Asia Pacific Flexible Display Technology Industry Revenue (Million), by Display Type 2024 & 2032
- Figure 27: Asia Pacific Flexible Display Technology Industry Revenue Share (%), by Display Type 2024 & 2032
- Figure 28: Asia Pacific Flexible Display Technology Industry Revenue (Million), by Substrate Material 2024 & 2032
- Figure 29: Asia Pacific Flexible Display Technology Industry Revenue Share (%), by Substrate Material 2024 & 2032
- Figure 30: Asia Pacific Flexible Display Technology Industry Revenue (Million), by Application 2024 & 2032
- Figure 31: Asia Pacific Flexible Display Technology Industry Revenue Share (%), by Application 2024 & 2032
- Figure 32: Asia Pacific Flexible Display Technology Industry Revenue (Million), by Country 2024 & 2032
- Figure 33: Asia Pacific Flexible Display Technology Industry Revenue Share (%), by Country 2024 & 2032
- Figure 34: Rest of the World Flexible Display Technology Industry Revenue (Million), by Display Type 2024 & 2032
- Figure 35: Rest of the World Flexible Display Technology Industry Revenue Share (%), by Display Type 2024 & 2032
- Figure 36: Rest of the World Flexible Display Technology Industry Revenue (Million), by Substrate Material 2024 & 2032
- Figure 37: Rest of the World Flexible Display Technology Industry Revenue Share (%), by Substrate Material 2024 & 2032
- Figure 38: Rest of the World Flexible Display Technology Industry Revenue (Million), by Application 2024 & 2032
- Figure 39: Rest of the World Flexible Display Technology Industry Revenue Share (%), by Application 2024 & 2032
- Figure 40: Rest of the World Flexible Display Technology Industry Revenue (Million), by Country 2024 & 2032
- Figure 41: Rest of the World Flexible Display Technology Industry Revenue Share (%), by Country 2024 & 2032
List of Tables
- Table 1: Global Flexible Display Technology Industry Revenue Million Forecast, by Region 2019 & 2032
- Table 2: Global Flexible Display Technology Industry Revenue Million Forecast, by Display Type 2019 & 2032
- Table 3: Global Flexible Display Technology Industry Revenue Million Forecast, by Substrate Material 2019 & 2032
- Table 4: Global Flexible Display Technology Industry Revenue Million Forecast, by Application 2019 & 2032
- Table 5: Global Flexible Display Technology Industry Revenue Million Forecast, by Region 2019 & 2032
- Table 6: Global Flexible Display Technology Industry Revenue Million Forecast, by Country 2019 & 2032
- Table 7: Flexible Display Technology Industry Revenue (Million) Forecast, by Application 2019 & 2032
- Table 8: Global Flexible Display Technology Industry Revenue Million Forecast, by Country 2019 & 2032
- Table 9: Flexible Display Technology Industry Revenue (Million) Forecast, by Application 2019 & 2032
- Table 10: Global Flexible Display Technology Industry Revenue Million Forecast, by Country 2019 & 2032
- Table 11: Flexible Display Technology Industry Revenue (Million) Forecast, by Application 2019 & 2032
- Table 12: Global Flexible Display Technology Industry Revenue Million Forecast, by Country 2019 & 2032
- Table 13: Flexible Display Technology Industry Revenue (Million) Forecast, by Application 2019 & 2032
- Table 14: Global Flexible Display Technology Industry Revenue Million Forecast, by Display Type 2019 & 2032
- Table 15: Global Flexible Display Technology Industry Revenue Million Forecast, by Substrate Material 2019 & 2032
- Table 16: Global Flexible Display Technology Industry Revenue Million Forecast, by Application 2019 & 2032
- Table 17: Global Flexible Display Technology Industry Revenue Million Forecast, by Country 2019 & 2032
- Table 18: Global Flexible Display Technology Industry Revenue Million Forecast, by Display Type 2019 & 2032
- Table 19: Global Flexible Display Technology Industry Revenue Million Forecast, by Substrate Material 2019 & 2032
- Table 20: Global Flexible Display Technology Industry Revenue Million Forecast, by Application 2019 & 2032
- Table 21: Global Flexible Display Technology Industry Revenue Million Forecast, by Country 2019 & 2032
- Table 22: Global Flexible Display Technology Industry Revenue Million Forecast, by Display Type 2019 & 2032
- Table 23: Global Flexible Display Technology Industry Revenue Million Forecast, by Substrate Material 2019 & 2032
- Table 24: Global Flexible Display Technology Industry Revenue Million Forecast, by Application 2019 & 2032
- Table 25: Global Flexible Display Technology Industry Revenue Million Forecast, by Country 2019 & 2032
- Table 26: Global Flexible Display Technology Industry Revenue Million Forecast, by Display Type 2019 & 2032
- Table 27: Global Flexible Display Technology Industry Revenue Million Forecast, by Substrate Material 2019 & 2032
- Table 28: Global Flexible Display Technology Industry Revenue Million Forecast, by Application 2019 & 2032
- Table 29: Global Flexible Display Technology Industry Revenue Million Forecast, by Country 2019 & 2032
Frequently Asked Questions
1. What is the projected Compound Annual Growth Rate (CAGR) of the Flexible Display Technology Industry?
The projected CAGR is approximately 34.80%.
2. Which companies are prominent players in the Flexible Display Technology Industry?
Key companies in the market include LG Display Co Ltd, TCL Electronics Holdings Limited, Plastic Logic, e-ink Holdings, Samsung Electronics Co Ltd, FlexEnable Technology Limited, Innolux Corporation, Guangzhou Oed Technologies Co Ltd, Chunghwa Picture Tubes Ltd, Microtips Technology*List Not Exhaustive, Huawei Technologies Co Ltd, Sharp Corporation, ROYOLE Corporation, AU Optronics Corp, BOE Technology Group Co Ltd.
3. What are the main segments of the Flexible Display Technology Industry?
The market segments include Display Type, Substrate Material, Application.
4. Can you provide details about the market size?
The market size is estimated to be USD 15.22 Million as of 2022.
5. What are some drivers contributing to market growth?
Innovation in Consumer Electronics; Increase in Demand for Greater Picture Quality.
6. What are the notable trends driving market growth?
Adoption of Flexible Display to Grow Significantly in Smartphones and Tablets.
7. Are there any restraints impacting market growth?
Higher R&D Cost and Highly Dynamic Market.
8. Can you provide examples of recent developments in the market?
May 2022 - LG Display brought its next-generation OLED solutions to the 2022 Society for Information Display (SID) held in San Jose, California, US. By introducing state-of-the-art OLED products ranging from its next-generation OLED.EX to bendable and foldable OLED panels, the company highlighted the evolution and versatility of OLED technology, aiming to solidify its OLED positioning in the market.
9. What pricing options are available for accessing the report?
Pricing options include single-user, multi-user, and enterprise licenses priced at USD 4750, USD 5250, and USD 8750 respectively.
10. Is the market size provided in terms of value or volume?
The market size is provided in terms of value, measured in Million.
11. Are there any specific market keywords associated with the report?
Yes, the market keyword associated with the report is "Flexible Display Technology Industry," which aids in identifying and referencing the specific market segment covered.
12. How do I determine which pricing option suits my needs best?
The pricing options vary based on user requirements and access needs. Individual users may opt for single-user licenses, while businesses requiring broader access may choose multi-user or enterprise licenses for cost-effective access to the report.
13. Are there any additional resources or data provided in the Flexible Display Technology Industry report?
While the report offers comprehensive insights, it's advisable to review the specific contents or supplementary materials provided to ascertain if additional resources or data are available.
14. How can I stay updated on further developments or reports in the Flexible Display Technology Industry?
To stay informed about further developments, trends, and reports in the Flexible Display Technology Industry, consider subscribing to industry newsletters, following relevant companies and organizations, or regularly checking reputable industry news sources and publications.
Methodology
Step 1 - Identification of Relevant Samples Size from Population Database


Step 2 - Approaches for Defining Global Market Size (Value, Volume* & Price*)

Note*: In applicable scenarios
Step 3 - Data Sources
Primary Research
- Web Analytics
- Survey Reports
- Research Institute
- Latest Research Reports
- Opinion Leaders
Secondary Research
- Annual Reports
- White Paper
- Latest Press Release
- Industry Association
- Paid Database
- Investor Presentations

Step 4 - Data Triangulation
Involves using different sources of information in order to increase the validity of a study
These sources are likely to be stakeholders in a program - participants, other researchers, program staff, other community members, and so on.
Then we put all data in single framework & apply various statistical tools to find out the dynamic on the market.
During the analysis stage, feedback from the stakeholder groups would be compared to determine areas of agreement as well as areas of divergence


