
Key Insights
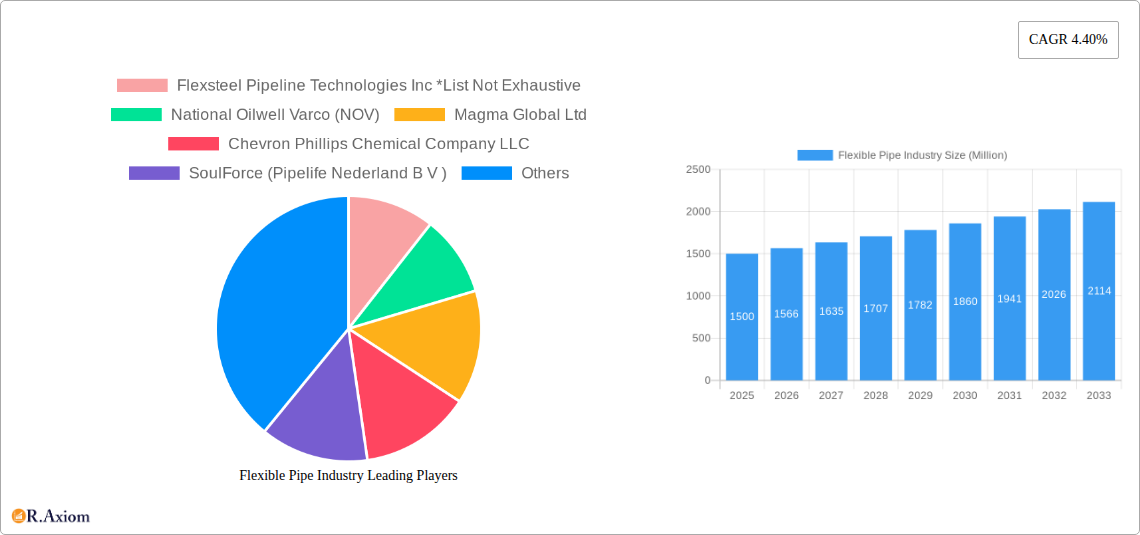
The flexible pipe industry, valued at approximately $XX million in 2025, is projected to experience robust growth, driven by a compound annual growth rate (CAGR) of 4.40% from 2025 to 2033. This expansion is fueled by several key factors. The increasing demand for offshore and ultra-deepwater oil and gas exploration and production necessitates the use of flexible pipes due to their superior flexibility and ability to withstand harsh underwater environments. Furthermore, the rising adoption of flexible pipes in subsea applications, particularly in challenging terrains, contributes significantly to market growth. Technological advancements leading to improved durability, enhanced resistance to corrosion, and increased operational efficiency of flexible pipes are further boosting market adoption. The major segments driving growth include high-density polyethylene (HDPE) and polyamide-based flexible pipes, primarily used in offshore and onshore applications. Key players like Flexsteel Pipeline Technologies Inc., National Oilwell Varco (NOV), and Magma Global Ltd. are actively involved in R&D and strategic partnerships to maintain a competitive edge. Geographic expansion, particularly in the Asia-Pacific region driven by significant energy infrastructure development, is another crucial aspect of the industry's growth trajectory.
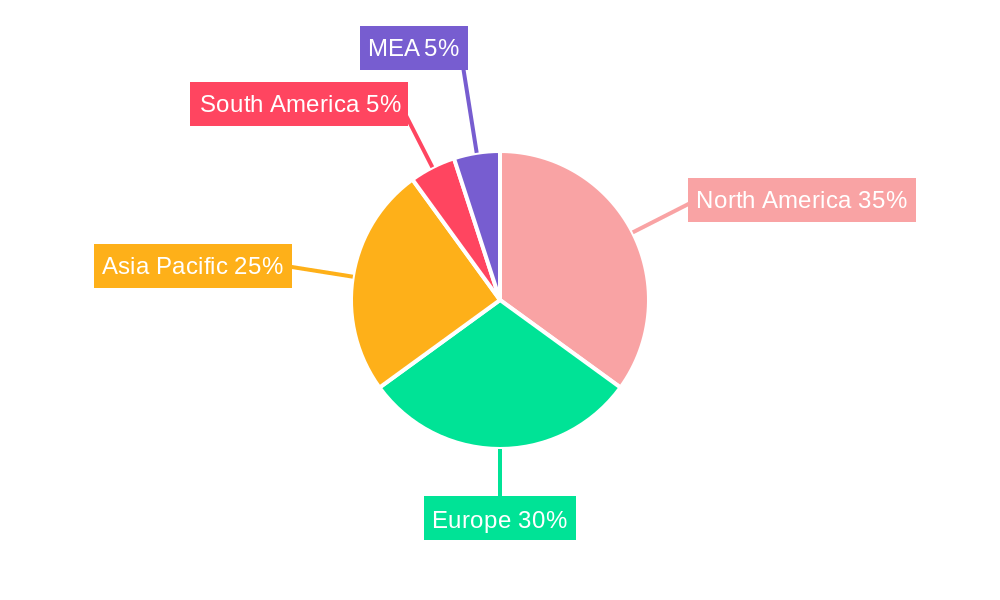
However, the market faces certain restraints. High initial investment costs associated with the manufacturing and installation of flexible pipes can pose a challenge for smaller players. Furthermore, concerns regarding the long-term environmental impact of material sourcing and potential risks associated with subsea installations need careful consideration. Nevertheless, the ongoing technological advancements focusing on sustainable materials and improved installation techniques are anticipated to mitigate these challenges. The industry's future hinges on continuous innovation, regulatory compliance concerning environmental sustainability, and the continued expansion of offshore and subsea energy projects globally. Given these factors, the flexible pipe market is poised for continued, if slightly moderated, expansion throughout the forecast period. A more granular regional analysis indicates that North America and Europe currently hold substantial market share, but the Asia-Pacific region is expected to witness the most rapid growth in the coming years.
This comprehensive report provides an in-depth analysis of the flexible pipe industry, offering valuable insights for stakeholders seeking to understand market trends, growth drivers, and competitive dynamics. The report covers the period from 2019 to 2033, with a base year of 2025 and a forecast period of 2025-2033. The analysis incorporates data from the historical period (2019-2024) and leverages extensive research to provide actionable intelligence. Key players such as Flexsteel Pipeline Technologies Inc, National Oilwell Varco (NOV), Magma Global Ltd, and others are profiled, providing a competitive landscape analysis. The report’s value extends to $xx Million and projects a significant growth trajectory.
Flexible Pipe Industry Market Concentration & Innovation
The flexible pipe market exhibits a moderately concentrated landscape, with a few major players holding significant market share. For example, National Oilwell Varco (NOV) and The Prysmian Group are estimated to collectively control approximately xx% of the market in 2025. However, the industry is characterized by ongoing innovation, driven by the need for enhanced performance in harsh environments and increasing demand for flexible pipes in various applications.
- Innovation Drivers: Development of advanced materials (e.g., high-performance polymers), improved manufacturing techniques, and integration of smart technologies (e.g., sensors for pipeline monitoring).
- Regulatory Frameworks: Stringent regulations regarding safety and environmental compliance are shaping the industry, impacting material selection and manufacturing processes.
- Product Substitutes: While flexible pipes offer distinct advantages, competition exists from traditional rigid pipelines, particularly in applications where cost is a primary concern.
- End-User Trends: Growth in offshore oil and gas exploration, coupled with the increasing adoption of flexible pipes in subsea applications, is a key market driver.
- M&A Activities: The industry has witnessed several mergers and acquisitions (M&As) in recent years, with deal values exceeding $xx Million in the period 2019-2024. These activities reflect consolidation trends and efforts to expand market reach and technological capabilities.
Flexible Pipe Industry Industry Trends & Insights
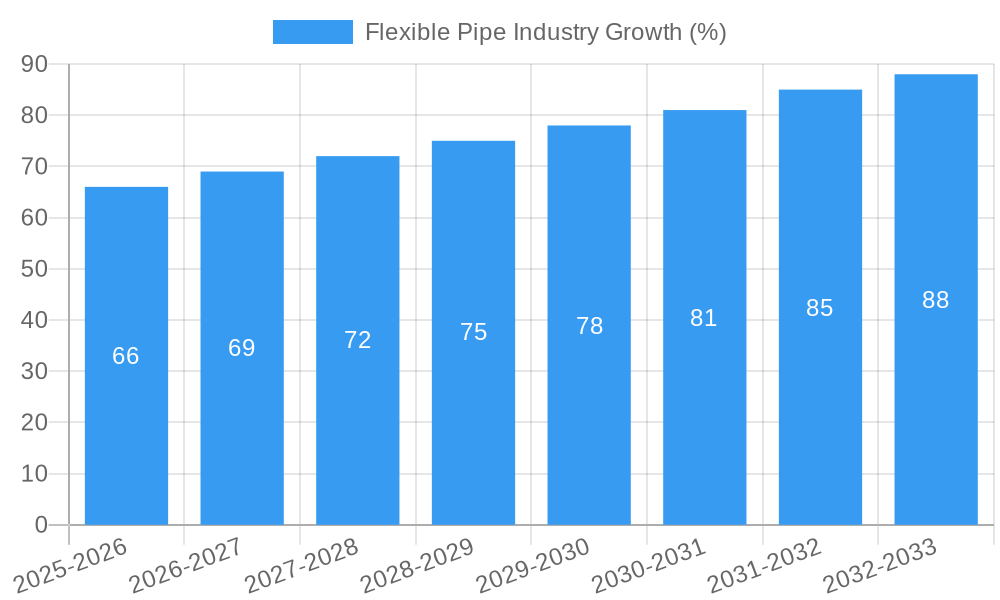
The global flexible pipe industry is experiencing robust growth, fueled by several key factors. The market is projected to achieve a Compound Annual Growth Rate (CAGR) of xx% during the forecast period (2025-2033). This growth is primarily driven by increasing demand from the offshore oil and gas sector, rising investments in renewable energy infrastructure (e.g., offshore wind farms), and the ongoing development of new applications in diverse sectors. Technological advancements such as the use of lighter, more durable materials are improving the efficiency and lifespan of flexible pipes, further boosting market demand. Market penetration of flexible pipes in certain niche applications remains low, offering substantial growth potential. Intense competition among leading players is pushing innovation and driving down prices, benefiting consumers.
Dominant Markets & Segments in Flexible Pipe Industry
The offshore segment dominates the flexible pipe market, driven by the increasing complexity and depth of subsea operations. The ultra-deepwater segment is exhibiting particularly strong growth. Within raw materials, high-density polyethylene (HDPE) holds the largest market share due to its cost-effectiveness and suitable properties.
Key Drivers for Dominant Segments:
- Offshore: Growing investments in offshore oil and gas exploration and production.
- Ultra-deepwater: Technological advancements enabling operation in extreme depths.
- High-density Polyethylene (HDPE): Cost-effectiveness, excellent flexibility, and chemical resistance.
Dominance Analysis:
The Asia-Pacific region is projected to witness the fastest growth in the flexible pipe market during the forecast period, driven by substantial investments in energy infrastructure and robust economic expansion.
Flexible Pipe Industry Product Developments
Recent product innovations focus on enhanced flexibility, durability, and resistance to harsh environmental conditions. Manufacturers are incorporating advanced materials and smart technologies to improve pipeline safety and operational efficiency. New applications are emerging in renewable energy, subsea power cables, and various industrial processes. The competitive landscape is characterized by a focus on developing specialized products tailored to specific customer needs.
Report Scope & Segmentation Analysis
This report segments the flexible pipe market by raw material (High-density Polyethylene, Polyamides, Polyvinylidene Fluoride, Other Raw Materials) and by application (Offshore, Ultra-deepwater, Onshore). Each segment is analyzed in terms of market size, growth projections, and competitive dynamics. The analysis provides a detailed understanding of the market's diverse components and their growth trajectories. For example, the high-density polyethylene (HDPE) segment is expected to exhibit significant growth, driven by its cost-effectiveness and adaptability. The offshore application segment is poised for robust expansion, fueled by ongoing investments in offshore energy infrastructure.
Key Drivers of Flexible Pipe Industry Growth
The flexible pipe industry's growth is primarily driven by technological advancements (e.g., development of high-performance polymers), increasing demand from the offshore oil and gas sector and renewable energy, and favorable government policies supporting energy infrastructure development. Economic growth in developing nations is also contributing to increased demand for flexible pipes in various applications.
Challenges in the Flexible Pipe Industry Sector
The flexible pipe industry faces challenges such as stringent regulatory requirements, fluctuations in raw material prices, and intense competition from existing and emerging players. Supply chain disruptions can also impact production and availability, leading to increased costs. These factors pose significant hurdles to consistent growth.
Emerging Opportunities in Flexible Pipe Industry
Emerging opportunities include the expansion into new markets (e.g., renewable energy, aquaculture), the development of innovative materials with enhanced properties, and the integration of smart technologies for improved pipeline monitoring and maintenance. These trends provide significant potential for growth and innovation.
Leading Players in the Flexible Pipe Industry Market
- Flexsteel Pipeline Technologies Inc
- National Oilwell Varco (NOV)
- Magma Global Ltd
- Chevron Phillips Chemical Company LLC
- SoulForce (Pipelife Nederland B V )
- The Prysmian Group
- GE Oil & Gas Corporation
- Shawcor Ltd
- ContiTech AG
- TechnipFMC PLC
- Airborne Oil & Gas BV
Key Developments in Flexible Pipe Industry Industry
- January 2023: Magma Global Ltd. announced the successful completion of a major pipeline project utilizing its flexible pipe technology.
- June 2022: National Oilwell Varco (NOV) launched a new range of flexible pipes with enhanced durability and corrosion resistance.
- (Further developments to be added as data becomes available)
Strategic Outlook for Flexible Pipe Industry Market
The flexible pipe industry is poised for continued growth, driven by favorable market dynamics, technological advancements, and increasing demand from various sectors. The market's future potential is substantial, particularly in emerging markets and applications related to renewable energy and subsea infrastructure. Strategic investments in research and development, coupled with a focus on sustainability and efficient supply chains, will be crucial for success in this evolving landscape.
Flexible Pipe Industry Segmentation
-
1. Raw Material
- 1.1. High-density Polyethylene
- 1.2. Polyamides
- 1.3. Polyvinylidene Fluoride
- 1.4. Other Raw Materials
-
2. Application
-
2.1. Offshore
- 2.1.1. Deepwater
- 2.1.2. Ultra-deepwater
- 2.2. On shore
-
2.1. Offshore
Flexible Pipe Industry Segmentation By Geography
-
1. North America
- 1.1. United States
- 1.2. Canada
-
2. Europe
- 2.1. United Kingdom
- 2.2. Russia
- 2.3. Norway
- 2.4. Italy
- 2.5. Rest of Europe
-
3. Asia Pacific
- 3.1. China
- 3.2. India
- 3.3. Malaysia
- 3.4. Rest of Asia Pacific
-
4. Latin America
- 4.1. Brazil
- 4.2. Argentina
- 4.3. Rest of Latin America
- 5. Middle East
-
6. Saudi Arabia
- 6.1. United Arab Emirates
- 6.2. Rest of Middle East
Flexible Pipe Industry REPORT HIGHLIGHTS
| Aspects | Details |
|---|---|
| Study Period | 2019-2033 |
| Base Year | 2024 |
| Estimated Year | 2025 |
| Forecast Period | 2025-2033 |
| Historical Period | 2019-2024 |
| Growth Rate | CAGR of 4.40% from 2019-2033 |
| Segmentation |
|
Table of Contents
- 1. Introduction
- 1.1. Research Scope
- 1.2. Market Segmentation
- 1.3. Research Methodology
- 1.4. Definitions and Assumptions
- 2. Executive Summary
- 2.1. Introduction
- 3. Market Dynamics
- 3.1. Introduction
- 3.2. Market Drivers
- 3.2.1. ; Increasing Demand for Non-corrosive Pipes in Oil and Gas Industry; Technological Advances in Drilling Process
- 3.3. Market Restrains
- 3.3.1. ; Fluctuating Oil Prices
- 3.4. Market Trends
- 3.4.1. Oil and Gas Industry to Drive the Market
- 4. Market Factor Analysis
- 4.1. Porters Five Forces
- 4.2. Supply/Value Chain
- 4.3. PESTEL analysis
- 4.4. Market Entropy
- 4.5. Patent/Trademark Analysis
- 5. Global Flexible Pipe Industry Analysis, Insights and Forecast, 2019-2031
- 5.1. Market Analysis, Insights and Forecast - by Raw Material
- 5.1.1. High-density Polyethylene
- 5.1.2. Polyamides
- 5.1.3. Polyvinylidene Fluoride
- 5.1.4. Other Raw Materials
- 5.2. Market Analysis, Insights and Forecast - by Application
- 5.2.1. Offshore
- 5.2.1.1. Deepwater
- 5.2.1.2. Ultra-deepwater
- 5.2.2. On shore
- 5.2.1. Offshore
- 5.3. Market Analysis, Insights and Forecast - by Region
- 5.3.1. North America
- 5.3.2. Europe
- 5.3.3. Asia Pacific
- 5.3.4. Latin America
- 5.3.5. Middle East
- 5.3.6. Saudi Arabia
- 5.1. Market Analysis, Insights and Forecast - by Raw Material
- 6. North America Flexible Pipe Industry Analysis, Insights and Forecast, 2019-2031
- 6.1. Market Analysis, Insights and Forecast - by Raw Material
- 6.1.1. High-density Polyethylene
- 6.1.2. Polyamides
- 6.1.3. Polyvinylidene Fluoride
- 6.1.4. Other Raw Materials
- 6.2. Market Analysis, Insights and Forecast - by Application
- 6.2.1. Offshore
- 6.2.1.1. Deepwater
- 6.2.1.2. Ultra-deepwater
- 6.2.2. On shore
- 6.2.1. Offshore
- 6.1. Market Analysis, Insights and Forecast - by Raw Material
- 7. Europe Flexible Pipe Industry Analysis, Insights and Forecast, 2019-2031
- 7.1. Market Analysis, Insights and Forecast - by Raw Material
- 7.1.1. High-density Polyethylene
- 7.1.2. Polyamides
- 7.1.3. Polyvinylidene Fluoride
- 7.1.4. Other Raw Materials
- 7.2. Market Analysis, Insights and Forecast - by Application
- 7.2.1. Offshore
- 7.2.1.1. Deepwater
- 7.2.1.2. Ultra-deepwater
- 7.2.2. On shore
- 7.2.1. Offshore
- 7.1. Market Analysis, Insights and Forecast - by Raw Material
- 8. Asia Pacific Flexible Pipe Industry Analysis, Insights and Forecast, 2019-2031
- 8.1. Market Analysis, Insights and Forecast - by Raw Material
- 8.1.1. High-density Polyethylene
- 8.1.2. Polyamides
- 8.1.3. Polyvinylidene Fluoride
- 8.1.4. Other Raw Materials
- 8.2. Market Analysis, Insights and Forecast - by Application
- 8.2.1. Offshore
- 8.2.1.1. Deepwater
- 8.2.1.2. Ultra-deepwater
- 8.2.2. On shore
- 8.2.1. Offshore
- 8.1. Market Analysis, Insights and Forecast - by Raw Material
- 9. Latin America Flexible Pipe Industry Analysis, Insights and Forecast, 2019-2031
- 9.1. Market Analysis, Insights and Forecast - by Raw Material
- 9.1.1. High-density Polyethylene
- 9.1.2. Polyamides
- 9.1.3. Polyvinylidene Fluoride
- 9.1.4. Other Raw Materials
- 9.2. Market Analysis, Insights and Forecast - by Application
- 9.2.1. Offshore
- 9.2.1.1. Deepwater
- 9.2.1.2. Ultra-deepwater
- 9.2.2. On shore
- 9.2.1. Offshore
- 9.1. Market Analysis, Insights and Forecast - by Raw Material
- 10. Middle East Flexible Pipe Industry Analysis, Insights and Forecast, 2019-2031
- 10.1. Market Analysis, Insights and Forecast - by Raw Material
- 10.1.1. High-density Polyethylene
- 10.1.2. Polyamides
- 10.1.3. Polyvinylidene Fluoride
- 10.1.4. Other Raw Materials
- 10.2. Market Analysis, Insights and Forecast - by Application
- 10.2.1. Offshore
- 10.2.1.1. Deepwater
- 10.2.1.2. Ultra-deepwater
- 10.2.2. On shore
- 10.2.1. Offshore
- 10.1. Market Analysis, Insights and Forecast - by Raw Material
- 11. Saudi Arabia Flexible Pipe Industry Analysis, Insights and Forecast, 2019-2031
- 11.1. Market Analysis, Insights and Forecast - by Raw Material
- 11.1.1. High-density Polyethylene
- 11.1.2. Polyamides
- 11.1.3. Polyvinylidene Fluoride
- 11.1.4. Other Raw Materials
- 11.2. Market Analysis, Insights and Forecast - by Application
- 11.2.1. Offshore
- 11.2.1.1. Deepwater
- 11.2.1.2. Ultra-deepwater
- 11.2.2. On shore
- 11.2.1. Offshore
- 11.1. Market Analysis, Insights and Forecast - by Raw Material
- 12. North America Flexible Pipe Industry Analysis, Insights and Forecast, 2019-2031
- 12.1. Market Analysis, Insights and Forecast - By Country/Sub-region
- 12.1.1 United States
- 12.1.2 Canada
- 12.1.3 Mexico
- 13. Europe Flexible Pipe Industry Analysis, Insights and Forecast, 2019-2031
- 13.1. Market Analysis, Insights and Forecast - By Country/Sub-region
- 13.1.1 Germany
- 13.1.2 United Kingdom
- 13.1.3 France
- 13.1.4 Spain
- 13.1.5 Italy
- 13.1.6 Spain
- 13.1.7 Belgium
- 13.1.8 Netherland
- 13.1.9 Nordics
- 13.1.10 Rest of Europe
- 14. Asia Pacific Flexible Pipe Industry Analysis, Insights and Forecast, 2019-2031
- 14.1. Market Analysis, Insights and Forecast - By Country/Sub-region
- 14.1.1 China
- 14.1.2 Japan
- 14.1.3 India
- 14.1.4 South Korea
- 14.1.5 Southeast Asia
- 14.1.6 Australia
- 14.1.7 Indonesia
- 14.1.8 Phillipes
- 14.1.9 Singapore
- 14.1.10 Thailandc
- 14.1.11 Rest of Asia Pacific
- 15. South America Flexible Pipe Industry Analysis, Insights and Forecast, 2019-2031
- 15.1. Market Analysis, Insights and Forecast - By Country/Sub-region
- 15.1.1 Brazil
- 15.1.2 Argentina
- 15.1.3 Peru
- 15.1.4 Chile
- 15.1.5 Colombia
- 15.1.6 Ecuador
- 15.1.7 Venezuela
- 15.1.8 Rest of South America
- 16. North America Flexible Pipe Industry Analysis, Insights and Forecast, 2019-2031
- 16.1. Market Analysis, Insights and Forecast - By Country/Sub-region
- 16.1.1 United States
- 16.1.2 Canada
- 16.1.3 Mexico
- 17. MEA Flexible Pipe Industry Analysis, Insights and Forecast, 2019-2031
- 17.1. Market Analysis, Insights and Forecast - By Country/Sub-region
- 17.1.1 United Arab Emirates
- 17.1.2 Saudi Arabia
- 17.1.3 South Africa
- 17.1.4 Rest of Middle East and Africa
- 18. Competitive Analysis
- 18.1. Global Market Share Analysis 2024
- 18.2. Company Profiles
- 18.2.1 Flexsteel Pipeline Technologies Inc *List Not Exhaustive
- 18.2.1.1. Overview
- 18.2.1.2. Products
- 18.2.1.3. SWOT Analysis
- 18.2.1.4. Recent Developments
- 18.2.1.5. Financials (Based on Availability)
- 18.2.2 National Oilwell Varco (NOV)
- 18.2.2.1. Overview
- 18.2.2.2. Products
- 18.2.2.3. SWOT Analysis
- 18.2.2.4. Recent Developments
- 18.2.2.5. Financials (Based on Availability)
- 18.2.3 Magma Global Ltd
- 18.2.3.1. Overview
- 18.2.3.2. Products
- 18.2.3.3. SWOT Analysis
- 18.2.3.4. Recent Developments
- 18.2.3.5. Financials (Based on Availability)
- 18.2.4 Chevron Phillips Chemical Company LLC
- 18.2.4.1. Overview
- 18.2.4.2. Products
- 18.2.4.3. SWOT Analysis
- 18.2.4.4. Recent Developments
- 18.2.4.5. Financials (Based on Availability)
- 18.2.5 SoulForce (Pipelife Nederland B V )
- 18.2.5.1. Overview
- 18.2.5.2. Products
- 18.2.5.3. SWOT Analysis
- 18.2.5.4. Recent Developments
- 18.2.5.5. Financials (Based on Availability)
- 18.2.6 The Prysmian Group
- 18.2.6.1. Overview
- 18.2.6.2. Products
- 18.2.6.3. SWOT Analysis
- 18.2.6.4. Recent Developments
- 18.2.6.5. Financials (Based on Availability)
- 18.2.7 GE Oil & Gas Corporation
- 18.2.7.1. Overview
- 18.2.7.2. Products
- 18.2.7.3. SWOT Analysis
- 18.2.7.4. Recent Developments
- 18.2.7.5. Financials (Based on Availability)
- 18.2.8 Shawcor Ltd
- 18.2.8.1. Overview
- 18.2.8.2. Products
- 18.2.8.3. SWOT Analysis
- 18.2.8.4. Recent Developments
- 18.2.8.5. Financials (Based on Availability)
- 18.2.9 ContiTech AG
- 18.2.9.1. Overview
- 18.2.9.2. Products
- 18.2.9.3. SWOT Analysis
- 18.2.9.4. Recent Developments
- 18.2.9.5. Financials (Based on Availability)
- 18.2.10 TechnipFMC PLC
- 18.2.10.1. Overview
- 18.2.10.2. Products
- 18.2.10.3. SWOT Analysis
- 18.2.10.4. Recent Developments
- 18.2.10.5. Financials (Based on Availability)
- 18.2.11 Airborne Oil & Gas BV
- 18.2.11.1. Overview
- 18.2.11.2. Products
- 18.2.11.3. SWOT Analysis
- 18.2.11.4. Recent Developments
- 18.2.11.5. Financials (Based on Availability)
- 18.2.1 Flexsteel Pipeline Technologies Inc *List Not Exhaustive
List of Figures
- Figure 1: Global Flexible Pipe Industry Revenue Breakdown (Million, %) by Region 2024 & 2032
- Figure 2: North America Flexible Pipe Industry Revenue (Million), by Country 2024 & 2032
- Figure 3: North America Flexible Pipe Industry Revenue Share (%), by Country 2024 & 2032
- Figure 4: Europe Flexible Pipe Industry Revenue (Million), by Country 2024 & 2032
- Figure 5: Europe Flexible Pipe Industry Revenue Share (%), by Country 2024 & 2032
- Figure 6: Asia Pacific Flexible Pipe Industry Revenue (Million), by Country 2024 & 2032
- Figure 7: Asia Pacific Flexible Pipe Industry Revenue Share (%), by Country 2024 & 2032
- Figure 8: South America Flexible Pipe Industry Revenue (Million), by Country 2024 & 2032
- Figure 9: South America Flexible Pipe Industry Revenue Share (%), by Country 2024 & 2032
- Figure 10: North America Flexible Pipe Industry Revenue (Million), by Country 2024 & 2032
- Figure 11: North America Flexible Pipe Industry Revenue Share (%), by Country 2024 & 2032
- Figure 12: MEA Flexible Pipe Industry Revenue (Million), by Country 2024 & 2032
- Figure 13: MEA Flexible Pipe Industry Revenue Share (%), by Country 2024 & 2032
- Figure 14: North America Flexible Pipe Industry Revenue (Million), by Raw Material 2024 & 2032
- Figure 15: North America Flexible Pipe Industry Revenue Share (%), by Raw Material 2024 & 2032
- Figure 16: North America Flexible Pipe Industry Revenue (Million), by Application 2024 & 2032
- Figure 17: North America Flexible Pipe Industry Revenue Share (%), by Application 2024 & 2032
- Figure 18: North America Flexible Pipe Industry Revenue (Million), by Country 2024 & 2032
- Figure 19: North America Flexible Pipe Industry Revenue Share (%), by Country 2024 & 2032
- Figure 20: Europe Flexible Pipe Industry Revenue (Million), by Raw Material 2024 & 2032
- Figure 21: Europe Flexible Pipe Industry Revenue Share (%), by Raw Material 2024 & 2032
- Figure 22: Europe Flexible Pipe Industry Revenue (Million), by Application 2024 & 2032
- Figure 23: Europe Flexible Pipe Industry Revenue Share (%), by Application 2024 & 2032
- Figure 24: Europe Flexible Pipe Industry Revenue (Million), by Country 2024 & 2032
- Figure 25: Europe Flexible Pipe Industry Revenue Share (%), by Country 2024 & 2032
- Figure 26: Asia Pacific Flexible Pipe Industry Revenue (Million), by Raw Material 2024 & 2032
- Figure 27: Asia Pacific Flexible Pipe Industry Revenue Share (%), by Raw Material 2024 & 2032
- Figure 28: Asia Pacific Flexible Pipe Industry Revenue (Million), by Application 2024 & 2032
- Figure 29: Asia Pacific Flexible Pipe Industry Revenue Share (%), by Application 2024 & 2032
- Figure 30: Asia Pacific Flexible Pipe Industry Revenue (Million), by Country 2024 & 2032
- Figure 31: Asia Pacific Flexible Pipe Industry Revenue Share (%), by Country 2024 & 2032
- Figure 32: Latin America Flexible Pipe Industry Revenue (Million), by Raw Material 2024 & 2032
- Figure 33: Latin America Flexible Pipe Industry Revenue Share (%), by Raw Material 2024 & 2032
- Figure 34: Latin America Flexible Pipe Industry Revenue (Million), by Application 2024 & 2032
- Figure 35: Latin America Flexible Pipe Industry Revenue Share (%), by Application 2024 & 2032
- Figure 36: Latin America Flexible Pipe Industry Revenue (Million), by Country 2024 & 2032
- Figure 37: Latin America Flexible Pipe Industry Revenue Share (%), by Country 2024 & 2032
- Figure 38: Middle East Flexible Pipe Industry Revenue (Million), by Raw Material 2024 & 2032
- Figure 39: Middle East Flexible Pipe Industry Revenue Share (%), by Raw Material 2024 & 2032
- Figure 40: Middle East Flexible Pipe Industry Revenue (Million), by Application 2024 & 2032
- Figure 41: Middle East Flexible Pipe Industry Revenue Share (%), by Application 2024 & 2032
- Figure 42: Middle East Flexible Pipe Industry Revenue (Million), by Country 2024 & 2032
- Figure 43: Middle East Flexible Pipe Industry Revenue Share (%), by Country 2024 & 2032
- Figure 44: Saudi Arabia Flexible Pipe Industry Revenue (Million), by Raw Material 2024 & 2032
- Figure 45: Saudi Arabia Flexible Pipe Industry Revenue Share (%), by Raw Material 2024 & 2032
- Figure 46: Saudi Arabia Flexible Pipe Industry Revenue (Million), by Application 2024 & 2032
- Figure 47: Saudi Arabia Flexible Pipe Industry Revenue Share (%), by Application 2024 & 2032
- Figure 48: Saudi Arabia Flexible Pipe Industry Revenue (Million), by Country 2024 & 2032
- Figure 49: Saudi Arabia Flexible Pipe Industry Revenue Share (%), by Country 2024 & 2032
List of Tables
- Table 1: Global Flexible Pipe Industry Revenue Million Forecast, by Region 2019 & 2032
- Table 2: Global Flexible Pipe Industry Revenue Million Forecast, by Raw Material 2019 & 2032
- Table 3: Global Flexible Pipe Industry Revenue Million Forecast, by Application 2019 & 2032
- Table 4: Global Flexible Pipe Industry Revenue Million Forecast, by Region 2019 & 2032
- Table 5: Global Flexible Pipe Industry Revenue Million Forecast, by Country 2019 & 2032
- Table 6: United States Flexible Pipe Industry Revenue (Million) Forecast, by Application 2019 & 2032
- Table 7: Canada Flexible Pipe Industry Revenue (Million) Forecast, by Application 2019 & 2032
- Table 8: Mexico Flexible Pipe Industry Revenue (Million) Forecast, by Application 2019 & 2032
- Table 9: Global Flexible Pipe Industry Revenue Million Forecast, by Country 2019 & 2032
- Table 10: Germany Flexible Pipe Industry Revenue (Million) Forecast, by Application 2019 & 2032
- Table 11: United Kingdom Flexible Pipe Industry Revenue (Million) Forecast, by Application 2019 & 2032
- Table 12: France Flexible Pipe Industry Revenue (Million) Forecast, by Application 2019 & 2032
- Table 13: Spain Flexible Pipe Industry Revenue (Million) Forecast, by Application 2019 & 2032
- Table 14: Italy Flexible Pipe Industry Revenue (Million) Forecast, by Application 2019 & 2032
- Table 15: Spain Flexible Pipe Industry Revenue (Million) Forecast, by Application 2019 & 2032
- Table 16: Belgium Flexible Pipe Industry Revenue (Million) Forecast, by Application 2019 & 2032
- Table 17: Netherland Flexible Pipe Industry Revenue (Million) Forecast, by Application 2019 & 2032
- Table 18: Nordics Flexible Pipe Industry Revenue (Million) Forecast, by Application 2019 & 2032
- Table 19: Rest of Europe Flexible Pipe Industry Revenue (Million) Forecast, by Application 2019 & 2032
- Table 20: Global Flexible Pipe Industry Revenue Million Forecast, by Country 2019 & 2032
- Table 21: China Flexible Pipe Industry Revenue (Million) Forecast, by Application 2019 & 2032
- Table 22: Japan Flexible Pipe Industry Revenue (Million) Forecast, by Application 2019 & 2032
- Table 23: India Flexible Pipe Industry Revenue (Million) Forecast, by Application 2019 & 2032
- Table 24: South Korea Flexible Pipe Industry Revenue (Million) Forecast, by Application 2019 & 2032
- Table 25: Southeast Asia Flexible Pipe Industry Revenue (Million) Forecast, by Application 2019 & 2032
- Table 26: Australia Flexible Pipe Industry Revenue (Million) Forecast, by Application 2019 & 2032
- Table 27: Indonesia Flexible Pipe Industry Revenue (Million) Forecast, by Application 2019 & 2032
- Table 28: Phillipes Flexible Pipe Industry Revenue (Million) Forecast, by Application 2019 & 2032
- Table 29: Singapore Flexible Pipe Industry Revenue (Million) Forecast, by Application 2019 & 2032
- Table 30: Thailandc Flexible Pipe Industry Revenue (Million) Forecast, by Application 2019 & 2032
- Table 31: Rest of Asia Pacific Flexible Pipe Industry Revenue (Million) Forecast, by Application 2019 & 2032
- Table 32: Global Flexible Pipe Industry Revenue Million Forecast, by Country 2019 & 2032
- Table 33: Brazil Flexible Pipe Industry Revenue (Million) Forecast, by Application 2019 & 2032
- Table 34: Argentina Flexible Pipe Industry Revenue (Million) Forecast, by Application 2019 & 2032
- Table 35: Peru Flexible Pipe Industry Revenue (Million) Forecast, by Application 2019 & 2032
- Table 36: Chile Flexible Pipe Industry Revenue (Million) Forecast, by Application 2019 & 2032
- Table 37: Colombia Flexible Pipe Industry Revenue (Million) Forecast, by Application 2019 & 2032
- Table 38: Ecuador Flexible Pipe Industry Revenue (Million) Forecast, by Application 2019 & 2032
- Table 39: Venezuela Flexible Pipe Industry Revenue (Million) Forecast, by Application 2019 & 2032
- Table 40: Rest of South America Flexible Pipe Industry Revenue (Million) Forecast, by Application 2019 & 2032
- Table 41: Global Flexible Pipe Industry Revenue Million Forecast, by Country 2019 & 2032
- Table 42: United States Flexible Pipe Industry Revenue (Million) Forecast, by Application 2019 & 2032
- Table 43: Canada Flexible Pipe Industry Revenue (Million) Forecast, by Application 2019 & 2032
- Table 44: Mexico Flexible Pipe Industry Revenue (Million) Forecast, by Application 2019 & 2032
- Table 45: Global Flexible Pipe Industry Revenue Million Forecast, by Country 2019 & 2032
- Table 46: United Arab Emirates Flexible Pipe Industry Revenue (Million) Forecast, by Application 2019 & 2032
- Table 47: Saudi Arabia Flexible Pipe Industry Revenue (Million) Forecast, by Application 2019 & 2032
- Table 48: South Africa Flexible Pipe Industry Revenue (Million) Forecast, by Application 2019 & 2032
- Table 49: Rest of Middle East and Africa Flexible Pipe Industry Revenue (Million) Forecast, by Application 2019 & 2032
- Table 50: Global Flexible Pipe Industry Revenue Million Forecast, by Raw Material 2019 & 2032
- Table 51: Global Flexible Pipe Industry Revenue Million Forecast, by Application 2019 & 2032
- Table 52: Global Flexible Pipe Industry Revenue Million Forecast, by Country 2019 & 2032
- Table 53: United States Flexible Pipe Industry Revenue (Million) Forecast, by Application 2019 & 2032
- Table 54: Canada Flexible Pipe Industry Revenue (Million) Forecast, by Application 2019 & 2032
- Table 55: Global Flexible Pipe Industry Revenue Million Forecast, by Raw Material 2019 & 2032
- Table 56: Global Flexible Pipe Industry Revenue Million Forecast, by Application 2019 & 2032
- Table 57: Global Flexible Pipe Industry Revenue Million Forecast, by Country 2019 & 2032
- Table 58: United Kingdom Flexible Pipe Industry Revenue (Million) Forecast, by Application 2019 & 2032
- Table 59: Russia Flexible Pipe Industry Revenue (Million) Forecast, by Application 2019 & 2032
- Table 60: Norway Flexible Pipe Industry Revenue (Million) Forecast, by Application 2019 & 2032
- Table 61: Italy Flexible Pipe Industry Revenue (Million) Forecast, by Application 2019 & 2032
- Table 62: Rest of Europe Flexible Pipe Industry Revenue (Million) Forecast, by Application 2019 & 2032
- Table 63: Global Flexible Pipe Industry Revenue Million Forecast, by Raw Material 2019 & 2032
- Table 64: Global Flexible Pipe Industry Revenue Million Forecast, by Application 2019 & 2032
- Table 65: Global Flexible Pipe Industry Revenue Million Forecast, by Country 2019 & 2032
- Table 66: China Flexible Pipe Industry Revenue (Million) Forecast, by Application 2019 & 2032
- Table 67: India Flexible Pipe Industry Revenue (Million) Forecast, by Application 2019 & 2032
- Table 68: Malaysia Flexible Pipe Industry Revenue (Million) Forecast, by Application 2019 & 2032
- Table 69: Rest of Asia Pacific Flexible Pipe Industry Revenue (Million) Forecast, by Application 2019 & 2032
- Table 70: Global Flexible Pipe Industry Revenue Million Forecast, by Raw Material 2019 & 2032
- Table 71: Global Flexible Pipe Industry Revenue Million Forecast, by Application 2019 & 2032
- Table 72: Global Flexible Pipe Industry Revenue Million Forecast, by Country 2019 & 2032
- Table 73: Brazil Flexible Pipe Industry Revenue (Million) Forecast, by Application 2019 & 2032
- Table 74: Argentina Flexible Pipe Industry Revenue (Million) Forecast, by Application 2019 & 2032
- Table 75: Rest of Latin America Flexible Pipe Industry Revenue (Million) Forecast, by Application 2019 & 2032
- Table 76: Global Flexible Pipe Industry Revenue Million Forecast, by Raw Material 2019 & 2032
- Table 77: Global Flexible Pipe Industry Revenue Million Forecast, by Application 2019 & 2032
- Table 78: Global Flexible Pipe Industry Revenue Million Forecast, by Country 2019 & 2032
- Table 79: Global Flexible Pipe Industry Revenue Million Forecast, by Raw Material 2019 & 2032
- Table 80: Global Flexible Pipe Industry Revenue Million Forecast, by Application 2019 & 2032
- Table 81: Global Flexible Pipe Industry Revenue Million Forecast, by Country 2019 & 2032
- Table 82: United Arab Emirates Flexible Pipe Industry Revenue (Million) Forecast, by Application 2019 & 2032
- Table 83: Rest of Middle East Flexible Pipe Industry Revenue (Million) Forecast, by Application 2019 & 2032
Frequently Asked Questions
1. What is the projected Compound Annual Growth Rate (CAGR) of the Flexible Pipe Industry?
The projected CAGR is approximately 4.40%.
2. Which companies are prominent players in the Flexible Pipe Industry?
Key companies in the market include Flexsteel Pipeline Technologies Inc *List Not Exhaustive, National Oilwell Varco (NOV), Magma Global Ltd, Chevron Phillips Chemical Company LLC, SoulForce (Pipelife Nederland B V ), The Prysmian Group, GE Oil & Gas Corporation, Shawcor Ltd, ContiTech AG, TechnipFMC PLC, Airborne Oil & Gas BV.
3. What are the main segments of the Flexible Pipe Industry?
The market segments include Raw Material, Application.
4. Can you provide details about the market size?
The market size is estimated to be USD XX Million as of 2022.
5. What are some drivers contributing to market growth?
; Increasing Demand for Non-corrosive Pipes in Oil and Gas Industry; Technological Advances in Drilling Process.
6. What are the notable trends driving market growth?
Oil and Gas Industry to Drive the Market.
7. Are there any restraints impacting market growth?
; Fluctuating Oil Prices.
8. Can you provide examples of recent developments in the market?
N/A
9. What pricing options are available for accessing the report?
Pricing options include single-user, multi-user, and enterprise licenses priced at USD 4750, USD 5250, and USD 8750 respectively.
10. Is the market size provided in terms of value or volume?
The market size is provided in terms of value, measured in Million.
11. Are there any specific market keywords associated with the report?
Yes, the market keyword associated with the report is "Flexible Pipe Industry," which aids in identifying and referencing the specific market segment covered.
12. How do I determine which pricing option suits my needs best?
The pricing options vary based on user requirements and access needs. Individual users may opt for single-user licenses, while businesses requiring broader access may choose multi-user or enterprise licenses for cost-effective access to the report.
13. Are there any additional resources or data provided in the Flexible Pipe Industry report?
While the report offers comprehensive insights, it's advisable to review the specific contents or supplementary materials provided to ascertain if additional resources or data are available.
14. How can I stay updated on further developments or reports in the Flexible Pipe Industry?
To stay informed about further developments, trends, and reports in the Flexible Pipe Industry, consider subscribing to industry newsletters, following relevant companies and organizations, or regularly checking reputable industry news sources and publications.
Methodology
Step 1 - Identification of Relevant Samples Size from Population Database


Step 2 - Approaches for Defining Global Market Size (Value, Volume* & Price*)

Note*: In applicable scenarios
Step 3 - Data Sources
Primary Research
- Web Analytics
- Survey Reports
- Research Institute
- Latest Research Reports
- Opinion Leaders
Secondary Research
- Annual Reports
- White Paper
- Latest Press Release
- Industry Association
- Paid Database
- Investor Presentations

Step 4 - Data Triangulation
Involves using different sources of information in order to increase the validity of a study
These sources are likely to be stakeholders in a program - participants, other researchers, program staff, other community members, and so on.
Then we put all data in single framework & apply various statistical tools to find out the dynamic on the market.
During the analysis stage, feedback from the stakeholder groups would be compared to determine areas of agreement as well as areas of divergence


