

Key Insights
The global float glass market, valued at $42.7 billion in 2025, is projected to achieve a compound annual growth rate (CAGR) of 4.53% from 2025 to 2033. Key growth drivers include the expanding construction industry in Asia-Pacific and the Middle East & Africa, increasing adoption of advanced glazing in the automotive sector, and the vital role of float glass in solar energy applications. While raw material price volatility and environmental considerations present challenges, technological advancements and a focus on sustainability are mitigating these factors. The building and construction segment dominates market share, followed by automotive and solar applications. Clear float glass leads the type segment, with tinted and patterned glass experiencing rapid growth due to rising aesthetic and functional demands. Leading companies like Nippon Sheet Glass, Guardian Glass, Şişecam, and Saint-Gobain are strategically expanding capacity and investing in innovation to capture market opportunities.
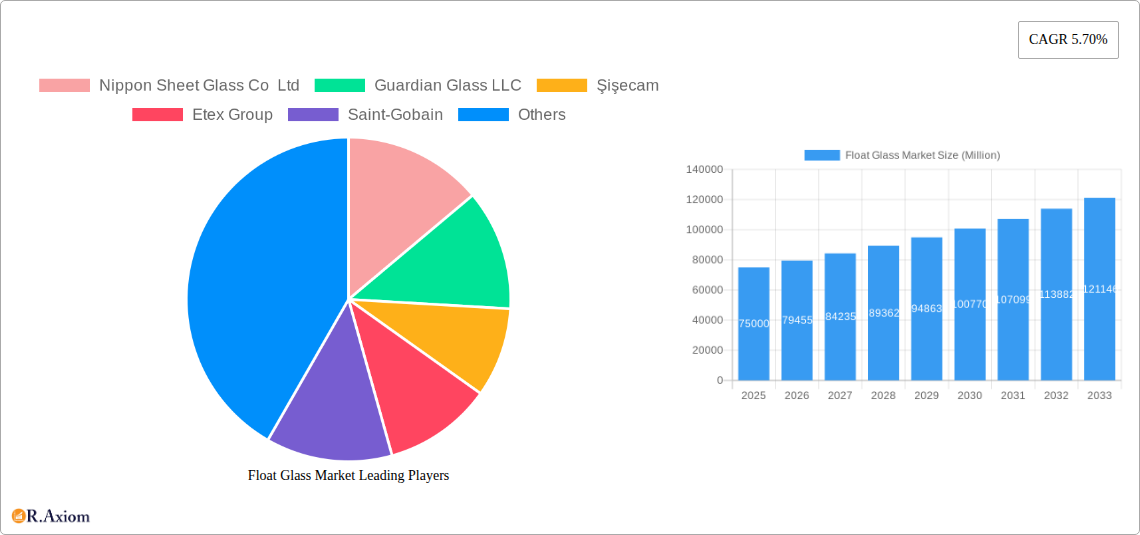
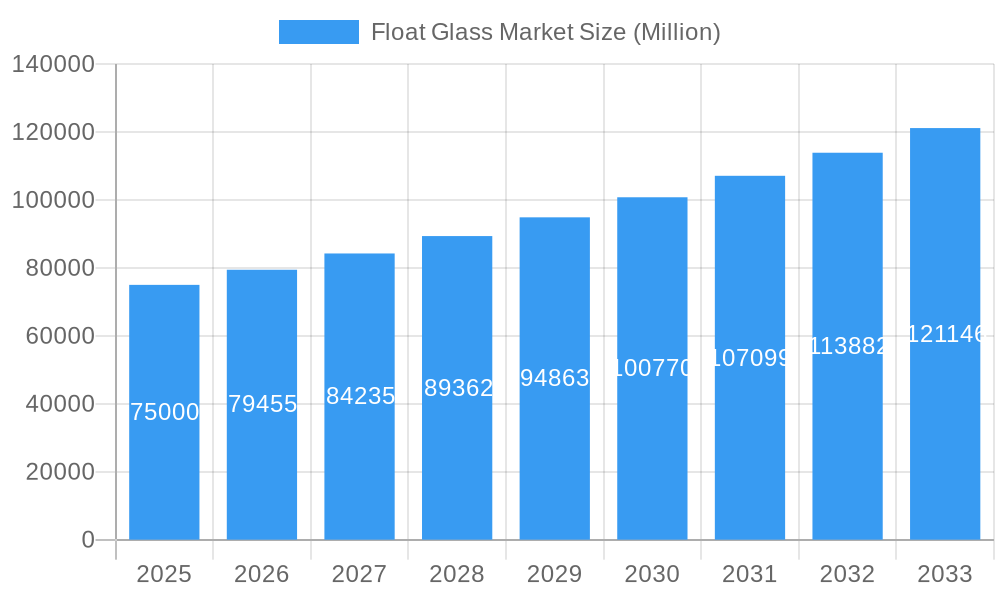
Float Glass Market Market Size (In Billion)
The Asia-Pacific region, particularly China and India, currently leads the market share driven by infrastructure development and increasing disposable incomes. North America and Europe remain significant markets due to robust construction and technological advancements in automotive and solar industries, though their growth is expected to be more moderate than emerging markets. The forecast period (2025-2033) anticipates significant market shifts driven by new technologies, sustainable solutions, energy efficiency improvements, and advanced glass compositions.
Float Glass Market Company Market Share
This report offers a comprehensive analysis of the global float glass market, covering historical data (2019-2024), the base year (2025), and a forecast through 2033. It meticulously examines market dynamics, segmentation, key players, and future growth prospects, providing essential insights for industry stakeholders, investors, and researchers.
Float Glass Market Concentration & Innovation
The float glass market exhibits a moderately concentrated landscape, with a few major players holding significant market share. The top ten companies—Nippon Sheet Glass Co Ltd, Guardian Glass LLC, Şişecam, Etex Group, Saint-Gobain, Cardinal Glass Industries Inc, Xinyi Glass Holdings Limited, PT Mulia Industrindo Tbk, China Luoyang Float Glass Group Co Ltd, and Kibing Group—account for approximately xx% of the global market in 2025. However, the presence of several regional and smaller players introduces a level of competition.
Innovation in the float glass market is driven by several factors:
- Technological advancements: Improving energy efficiency in manufacturing processes, developing new glass compositions (e.g., self-cleaning, energy-efficient), and exploring sustainable raw materials are key areas of innovation.
- Regulatory pressures: Stringent environmental regulations and building codes are pushing manufacturers towards more sustainable and energy-efficient production methods and glass types.
- Product diversification: The market sees continuous development of specialized glass types catering to niche applications in automotive, solar energy, and architectural sectors.
- Mergers and Acquisitions (M&A): Significant M&A activity has reshaped the market landscape. For example, China Glass Holdings Limited's acquisition of the Orda float glass facility reflects a strategic move to expand market presence and capacity. The total value of M&A deals in the float glass industry from 2019 to 2024 was approximately xx Million. While specific deal values are often confidential, the trend indicates a consolidation process within the industry.
The market witnesses increasing focus on sustainability and energy efficiency, reflected in partnerships like AGC Glass Europe's collaboration with E.ON for waste heat recovery (April 2022). Such initiatives influence market competition and drive adoption of environmentally responsible practices.
Float Glass Market Industry Trends & Insights
The global float glass market is experiencing robust growth, driven by several factors. The construction industry's expansion, particularly in developing economies, is a significant contributor. Rising urbanization and infrastructure development projects fuel demand for architectural glass. The automotive sector's continuous innovation and shift towards lightweight vehicles also boost demand for specialized float glass.
The CAGR for the global float glass market during the forecast period (2025-2033) is estimated at xx%. Market penetration for various glass types varies considerably. Clear glass maintains the largest market share, while tinted, patterned, and extra-clear glasses are witnessing increasing demand driven by aesthetic and functional preferences. Technological advancements, such as the development of self-cleaning and energy-efficient glasses, are reshaping consumer preferences and driving market segmentation.
Competitive dynamics are intense, with major players focusing on expanding production capacity, investing in R&D, and pursuing strategic partnerships to maintain market leadership. Price competition, especially in commodity-grade glass, is a significant factor influencing market dynamics.
Dominant Markets & Segments in Float Glass Market
The Asia-Pacific region holds the largest market share in the global float glass market, driven by strong economic growth, rapid urbanization, and extensive infrastructure development in countries like China and India. Within the segment analysis:
- Raw Materials: Sand remains the dominant raw material, owing to its abundance and relatively low cost. However, the industry is exploring alternative raw materials to reduce environmental impact and enhance sustainability.
- Type: Clear float glass dominates the market due to its versatility and cost-effectiveness. However, the demand for tinted, patterned, and extra-clear glass is increasing.
- Application: The building and construction sector represents the largest application segment, followed by the automotive industry. The solar energy sector is experiencing rapid growth and presents significant future opportunities for specialized solar float glass.
Key Drivers for Dominant Regions:
- Asia-Pacific: Rapid urbanization, infrastructure development, and strong economic growth.
- North America: Significant construction activity and growth in the automotive industry.
- Europe: Focus on energy efficiency and sustainable building practices.
Float Glass Market Product Developments
Recent product developments focus on enhanced functionality, energy efficiency, and sustainability. Innovations include self-cleaning glass, energy-efficient glass coatings, and glass with improved acoustic insulation properties. These advancements cater to specific market needs, offering competitive advantages in terms of performance, durability, and environmental impact. The market is witnessing a shift towards customized glass solutions tailored to specific architectural and automotive applications.
Report Scope & Segmentation Analysis
This report segments the float glass market based on raw materials (Sand, Limestone, Soda Ash, Dolomite, Other Raw Materials), type (Clear, Tinted, Patterned, Wired, Extra Clear/Low Ferrous Floated Glass), and application (Building and Construction, Automotive, Solar Glass, Other Applications). Each segment's growth projection, market size, and competitive dynamics are analyzed in detail.
Key Drivers of Float Glass Market Growth
Several factors drive the float glass market's growth:
- Construction boom: Global infrastructure development and construction projects contribute significantly to the demand.
- Automotive advancements: Lightweight vehicles and enhanced safety features rely on specialized float glass.
- Renewable energy: Solar energy expansion fuels the demand for solar float glass.
- Technological innovations: Developments in glass compositions and manufacturing processes enhance product quality and efficiency.
Challenges in the Float Glass Market Sector
The float glass market faces several challenges:
- Fluctuating raw material prices: The cost of raw materials, particularly energy, significantly impacts production costs and profitability.
- Stringent environmental regulations: Compliance with increasingly stringent regulations adds to operational costs.
- Intense competition: The market is characterized by intense competition among established players and new entrants.
Emerging Opportunities in Float Glass Market
Emerging opportunities include:
- Smart glass technology: Integration of smart features enhances functionality and creates new applications.
- Sustainable glass solutions: Demand for eco-friendly glass manufacturing processes and products is increasing.
- Growing solar energy market: The expansion of solar energy presents significant opportunities for specialized solar float glass.
Leading Players in the Float Glass Market Market
- Nippon Sheet Glass Co Ltd
- Guardian Glass LLC
- Şişecam
- Etex Group
- Saint-Gobain
- Cardinal Glass Industries Inc
- Xinyi Glass Holdings Limited
- PT Mulia Industrindo Tbk
- China Luoyang Float Glass Group Co Ltd
- Kibing Group
- China Glass Holdings Limited
- Taiwan Glass Ind Corp
- AGC Inc
- BG
- Press Glass Holding SA
- SCHOTT AG
Key Developments in Float Glass Market Industry
- January 2022: China Glass Holdings Limited (CNG) acquired the Orda float glass manufacturing facility in Kazakhstan, aiming to create a state-of-the-art facility using Stewart technology. This significantly expands CNG's production capacity and market reach.
- April 2022: AGC Glass Europe partnered with E.ON for waste heat recovery and green power production at its Seingbouse plant. This initiative promotes sustainability and reduces the environmental impact of glass production.
- September 2022: SCHOTT partnered with Emirates Glass LLC to enhance architectural glass solutions in the Middle East. This collaboration expands SCHOTT's market presence and access to a key regional player.
Strategic Outlook for Float Glass Market Market
The float glass market is poised for sustained growth, fueled by ongoing construction activities, the expansion of the renewable energy sector, and technological advancements. The focus on sustainability and energy efficiency will continue to shape product development and market competition. New applications of float glass, particularly in smart buildings and advanced automotive technologies, will present exciting opportunities for growth and innovation in the years to come.
Float Glass Market Segmentation
-
1. Type
- 1.1. Clear
- 1.2. Tinted
- 1.3. Patterned
- 1.4. Wired
- 1.5. Extra Clear/Low Ferrous Floated Glass
-
2. Application
- 2.1. Building and Construction
- 2.2. Automotive
- 2.3. Solar Glass
- 2.4. Other Applications
Float Glass Market Segmentation By Geography
-
1. Asia Pacific
- 1.1. China
- 1.2. India
- 1.3. Japan
- 1.4. South Korea
- 1.5. Vietnam
- 1.6. Thailand
- 1.7. Indonesia
- 1.8. Malaysia
- 1.9. Rest of Asia Pacific
-
2. North America
- 2.1. United States
- 2.2. Canada
- 2.3. Mexico
-
3. Europe
- 3.1. Germany
- 3.2. United Kingdom
- 3.3. France
- 3.4. Italy
- 3.5. Russia
- 3.6. NORDIC
- 3.7. Turkey
- 3.8. Spain
- 3.9. Rest of Europe
-
4. South America
- 4.1. Brazil
- 4.2. Colombia
- 4.3. Argentina
- 4.4. Rest of South America
-
5. Middle East and Africa
- 5.1. Saudi Arabia
- 5.2. Nigeria
- 5.3. Qatar
- 5.4. United Arab Emirates
- 5.5. Egypt
- 5.6. South Africa
- 5.7. Rest of Middle East and Africa
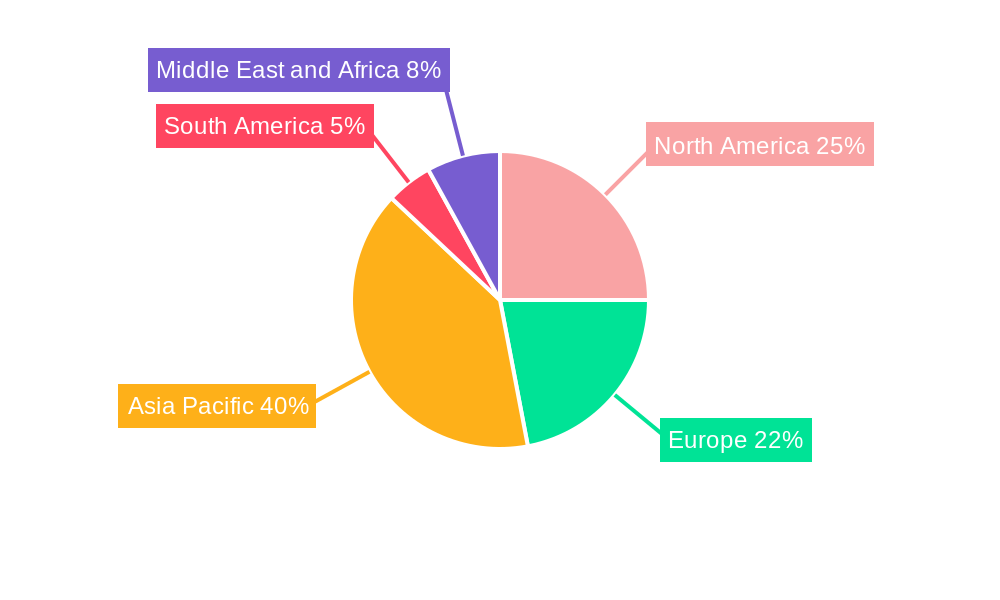
Float Glass Market Regional Market Share
Geographic Coverage of Float Glass Market
Float Glass Market REPORT HIGHLIGHTS
| Aspects | Details |
|---|---|
| Study Period | 2020-2034 |
| Base Year | 2025 |
| Estimated Year | 2026 |
| Forecast Period | 2026-2034 |
| Historical Period | 2020-2025 |
| Growth Rate | CAGR of 4.53% from 2020-2034 |
| Segmentation |
|
Table of Contents
- 1. Introduction
- 1.1. Research Scope
- 1.2. Market Segmentation
- 1.3. Research Objective
- 1.4. Definitions and Assumptions
- 2. Executive Summary
- 2.1. Market Snapshot
- 3. Market Dynamics
- 3.1. Market Drivers
- 3.2. Market Restrains
- 3.3. Market Trends
- 3.4. Market Opportunities
- 4. Market Factor Analysis
- 4.1. Porters Five Forces
- 4.1.1. Bargaining Power of Suppliers
- 4.1.2. Bargaining Power of Buyers
- 4.1.3. Threat of New Entrants
- 4.1.4. Threat of Substitutes
- 4.1.5. Competitive Rivalry
- 4.2. PESTEL analysis
- 4.3. BCG Analysis
- 4.3.1. Stars (High Growth, High Market Share)
- 4.3.2. Cash Cows (Low Growth, High Market Share)
- 4.3.3. Question Mark (High Growth, Low Market Share)
- 4.3.4. Dogs (Low Growth, Low Market Share)
- 4.4. Ansoff Matrix Analysis
- 4.5. Supply Chain Analysis
- 4.6. Regulatory Landscape
- 4.7. Current Market Potential and Opportunity Assessment (TAM–SAM–SOM Framework)
- 4.8. RAX Analyst Note
- 4.1. Porters Five Forces
- 5. Market Analysis, Insights and Forecast 2021-2033
- 5.1. Market Analysis, Insights and Forecast - by Type
- 5.1.1. Clear
- 5.1.2. Tinted
- 5.1.3. Patterned
- 5.1.4. Wired
- 5.1.5. Extra Clear/Low Ferrous Floated Glass
- 5.2. Market Analysis, Insights and Forecast - by Application
- 5.2.1. Building and Construction
- 5.2.2. Automotive
- 5.2.3. Solar Glass
- 5.2.4. Other Applications
- 5.3. Market Analysis, Insights and Forecast - by Region
- 5.3.1. Asia Pacific
- 5.3.2. North America
- 5.3.3. Europe
- 5.3.4. South America
- 5.3.5. Middle East and Africa
- 5.1. Market Analysis, Insights and Forecast - by Type
- 6. Global Float Glass Market Analysis, Insights and Forecast, 2021-2033
- 6.1. Market Analysis, Insights and Forecast - by Type
- 6.1.1. Clear
- 6.1.2. Tinted
- 6.1.3. Patterned
- 6.1.4. Wired
- 6.1.5. Extra Clear/Low Ferrous Floated Glass
- 6.2. Market Analysis, Insights and Forecast - by Application
- 6.2.1. Building and Construction
- 6.2.2. Automotive
- 6.2.3. Solar Glass
- 6.2.4. Other Applications
- 6.1. Market Analysis, Insights and Forecast - by Type
- 7. Asia Pacific Float Glass Market Analysis, Insights and Forecast, 2020-2032
- 7.1. Market Analysis, Insights and Forecast - by Type
- 7.1.1. Clear
- 7.1.2. Tinted
- 7.1.3. Patterned
- 7.1.4. Wired
- 7.1.5. Extra Clear/Low Ferrous Floated Glass
- 7.2. Market Analysis, Insights and Forecast - by Application
- 7.2.1. Building and Construction
- 7.2.2. Automotive
- 7.2.3. Solar Glass
- 7.2.4. Other Applications
- 7.1. Market Analysis, Insights and Forecast - by Type
- 8. North America Float Glass Market Analysis, Insights and Forecast, 2020-2032
- 8.1. Market Analysis, Insights and Forecast - by Type
- 8.1.1. Clear
- 8.1.2. Tinted
- 8.1.3. Patterned
- 8.1.4. Wired
- 8.1.5. Extra Clear/Low Ferrous Floated Glass
- 8.2. Market Analysis, Insights and Forecast - by Application
- 8.2.1. Building and Construction
- 8.2.2. Automotive
- 8.2.3. Solar Glass
- 8.2.4. Other Applications
- 8.1. Market Analysis, Insights and Forecast - by Type
- 9. Europe Float Glass Market Analysis, Insights and Forecast, 2020-2032
- 9.1. Market Analysis, Insights and Forecast - by Type
- 9.1.1. Clear
- 9.1.2. Tinted
- 9.1.3. Patterned
- 9.1.4. Wired
- 9.1.5. Extra Clear/Low Ferrous Floated Glass
- 9.2. Market Analysis, Insights and Forecast - by Application
- 9.2.1. Building and Construction
- 9.2.2. Automotive
- 9.2.3. Solar Glass
- 9.2.4. Other Applications
- 9.1. Market Analysis, Insights and Forecast - by Type
- 10. South America Float Glass Market Analysis, Insights and Forecast, 2020-2032
- 10.1. Market Analysis, Insights and Forecast - by Type
- 10.1.1. Clear
- 10.1.2. Tinted
- 10.1.3. Patterned
- 10.1.4. Wired
- 10.1.5. Extra Clear/Low Ferrous Floated Glass
- 10.2. Market Analysis, Insights and Forecast - by Application
- 10.2.1. Building and Construction
- 10.2.2. Automotive
- 10.2.3. Solar Glass
- 10.2.4. Other Applications
- 10.1. Market Analysis, Insights and Forecast - by Type
- 11. Middle East and Africa Float Glass Market Analysis, Insights and Forecast, 2020-2032
- 11.1. Market Analysis, Insights and Forecast - by Type
- 11.1.1. Clear
- 11.1.2. Tinted
- 11.1.3. Patterned
- 11.1.4. Wired
- 11.1.5. Extra Clear/Low Ferrous Floated Glass
- 11.2. Market Analysis, Insights and Forecast - by Application
- 11.2.1. Building and Construction
- 11.2.2. Automotive
- 11.2.3. Solar Glass
- 11.2.4. Other Applications
- 11.1. Market Analysis, Insights and Forecast - by Type
- 12. Competitive Analysis
- 12.1. Company Profiles
- 12.1.1 Nippon Sheet Glass Co Ltd
- 12.1.1.1. Company Overview
- 12.1.1.2. Products
- 12.1.1.3. Company Financials
- 12.1.1.4. SWOT Analysis
- 12.1.2 Guardian Glass LLC
- 12.1.2.1. Company Overview
- 12.1.2.2. Products
- 12.1.2.3. Company Financials
- 12.1.2.4. SWOT Analysis
- 12.1.3 Şişecam
- 12.1.3.1. Company Overview
- 12.1.3.2. Products
- 12.1.3.3. Company Financials
- 12.1.3.4. SWOT Analysis
- 12.1.4 Etex Group
- 12.1.4.1. Company Overview
- 12.1.4.2. Products
- 12.1.4.3. Company Financials
- 12.1.4.4. SWOT Analysis
- 12.1.5 Saint-Gobain
- 12.1.5.1. Company Overview
- 12.1.5.2. Products
- 12.1.5.3. Company Financials
- 12.1.5.4. SWOT Analysis
- 12.1.6 Cardinal Glass Industries Inc
- 12.1.6.1. Company Overview
- 12.1.6.2. Products
- 12.1.6.3. Company Financials
- 12.1.6.4. SWOT Analysis
- 12.1.7 Xinyi Glass Holdings Limited*List Not Exhaustive
- 12.1.7.1. Company Overview
- 12.1.7.2. Products
- 12.1.7.3. Company Financials
- 12.1.7.4. SWOT Analysis
- 12.1.8 PT Mulia Industrindo Tbk
- 12.1.8.1. Company Overview
- 12.1.8.2. Products
- 12.1.8.3. Company Financials
- 12.1.8.4. SWOT Analysis
- 12.1.9 China Luoyang Float Glass Group Co Ltd
- 12.1.9.1. Company Overview
- 12.1.9.2. Products
- 12.1.9.3. Company Financials
- 12.1.9.4. SWOT Analysis
- 12.1.10 Kibing Group
- 12.1.10.1. Company Overview
- 12.1.10.2. Products
- 12.1.10.3. Company Financials
- 12.1.10.4. SWOT Analysis
- 12.1.11 China Glass Holdings Limited
- 12.1.11.1. Company Overview
- 12.1.11.2. Products
- 12.1.11.3. Company Financials
- 12.1.11.4. SWOT Analysis
- 12.1.12 Taiwan Glass Ind Corp
- 12.1.12.1. Company Overview
- 12.1.12.2. Products
- 12.1.12.3. Company Financials
- 12.1.12.4. SWOT Analysis
- 12.1.13 AGC Inc
- 12.1.13.1. Company Overview
- 12.1.13.2. Products
- 12.1.13.3. Company Financials
- 12.1.13.4. SWOT Analysis
- 12.1.14 BG
- 12.1.14.1. Company Overview
- 12.1.14.2. Products
- 12.1.14.3. Company Financials
- 12.1.14.4. SWOT Analysis
- 12.1.15 Press Glass Holding SA
- 12.1.15.1. Company Overview
- 12.1.15.2. Products
- 12.1.15.3. Company Financials
- 12.1.15.4. SWOT Analysis
- 12.1.16 SCHOTT AG
- 12.1.16.1. Company Overview
- 12.1.16.2. Products
- 12.1.16.3. Company Financials
- 12.1.16.4. SWOT Analysis
- 12.1.1 Nippon Sheet Glass Co Ltd
- 12.2. Market Entropy
- 12.2.1 Company's Key Areas Served
- 12.2.2 Recent Developments
- 12.3. Company Market Share Analysis 2025
- 12.3.1 Top 5 Companies Market Share Analysis
- 12.3.2 Top 3 Companies Market Share Analysis
- 12.4. List of Potential Customers
- 13. Research Methodology
List of Figures
- Figure 1: Global Float Glass Market Revenue Breakdown (billion, %) by Region 2025 & 2033
- Figure 2: Global Float Glass Market Volume Breakdown (Million, %) by Region 2025 & 2033
- Figure 3: Asia Pacific Float Glass Market Revenue (billion), by Type 2025 & 2033
- Figure 4: Asia Pacific Float Glass Market Volume (Million), by Type 2025 & 2033
- Figure 5: Asia Pacific Float Glass Market Revenue Share (%), by Type 2025 & 2033
- Figure 6: Asia Pacific Float Glass Market Volume Share (%), by Type 2025 & 2033
- Figure 7: Asia Pacific Float Glass Market Revenue (billion), by Application 2025 & 2033
- Figure 8: Asia Pacific Float Glass Market Volume (Million), by Application 2025 & 2033
- Figure 9: Asia Pacific Float Glass Market Revenue Share (%), by Application 2025 & 2033
- Figure 10: Asia Pacific Float Glass Market Volume Share (%), by Application 2025 & 2033
- Figure 11: Asia Pacific Float Glass Market Revenue (billion), by Country 2025 & 2033
- Figure 12: Asia Pacific Float Glass Market Volume (Million), by Country 2025 & 2033
- Figure 13: Asia Pacific Float Glass Market Revenue Share (%), by Country 2025 & 2033
- Figure 14: Asia Pacific Float Glass Market Volume Share (%), by Country 2025 & 2033
- Figure 15: North America Float Glass Market Revenue (billion), by Type 2025 & 2033
- Figure 16: North America Float Glass Market Volume (Million), by Type 2025 & 2033
- Figure 17: North America Float Glass Market Revenue Share (%), by Type 2025 & 2033
- Figure 18: North America Float Glass Market Volume Share (%), by Type 2025 & 2033
- Figure 19: North America Float Glass Market Revenue (billion), by Application 2025 & 2033
- Figure 20: North America Float Glass Market Volume (Million), by Application 2025 & 2033
- Figure 21: North America Float Glass Market Revenue Share (%), by Application 2025 & 2033
- Figure 22: North America Float Glass Market Volume Share (%), by Application 2025 & 2033
- Figure 23: North America Float Glass Market Revenue (billion), by Country 2025 & 2033
- Figure 24: North America Float Glass Market Volume (Million), by Country 2025 & 2033
- Figure 25: North America Float Glass Market Revenue Share (%), by Country 2025 & 2033
- Figure 26: North America Float Glass Market Volume Share (%), by Country 2025 & 2033
- Figure 27: Europe Float Glass Market Revenue (billion), by Type 2025 & 2033
- Figure 28: Europe Float Glass Market Volume (Million), by Type 2025 & 2033
- Figure 29: Europe Float Glass Market Revenue Share (%), by Type 2025 & 2033
- Figure 30: Europe Float Glass Market Volume Share (%), by Type 2025 & 2033
- Figure 31: Europe Float Glass Market Revenue (billion), by Application 2025 & 2033
- Figure 32: Europe Float Glass Market Volume (Million), by Application 2025 & 2033
- Figure 33: Europe Float Glass Market Revenue Share (%), by Application 2025 & 2033
- Figure 34: Europe Float Glass Market Volume Share (%), by Application 2025 & 2033
- Figure 35: Europe Float Glass Market Revenue (billion), by Country 2025 & 2033
- Figure 36: Europe Float Glass Market Volume (Million), by Country 2025 & 2033
- Figure 37: Europe Float Glass Market Revenue Share (%), by Country 2025 & 2033
- Figure 38: Europe Float Glass Market Volume Share (%), by Country 2025 & 2033
- Figure 39: South America Float Glass Market Revenue (billion), by Type 2025 & 2033
- Figure 40: South America Float Glass Market Volume (Million), by Type 2025 & 2033
- Figure 41: South America Float Glass Market Revenue Share (%), by Type 2025 & 2033
- Figure 42: South America Float Glass Market Volume Share (%), by Type 2025 & 2033
- Figure 43: South America Float Glass Market Revenue (billion), by Application 2025 & 2033
- Figure 44: South America Float Glass Market Volume (Million), by Application 2025 & 2033
- Figure 45: South America Float Glass Market Revenue Share (%), by Application 2025 & 2033
- Figure 46: South America Float Glass Market Volume Share (%), by Application 2025 & 2033
- Figure 47: South America Float Glass Market Revenue (billion), by Country 2025 & 2033
- Figure 48: South America Float Glass Market Volume (Million), by Country 2025 & 2033
- Figure 49: South America Float Glass Market Revenue Share (%), by Country 2025 & 2033
- Figure 50: South America Float Glass Market Volume Share (%), by Country 2025 & 2033
- Figure 51: Middle East and Africa Float Glass Market Revenue (billion), by Type 2025 & 2033
- Figure 52: Middle East and Africa Float Glass Market Volume (Million), by Type 2025 & 2033
- Figure 53: Middle East and Africa Float Glass Market Revenue Share (%), by Type 2025 & 2033
- Figure 54: Middle East and Africa Float Glass Market Volume Share (%), by Type 2025 & 2033
- Figure 55: Middle East and Africa Float Glass Market Revenue (billion), by Application 2025 & 2033
- Figure 56: Middle East and Africa Float Glass Market Volume (Million), by Application 2025 & 2033
- Figure 57: Middle East and Africa Float Glass Market Revenue Share (%), by Application 2025 & 2033
- Figure 58: Middle East and Africa Float Glass Market Volume Share (%), by Application 2025 & 2033
- Figure 59: Middle East and Africa Float Glass Market Revenue (billion), by Country 2025 & 2033
- Figure 60: Middle East and Africa Float Glass Market Volume (Million), by Country 2025 & 2033
- Figure 61: Middle East and Africa Float Glass Market Revenue Share (%), by Country 2025 & 2033
- Figure 62: Middle East and Africa Float Glass Market Volume Share (%), by Country 2025 & 2033
List of Tables
- Table 1: Global Float Glass Market Revenue billion Forecast, by Type 2020 & 2033
- Table 2: Global Float Glass Market Volume Million Forecast, by Type 2020 & 2033
- Table 3: Global Float Glass Market Revenue billion Forecast, by Application 2020 & 2033
- Table 4: Global Float Glass Market Volume Million Forecast, by Application 2020 & 2033
- Table 5: Global Float Glass Market Revenue billion Forecast, by Region 2020 & 2033
- Table 6: Global Float Glass Market Volume Million Forecast, by Region 2020 & 2033
- Table 7: Global Float Glass Market Revenue billion Forecast, by Type 2020 & 2033
- Table 8: Global Float Glass Market Volume Million Forecast, by Type 2020 & 2033
- Table 9: Global Float Glass Market Revenue billion Forecast, by Application 2020 & 2033
- Table 10: Global Float Glass Market Volume Million Forecast, by Application 2020 & 2033
- Table 11: Global Float Glass Market Revenue billion Forecast, by Country 2020 & 2033
- Table 12: Global Float Glass Market Volume Million Forecast, by Country 2020 & 2033
- Table 13: China Float Glass Market Revenue (billion) Forecast, by Application 2020 & 2033
- Table 14: China Float Glass Market Volume (Million) Forecast, by Application 2020 & 2033
- Table 15: India Float Glass Market Revenue (billion) Forecast, by Application 2020 & 2033
- Table 16: India Float Glass Market Volume (Million) Forecast, by Application 2020 & 2033
- Table 17: Japan Float Glass Market Revenue (billion) Forecast, by Application 2020 & 2033
- Table 18: Japan Float Glass Market Volume (Million) Forecast, by Application 2020 & 2033
- Table 19: South Korea Float Glass Market Revenue (billion) Forecast, by Application 2020 & 2033
- Table 20: South Korea Float Glass Market Volume (Million) Forecast, by Application 2020 & 2033
- Table 21: Vietnam Float Glass Market Revenue (billion) Forecast, by Application 2020 & 2033
- Table 22: Vietnam Float Glass Market Volume (Million) Forecast, by Application 2020 & 2033
- Table 23: Thailand Float Glass Market Revenue (billion) Forecast, by Application 2020 & 2033
- Table 24: Thailand Float Glass Market Volume (Million) Forecast, by Application 2020 & 2033
- Table 25: Indonesia Float Glass Market Revenue (billion) Forecast, by Application 2020 & 2033
- Table 26: Indonesia Float Glass Market Volume (Million) Forecast, by Application 2020 & 2033
- Table 27: Malaysia Float Glass Market Revenue (billion) Forecast, by Application 2020 & 2033
- Table 28: Malaysia Float Glass Market Volume (Million) Forecast, by Application 2020 & 2033
- Table 29: Rest of Asia Pacific Float Glass Market Revenue (billion) Forecast, by Application 2020 & 2033
- Table 30: Rest of Asia Pacific Float Glass Market Volume (Million) Forecast, by Application 2020 & 2033
- Table 31: Global Float Glass Market Revenue billion Forecast, by Type 2020 & 2033
- Table 32: Global Float Glass Market Volume Million Forecast, by Type 2020 & 2033
- Table 33: Global Float Glass Market Revenue billion Forecast, by Application 2020 & 2033
- Table 34: Global Float Glass Market Volume Million Forecast, by Application 2020 & 2033
- Table 35: Global Float Glass Market Revenue billion Forecast, by Country 2020 & 2033
- Table 36: Global Float Glass Market Volume Million Forecast, by Country 2020 & 2033
- Table 37: United States Float Glass Market Revenue (billion) Forecast, by Application 2020 & 2033
- Table 38: United States Float Glass Market Volume (Million) Forecast, by Application 2020 & 2033
- Table 39: Canada Float Glass Market Revenue (billion) Forecast, by Application 2020 & 2033
- Table 40: Canada Float Glass Market Volume (Million) Forecast, by Application 2020 & 2033
- Table 41: Mexico Float Glass Market Revenue (billion) Forecast, by Application 2020 & 2033
- Table 42: Mexico Float Glass Market Volume (Million) Forecast, by Application 2020 & 2033
- Table 43: Global Float Glass Market Revenue billion Forecast, by Type 2020 & 2033
- Table 44: Global Float Glass Market Volume Million Forecast, by Type 2020 & 2033
- Table 45: Global Float Glass Market Revenue billion Forecast, by Application 2020 & 2033
- Table 46: Global Float Glass Market Volume Million Forecast, by Application 2020 & 2033
- Table 47: Global Float Glass Market Revenue billion Forecast, by Country 2020 & 2033
- Table 48: Global Float Glass Market Volume Million Forecast, by Country 2020 & 2033
- Table 49: Germany Float Glass Market Revenue (billion) Forecast, by Application 2020 & 2033
- Table 50: Germany Float Glass Market Volume (Million) Forecast, by Application 2020 & 2033
- Table 51: United Kingdom Float Glass Market Revenue (billion) Forecast, by Application 2020 & 2033
- Table 52: United Kingdom Float Glass Market Volume (Million) Forecast, by Application 2020 & 2033
- Table 53: France Float Glass Market Revenue (billion) Forecast, by Application 2020 & 2033
- Table 54: France Float Glass Market Volume (Million) Forecast, by Application 2020 & 2033
- Table 55: Italy Float Glass Market Revenue (billion) Forecast, by Application 2020 & 2033
- Table 56: Italy Float Glass Market Volume (Million) Forecast, by Application 2020 & 2033
- Table 57: Russia Float Glass Market Revenue (billion) Forecast, by Application 2020 & 2033
- Table 58: Russia Float Glass Market Volume (Million) Forecast, by Application 2020 & 2033
- Table 59: NORDIC Float Glass Market Revenue (billion) Forecast, by Application 2020 & 2033
- Table 60: NORDIC Float Glass Market Volume (Million) Forecast, by Application 2020 & 2033
- Table 61: Turkey Float Glass Market Revenue (billion) Forecast, by Application 2020 & 2033
- Table 62: Turkey Float Glass Market Volume (Million) Forecast, by Application 2020 & 2033
- Table 63: Spain Float Glass Market Revenue (billion) Forecast, by Application 2020 & 2033
- Table 64: Spain Float Glass Market Volume (Million) Forecast, by Application 2020 & 2033
- Table 65: Rest of Europe Float Glass Market Revenue (billion) Forecast, by Application 2020 & 2033
- Table 66: Rest of Europe Float Glass Market Volume (Million) Forecast, by Application 2020 & 2033
- Table 67: Global Float Glass Market Revenue billion Forecast, by Type 2020 & 2033
- Table 68: Global Float Glass Market Volume Million Forecast, by Type 2020 & 2033
- Table 69: Global Float Glass Market Revenue billion Forecast, by Application 2020 & 2033
- Table 70: Global Float Glass Market Volume Million Forecast, by Application 2020 & 2033
- Table 71: Global Float Glass Market Revenue billion Forecast, by Country 2020 & 2033
- Table 72: Global Float Glass Market Volume Million Forecast, by Country 2020 & 2033
- Table 73: Brazil Float Glass Market Revenue (billion) Forecast, by Application 2020 & 2033
- Table 74: Brazil Float Glass Market Volume (Million) Forecast, by Application 2020 & 2033
- Table 75: Colombia Float Glass Market Revenue (billion) Forecast, by Application 2020 & 2033
- Table 76: Colombia Float Glass Market Volume (Million) Forecast, by Application 2020 & 2033
- Table 77: Argentina Float Glass Market Revenue (billion) Forecast, by Application 2020 & 2033
- Table 78: Argentina Float Glass Market Volume (Million) Forecast, by Application 2020 & 2033
- Table 79: Rest of South America Float Glass Market Revenue (billion) Forecast, by Application 2020 & 2033
- Table 80: Rest of South America Float Glass Market Volume (Million) Forecast, by Application 2020 & 2033
- Table 81: Global Float Glass Market Revenue billion Forecast, by Type 2020 & 2033
- Table 82: Global Float Glass Market Volume Million Forecast, by Type 2020 & 2033
- Table 83: Global Float Glass Market Revenue billion Forecast, by Application 2020 & 2033
- Table 84: Global Float Glass Market Volume Million Forecast, by Application 2020 & 2033
- Table 85: Global Float Glass Market Revenue billion Forecast, by Country 2020 & 2033
- Table 86: Global Float Glass Market Volume Million Forecast, by Country 2020 & 2033
- Table 87: Saudi Arabia Float Glass Market Revenue (billion) Forecast, by Application 2020 & 2033
- Table 88: Saudi Arabia Float Glass Market Volume (Million) Forecast, by Application 2020 & 2033
- Table 89: Nigeria Float Glass Market Revenue (billion) Forecast, by Application 2020 & 2033
- Table 90: Nigeria Float Glass Market Volume (Million) Forecast, by Application 2020 & 2033
- Table 91: Qatar Float Glass Market Revenue (billion) Forecast, by Application 2020 & 2033
- Table 92: Qatar Float Glass Market Volume (Million) Forecast, by Application 2020 & 2033
- Table 93: United Arab Emirates Float Glass Market Revenue (billion) Forecast, by Application 2020 & 2033
- Table 94: United Arab Emirates Float Glass Market Volume (Million) Forecast, by Application 2020 & 2033
- Table 95: Egypt Float Glass Market Revenue (billion) Forecast, by Application 2020 & 2033
- Table 96: Egypt Float Glass Market Volume (Million) Forecast, by Application 2020 & 2033
- Table 97: South Africa Float Glass Market Revenue (billion) Forecast, by Application 2020 & 2033
- Table 98: South Africa Float Glass Market Volume (Million) Forecast, by Application 2020 & 2033
- Table 99: Rest of Middle East and Africa Float Glass Market Revenue (billion) Forecast, by Application 2020 & 2033
- Table 100: Rest of Middle East and Africa Float Glass Market Volume (Million) Forecast, by Application 2020 & 2033
Frequently Asked Questions
1. What is the projected Compound Annual Growth Rate (CAGR) of the Float Glass Market?
The projected CAGR is approximately 4.53%.
2. Which companies are prominent players in the Float Glass Market?
Key companies in the market include Nippon Sheet Glass Co Ltd, Guardian Glass LLC, Şişecam, Etex Group, Saint-Gobain, Cardinal Glass Industries Inc, Xinyi Glass Holdings Limited*List Not Exhaustive, PT Mulia Industrindo Tbk, China Luoyang Float Glass Group Co Ltd, Kibing Group, China Glass Holdings Limited, Taiwan Glass Ind Corp, AGC Inc, BG, Press Glass Holding SA, SCHOTT AG.
3. What are the main segments of the Float Glass Market?
The market segments include Type, Application.
4. Can you provide details about the market size?
The market size is estimated to be USD 42.7 billion as of 2022.
5. What are some drivers contributing to market growth?
Increasing Demand from the Construction Industry; Recovering Automotive Industry.
6. What are the notable trends driving market growth?
Increasing Demand from Building and Construction Segments.
7. Are there any restraints impacting market growth?
; Unfavorable Conditions Arising Due to COVID-19 Outbreak; High Manufacturing Costs.
8. Can you provide examples of recent developments in the market?
September 2022: SCHOTT partnered with Emirates Glass LLC, one of the leading processors of architectural flat glass in the Middle East, to lift up Middle Eastern architecture.
9. What pricing options are available for accessing the report?
Pricing options include single-user, multi-user, and enterprise licenses priced at USD 4750, USD 5250, and USD 8750 respectively.
10. Is the market size provided in terms of value or volume?
The market size is provided in terms of value, measured in billion and volume, measured in Million.
11. Are there any specific market keywords associated with the report?
Yes, the market keyword associated with the report is "Float Glass Market," which aids in identifying and referencing the specific market segment covered.
12. How do I determine which pricing option suits my needs best?
The pricing options vary based on user requirements and access needs. Individual users may opt for single-user licenses, while businesses requiring broader access may choose multi-user or enterprise licenses for cost-effective access to the report.
13. Are there any additional resources or data provided in the Float Glass Market report?
While the report offers comprehensive insights, it's advisable to review the specific contents or supplementary materials provided to ascertain if additional resources or data are available.
14. How can I stay updated on further developments or reports in the Float Glass Market?
To stay informed about further developments, trends, and reports in the Float Glass Market, consider subscribing to industry newsletters, following relevant companies and organizations, or regularly checking reputable industry news sources and publications.
Methodology
Step 1 - Identification of Relevant Samples Size from Population Database


Step 2 - Approaches for Defining Global Market Size (Value, Volume* & Price*)

Note*: In applicable scenarios
Step 3 - Data Sources
Primary Research
- Web Analytics
- Survey Reports
- Research Institute
- Latest Research Reports
- Opinion Leaders
Secondary Research
- Annual Reports
- White Paper
- Latest Press Release
- Industry Association
- Paid Database
- Investor Presentations

Step 4 - Data Triangulation
Involves using different sources of information in order to increase the validity of a study
These sources are likely to be stakeholders in a program - participants, other researchers, program staff, other community members, and so on.
Then we put all data in single framework & apply various statistical tools to find out the dynamic on the market.
During the analysis stage, feedback from the stakeholder groups would be compared to determine areas of agreement as well as areas of divergence