

Key Insights
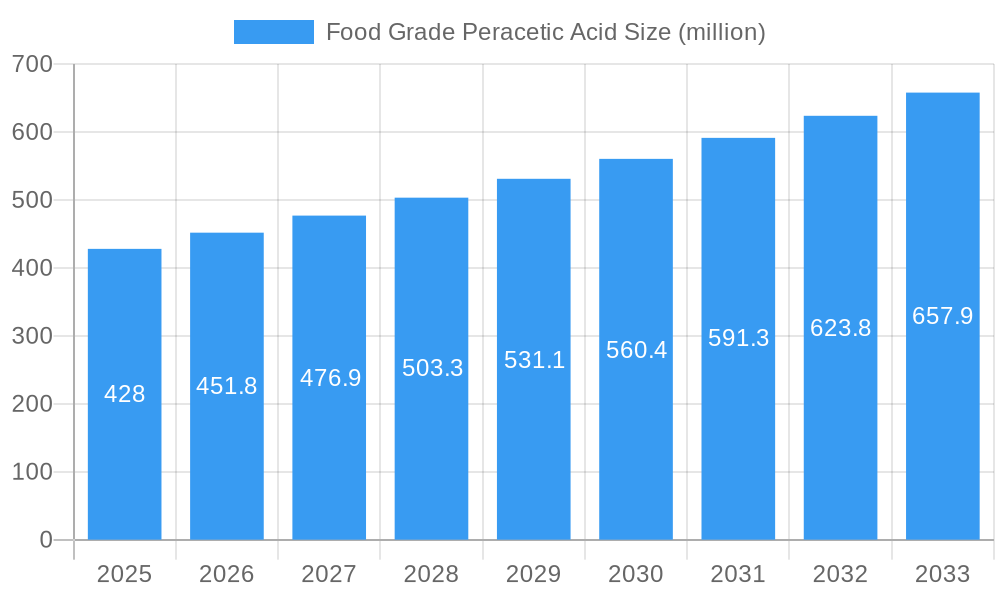
The global food-grade peracetic acid (PAA) market, valued at approximately $428 million in 2025, is projected to experience robust growth, driven by increasing demand for safe and effective food sanitizers within the food processing and packaging industries. The rising prevalence of foodborne illnesses globally is a key factor fueling the market's expansion, alongside stringent regulatory requirements concerning food safety and hygiene. Consumers are increasingly aware of food safety issues and demand products processed with hygienic methods, further bolstering the market. The market's growth is also influenced by the versatility of PAA, its broad-spectrum antimicrobial properties, and its environmentally friendly nature compared to traditional chemical sanitizers. Technological advancements in PAA production, enabling higher concentrations and improved efficacy, are further driving market expansion. Key players are focusing on R&D to improve the product's stability and performance, leading to innovative applications and formulations for various food segments.
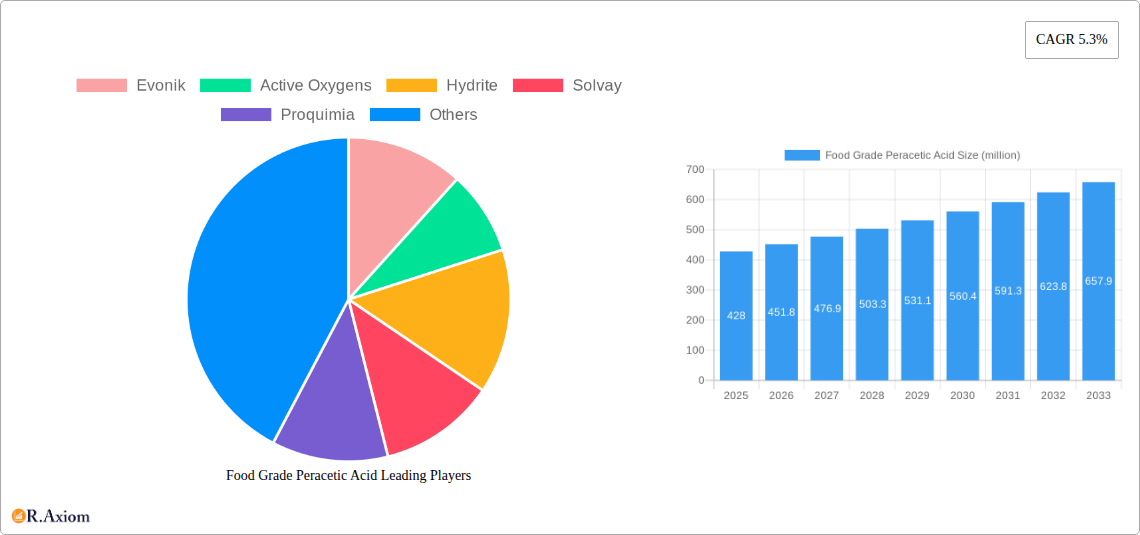
Food Grade Peracetic Acid Market Size (In Million)
Despite these positive drivers, the food-grade PAA market faces challenges including the relatively high cost of the product compared to some alternatives and potential safety concerns related to handling and storage. However, the benefits of enhanced food safety and the growing awareness of the product's advantages are expected to outweigh these restraints, leading to sustained market growth. Segmentation within the market is likely driven by application (e.g., surface sanitation, equipment sterilization, water treatment), concentration levels, and end-use industry (e.g., meat processing, dairy, fruits and vegetables). Regional growth will likely vary, influenced by factors such as food safety regulations, economic development, and consumer awareness in specific geographic areas. The forecast period of 2025-2033 suggests a continued upward trajectory, with a Compound Annual Growth Rate (CAGR) of 5.3%, indicating significant market potential.
Food Grade Peracetic Acid Company Market Share
Food Grade Peracetic Acid Market Report: A Comprehensive Analysis (2019-2033)
This comprehensive report provides a detailed analysis of the global food grade peracetic acid market, offering invaluable insights for industry stakeholders, investors, and market researchers. Covering the period from 2019 to 2033, with a base year of 2025 and a forecast period of 2025-2033, this report examines market dynamics, growth drivers, challenges, and emerging opportunities. The market is valued at $xx million in 2025 and is projected to reach $xx million by 2033, exhibiting a CAGR of xx% during the forecast period. The report meticulously analyzes key players, including Evonik, Active Oxygens, Hydrite, Solvay, Proquimia, Airedale Chemical, Biosan, Arxada Enviro Tech, Tanfac Industries, D2 Sanitizers, Ecocare, and Fortrex, providing a competitive landscape overview.
Food Grade Peracetic Acid Market Concentration & Innovation
The global food grade peracetic acid market exhibits a moderately concentrated structure, with the top five players holding an estimated xx% market share in 2025. Innovation is a key driver, fueled by the demand for more effective and environmentally friendly sanitizing solutions. Regulatory frameworks, such as those set by the FDA and other global food safety agencies, significantly influence product development and market access. The market also sees competition from alternative sanitizers, including chlorine-based solutions and other oxidizing agents. However, peracetic acid's broad-spectrum efficacy and environmentally friendly profile are key differentiators. M&A activities have been relatively moderate in recent years, with a total estimated deal value of $xx million between 2019 and 2024.
- Key Players Market Share (2025): Evonik (xx%), Solvay (xx%), Hydrite (xx%), Active Oxygens (xx%), Others (xx%)
- M&A Activity (2019-2024): Total Deal Value: $xx million; Number of Deals: xx
Food Grade Peracetic Acid Industry Trends & Insights
The food grade peracetic acid market is experiencing robust growth, driven by increasing consumer demand for safe and high-quality food products. Stringent food safety regulations across the globe are further propelling the market. Technological advancements in formulation and application methods are enhancing the efficiency and efficacy of peracetic acid solutions. The rising adoption of peracetic acid in diverse food processing applications, including sanitation of equipment, packaging, and food contact surfaces, is a major growth driver. Furthermore, the growing awareness of the environmental benefits of peracetic acid compared to traditional chemical sanitizers is also contributing to market expansion. The market is witnessing increasing penetration in developing economies due to rising food processing industries and improving infrastructure. Competitive dynamics are characterized by both price competition and innovation-led differentiation.
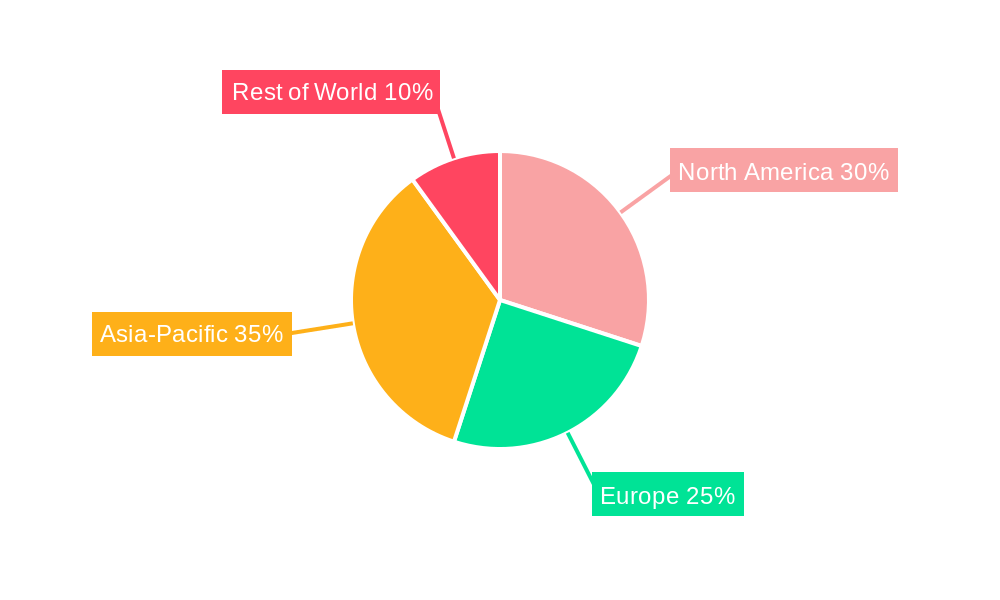
Dominant Markets & Segments in Food Grade Peracetic Acid
The North American region dominates the global food grade peracetic acid market, driven by stringent food safety regulations, a well-established food processing industry, and high consumer awareness.
- Key Drivers in North America:
- Stringent food safety regulations and enforcement
- High consumer demand for safe and high-quality food products
- Well-developed food processing infrastructure
- High disposable income leading to increased consumption of processed foods
Other regions such as Europe and Asia-Pacific are also witnessing significant growth, fueled by increasing investments in the food processing sector and the adoption of advanced sanitation practices.
Food Grade Peracetic Acid Product Developments
Recent innovations in food-grade peracetic acid focus on enhancing its stability, efficacy, and ease of use. This includes developing formulations with improved shelf life and controlled release mechanisms. Furthermore, advancements in application technologies, such as automated spraying systems and immersion techniques, are improving the efficiency of sanitation processes. These developments are tailored to meet the specific needs of different food processing segments, offering competitive advantages in terms of cost-effectiveness, safety, and environmental impact.
Report Scope & Segmentation Analysis
This report segments the food grade peracetic acid market based on various factors, including application (e.g., equipment sanitation, food contact surface sanitation), concentration (e.g., low, medium, high), and end-user industry (e.g., meat & poultry, dairy, beverages). Each segment is analyzed in detail, providing market size estimations, growth projections, and competitive dynamics. For example, the equipment sanitation segment is expected to experience significant growth due to the increasing adoption of automated cleaning systems in food processing facilities.
Key Drivers of Food Grade Peracetic Acid Growth
The growth of the food grade peracetic acid market is primarily driven by factors such as stringent food safety regulations, the rising demand for safe and high-quality food, increasing awareness of peracetic acid's environmentally friendly nature, and advancements in product formulation and application technologies. Furthermore, the expanding food processing industry in developing economies and growing consumer disposable income are contributing to market expansion.
Challenges in the Food Grade Peracetic Acid Sector
The food grade peracetic acid market faces challenges such as price volatility of raw materials, stringent regulatory requirements impacting manufacturing and distribution, and potential competition from other sanitizing agents. Supply chain disruptions, particularly during periods of high demand, can also impact market stability.
Emerging Opportunities in Food Grade Peracetic Acid
Emerging opportunities lie in developing specialized formulations for specific food applications, expanding into new geographical markets (especially developing economies), and exploring synergies with other food safety technologies. The development of sustainable and eco-friendly packaging solutions using peracetic acid also presents a significant growth opportunity.
Key Developments in Food Grade Peracetic Acid Industry
- 2022: Evonik launched a new formulation of food-grade peracetic acid with enhanced stability.
- 2023: Solvay announced a strategic partnership to expand its distribution network for food-grade peracetic acid in Asia.
- 2024: Hydrite invested in a new production facility to increase its manufacturing capacity.
Strategic Outlook for Food Grade Peracetic Acid Market
The future of the food grade peracetic acid market looks promising, driven by continued growth in the food processing industry, increasing consumer awareness of food safety, and the development of innovative and sustainable solutions. The market is expected to witness significant expansion in developing countries, presenting substantial growth opportunities for market players. Focusing on R&D to enhance product efficacy and addressing environmental concerns will be crucial for sustained success.
Food Grade Peracetic Acid Segmentation
-
1. Application
- 1.1. Fruits & Vegetables
- 1.2. Meat
- 1.3. Dairy Products
- 1.4. Others
-
2. Type
- 2.1. Low Concentration (<5%)
- 2.2. Medium Concentration (5%-20%)
- 2.3. High Concentration (>20%)
Food Grade Peracetic Acid Segmentation By Geography
-
1. North America
- 1.1. United States
- 1.2. Canada
- 1.3. Mexico
-
2. South America
- 2.1. Brazil
- 2.2. Argentina
- 2.3. Rest of South America
-
3. Europe
- 3.1. United Kingdom
- 3.2. Germany
- 3.3. France
- 3.4. Italy
- 3.5. Spain
- 3.6. Russia
- 3.7. Benelux
- 3.8. Nordics
- 3.9. Rest of Europe
-
4. Middle East & Africa
- 4.1. Turkey
- 4.2. Israel
- 4.3. GCC
- 4.4. North Africa
- 4.5. South Africa
- 4.6. Rest of Middle East & Africa
-
5. Asia Pacific
- 5.1. China
- 5.2. India
- 5.3. Japan
- 5.4. South Korea
- 5.5. ASEAN
- 5.6. Oceania
- 5.7. Rest of Asia Pacific
Food Grade Peracetic Acid Regional Market Share
Geographic Coverage of Food Grade Peracetic Acid
Food Grade Peracetic Acid REPORT HIGHLIGHTS
| Aspects | Details |
|---|---|
| Study Period | 2020-2034 |
| Base Year | 2025 |
| Estimated Year | 2026 |
| Forecast Period | 2026-2034 |
| Historical Period | 2020-2025 |
| Growth Rate | CAGR of 5.3% from 2020-2034 |
| Segmentation |
|
Table of Contents
- 1. Introduction
- 1.1. Research Scope
- 1.2. Market Segmentation
- 1.3. Research Objective
- 1.4. Definitions and Assumptions
- 2. Executive Summary
- 2.1. Market Snapshot
- 3. Market Dynamics
- 3.1. Market Drivers
- 3.2. Market Restrains
- 3.3. Market Trends
- 3.4. Market Opportunities
- 4. Market Factor Analysis
- 4.1. Porters Five Forces
- 4.1.1. Bargaining Power of Suppliers
- 4.1.2. Bargaining Power of Buyers
- 4.1.3. Threat of New Entrants
- 4.1.4. Threat of Substitutes
- 4.1.5. Competitive Rivalry
- 4.2. PESTEL analysis
- 4.3. BCG Analysis
- 4.3.1. Stars (High Growth, High Market Share)
- 4.3.2. Cash Cows (Low Growth, High Market Share)
- 4.3.3. Question Mark (High Growth, Low Market Share)
- 4.3.4. Dogs (Low Growth, Low Market Share)
- 4.4. Ansoff Matrix Analysis
- 4.5. Supply Chain Analysis
- 4.6. Regulatory Landscape
- 4.7. Current Market Potential and Opportunity Assessment (TAM–SAM–SOM Framework)
- 4.8. RAX Analyst Note
- 4.1. Porters Five Forces
- 5. Market Analysis, Insights and Forecast 2021-2033
- 5.1. Market Analysis, Insights and Forecast - by Application
- 5.1.1. Fruits & Vegetables
- 5.1.2. Meat
- 5.1.3. Dairy Products
- 5.1.4. Others
- 5.2. Market Analysis, Insights and Forecast - by Type
- 5.2.1. Low Concentration (<5%)
- 5.2.2. Medium Concentration (5%-20%)
- 5.2.3. High Concentration (>20%)
- 5.3. Market Analysis, Insights and Forecast - by Region
- 5.3.1. North America
- 5.3.2. South America
- 5.3.3. Europe
- 5.3.4. Middle East & Africa
- 5.3.5. Asia Pacific
- 5.1. Market Analysis, Insights and Forecast - by Application
- 6. Global Food Grade Peracetic Acid Analysis, Insights and Forecast, 2021-2033
- 6.1. Market Analysis, Insights and Forecast - by Application
- 6.1.1. Fruits & Vegetables
- 6.1.2. Meat
- 6.1.3. Dairy Products
- 6.1.4. Others
- 6.2. Market Analysis, Insights and Forecast - by Type
- 6.2.1. Low Concentration (<5%)
- 6.2.2. Medium Concentration (5%-20%)
- 6.2.3. High Concentration (>20%)
- 6.1. Market Analysis, Insights and Forecast - by Application
- 7. North America Food Grade Peracetic Acid Analysis, Insights and Forecast, 2020-2032
- 7.1. Market Analysis, Insights and Forecast - by Application
- 7.1.1. Fruits & Vegetables
- 7.1.2. Meat
- 7.1.3. Dairy Products
- 7.1.4. Others
- 7.2. Market Analysis, Insights and Forecast - by Type
- 7.2.1. Low Concentration (<5%)
- 7.2.2. Medium Concentration (5%-20%)
- 7.2.3. High Concentration (>20%)
- 7.1. Market Analysis, Insights and Forecast - by Application
- 8. South America Food Grade Peracetic Acid Analysis, Insights and Forecast, 2020-2032
- 8.1. Market Analysis, Insights and Forecast - by Application
- 8.1.1. Fruits & Vegetables
- 8.1.2. Meat
- 8.1.3. Dairy Products
- 8.1.4. Others
- 8.2. Market Analysis, Insights and Forecast - by Type
- 8.2.1. Low Concentration (<5%)
- 8.2.2. Medium Concentration (5%-20%)
- 8.2.3. High Concentration (>20%)
- 8.1. Market Analysis, Insights and Forecast - by Application
- 9. Europe Food Grade Peracetic Acid Analysis, Insights and Forecast, 2020-2032
- 9.1. Market Analysis, Insights and Forecast - by Application
- 9.1.1. Fruits & Vegetables
- 9.1.2. Meat
- 9.1.3. Dairy Products
- 9.1.4. Others
- 9.2. Market Analysis, Insights and Forecast - by Type
- 9.2.1. Low Concentration (<5%)
- 9.2.2. Medium Concentration (5%-20%)
- 9.2.3. High Concentration (>20%)
- 9.1. Market Analysis, Insights and Forecast - by Application
- 10. Middle East & Africa Food Grade Peracetic Acid Analysis, Insights and Forecast, 2020-2032
- 10.1. Market Analysis, Insights and Forecast - by Application
- 10.1.1. Fruits & Vegetables
- 10.1.2. Meat
- 10.1.3. Dairy Products
- 10.1.4. Others
- 10.2. Market Analysis, Insights and Forecast - by Type
- 10.2.1. Low Concentration (<5%)
- 10.2.2. Medium Concentration (5%-20%)
- 10.2.3. High Concentration (>20%)
- 10.1. Market Analysis, Insights and Forecast - by Application
- 11. Asia Pacific Food Grade Peracetic Acid Analysis, Insights and Forecast, 2020-2032
- 11.1. Market Analysis, Insights and Forecast - by Application
- 11.1.1. Fruits & Vegetables
- 11.1.2. Meat
- 11.1.3. Dairy Products
- 11.1.4. Others
- 11.2. Market Analysis, Insights and Forecast - by Type
- 11.2.1. Low Concentration (<5%)
- 11.2.2. Medium Concentration (5%-20%)
- 11.2.3. High Concentration (>20%)
- 11.1. Market Analysis, Insights and Forecast - by Application
- 12. Competitive Analysis
- 12.1. Company Profiles
- 12.1.1 Evonik
- 12.1.1.1. Company Overview
- 12.1.1.2. Products
- 12.1.1.3. Company Financials
- 12.1.1.4. SWOT Analysis
- 12.1.2 Active Oxygens
- 12.1.2.1. Company Overview
- 12.1.2.2. Products
- 12.1.2.3. Company Financials
- 12.1.2.4. SWOT Analysis
- 12.1.3 Hydrite
- 12.1.3.1. Company Overview
- 12.1.3.2. Products
- 12.1.3.3. Company Financials
- 12.1.3.4. SWOT Analysis
- 12.1.4 Solvay
- 12.1.4.1. Company Overview
- 12.1.4.2. Products
- 12.1.4.3. Company Financials
- 12.1.4.4. SWOT Analysis
- 12.1.5 Proquimia
- 12.1.5.1. Company Overview
- 12.1.5.2. Products
- 12.1.5.3. Company Financials
- 12.1.5.4. SWOT Analysis
- 12.1.6 Airedale Chemical
- 12.1.6.1. Company Overview
- 12.1.6.2. Products
- 12.1.6.3. Company Financials
- 12.1.6.4. SWOT Analysis
- 12.1.7 Biosan
- 12.1.7.1. Company Overview
- 12.1.7.2. Products
- 12.1.7.3. Company Financials
- 12.1.7.4. SWOT Analysis
- 12.1.8 Arxada Enviro Tech
- 12.1.8.1. Company Overview
- 12.1.8.2. Products
- 12.1.8.3. Company Financials
- 12.1.8.4. SWOT Analysis
- 12.1.9 Tanfac Industries
- 12.1.9.1. Company Overview
- 12.1.9.2. Products
- 12.1.9.3. Company Financials
- 12.1.9.4. SWOT Analysis
- 12.1.10 D2 Sanitizers
- 12.1.10.1. Company Overview
- 12.1.10.2. Products
- 12.1.10.3. Company Financials
- 12.1.10.4. SWOT Analysis
- 12.1.11 Ecocare
- 12.1.11.1. Company Overview
- 12.1.11.2. Products
- 12.1.11.3. Company Financials
- 12.1.11.4. SWOT Analysis
- 12.1.12 Fortrex
- 12.1.12.1. Company Overview
- 12.1.12.2. Products
- 12.1.12.3. Company Financials
- 12.1.12.4. SWOT Analysis
- 12.1.1 Evonik
- 12.2. Market Entropy
- 12.2.1 Company's Key Areas Served
- 12.2.2 Recent Developments
- 12.3. Company Market Share Analysis 2025
- 12.3.1 Top 5 Companies Market Share Analysis
- 12.3.2 Top 3 Companies Market Share Analysis
- 12.4. List of Potential Customers
- 13. Research Methodology
List of Figures
- Figure 1: Global Food Grade Peracetic Acid Revenue Breakdown (million, %) by Region 2025 & 2033
- Figure 2: North America Food Grade Peracetic Acid Revenue (million), by Application 2025 & 2033
- Figure 3: North America Food Grade Peracetic Acid Revenue Share (%), by Application 2025 & 2033
- Figure 4: North America Food Grade Peracetic Acid Revenue (million), by Type 2025 & 2033
- Figure 5: North America Food Grade Peracetic Acid Revenue Share (%), by Type 2025 & 2033
- Figure 6: North America Food Grade Peracetic Acid Revenue (million), by Country 2025 & 2033
- Figure 7: North America Food Grade Peracetic Acid Revenue Share (%), by Country 2025 & 2033
- Figure 8: South America Food Grade Peracetic Acid Revenue (million), by Application 2025 & 2033
- Figure 9: South America Food Grade Peracetic Acid Revenue Share (%), by Application 2025 & 2033
- Figure 10: South America Food Grade Peracetic Acid Revenue (million), by Type 2025 & 2033
- Figure 11: South America Food Grade Peracetic Acid Revenue Share (%), by Type 2025 & 2033
- Figure 12: South America Food Grade Peracetic Acid Revenue (million), by Country 2025 & 2033
- Figure 13: South America Food Grade Peracetic Acid Revenue Share (%), by Country 2025 & 2033
- Figure 14: Europe Food Grade Peracetic Acid Revenue (million), by Application 2025 & 2033
- Figure 15: Europe Food Grade Peracetic Acid Revenue Share (%), by Application 2025 & 2033
- Figure 16: Europe Food Grade Peracetic Acid Revenue (million), by Type 2025 & 2033
- Figure 17: Europe Food Grade Peracetic Acid Revenue Share (%), by Type 2025 & 2033
- Figure 18: Europe Food Grade Peracetic Acid Revenue (million), by Country 2025 & 2033
- Figure 19: Europe Food Grade Peracetic Acid Revenue Share (%), by Country 2025 & 2033
- Figure 20: Middle East & Africa Food Grade Peracetic Acid Revenue (million), by Application 2025 & 2033
- Figure 21: Middle East & Africa Food Grade Peracetic Acid Revenue Share (%), by Application 2025 & 2033
- Figure 22: Middle East & Africa Food Grade Peracetic Acid Revenue (million), by Type 2025 & 2033
- Figure 23: Middle East & Africa Food Grade Peracetic Acid Revenue Share (%), by Type 2025 & 2033
- Figure 24: Middle East & Africa Food Grade Peracetic Acid Revenue (million), by Country 2025 & 2033
- Figure 25: Middle East & Africa Food Grade Peracetic Acid Revenue Share (%), by Country 2025 & 2033
- Figure 26: Asia Pacific Food Grade Peracetic Acid Revenue (million), by Application 2025 & 2033
- Figure 27: Asia Pacific Food Grade Peracetic Acid Revenue Share (%), by Application 2025 & 2033
- Figure 28: Asia Pacific Food Grade Peracetic Acid Revenue (million), by Type 2025 & 2033
- Figure 29: Asia Pacific Food Grade Peracetic Acid Revenue Share (%), by Type 2025 & 2033
- Figure 30: Asia Pacific Food Grade Peracetic Acid Revenue (million), by Country 2025 & 2033
- Figure 31: Asia Pacific Food Grade Peracetic Acid Revenue Share (%), by Country 2025 & 2033
List of Tables
- Table 1: Global Food Grade Peracetic Acid Revenue million Forecast, by Application 2020 & 2033
- Table 2: Global Food Grade Peracetic Acid Revenue million Forecast, by Type 2020 & 2033
- Table 3: Global Food Grade Peracetic Acid Revenue million Forecast, by Region 2020 & 2033
- Table 4: Global Food Grade Peracetic Acid Revenue million Forecast, by Application 2020 & 2033
- Table 5: Global Food Grade Peracetic Acid Revenue million Forecast, by Type 2020 & 2033
- Table 6: Global Food Grade Peracetic Acid Revenue million Forecast, by Country 2020 & 2033
- Table 7: United States Food Grade Peracetic Acid Revenue (million) Forecast, by Application 2020 & 2033
- Table 8: Canada Food Grade Peracetic Acid Revenue (million) Forecast, by Application 2020 & 2033
- Table 9: Mexico Food Grade Peracetic Acid Revenue (million) Forecast, by Application 2020 & 2033
- Table 10: Global Food Grade Peracetic Acid Revenue million Forecast, by Application 2020 & 2033
- Table 11: Global Food Grade Peracetic Acid Revenue million Forecast, by Type 2020 & 2033
- Table 12: Global Food Grade Peracetic Acid Revenue million Forecast, by Country 2020 & 2033
- Table 13: Brazil Food Grade Peracetic Acid Revenue (million) Forecast, by Application 2020 & 2033
- Table 14: Argentina Food Grade Peracetic Acid Revenue (million) Forecast, by Application 2020 & 2033
- Table 15: Rest of South America Food Grade Peracetic Acid Revenue (million) Forecast, by Application 2020 & 2033
- Table 16: Global Food Grade Peracetic Acid Revenue million Forecast, by Application 2020 & 2033
- Table 17: Global Food Grade Peracetic Acid Revenue million Forecast, by Type 2020 & 2033
- Table 18: Global Food Grade Peracetic Acid Revenue million Forecast, by Country 2020 & 2033
- Table 19: United Kingdom Food Grade Peracetic Acid Revenue (million) Forecast, by Application 2020 & 2033
- Table 20: Germany Food Grade Peracetic Acid Revenue (million) Forecast, by Application 2020 & 2033
- Table 21: France Food Grade Peracetic Acid Revenue (million) Forecast, by Application 2020 & 2033
- Table 22: Italy Food Grade Peracetic Acid Revenue (million) Forecast, by Application 2020 & 2033
- Table 23: Spain Food Grade Peracetic Acid Revenue (million) Forecast, by Application 2020 & 2033
- Table 24: Russia Food Grade Peracetic Acid Revenue (million) Forecast, by Application 2020 & 2033
- Table 25: Benelux Food Grade Peracetic Acid Revenue (million) Forecast, by Application 2020 & 2033
- Table 26: Nordics Food Grade Peracetic Acid Revenue (million) Forecast, by Application 2020 & 2033
- Table 27: Rest of Europe Food Grade Peracetic Acid Revenue (million) Forecast, by Application 2020 & 2033
- Table 28: Global Food Grade Peracetic Acid Revenue million Forecast, by Application 2020 & 2033
- Table 29: Global Food Grade Peracetic Acid Revenue million Forecast, by Type 2020 & 2033
- Table 30: Global Food Grade Peracetic Acid Revenue million Forecast, by Country 2020 & 2033
- Table 31: Turkey Food Grade Peracetic Acid Revenue (million) Forecast, by Application 2020 & 2033
- Table 32: Israel Food Grade Peracetic Acid Revenue (million) Forecast, by Application 2020 & 2033
- Table 33: GCC Food Grade Peracetic Acid Revenue (million) Forecast, by Application 2020 & 2033
- Table 34: North Africa Food Grade Peracetic Acid Revenue (million) Forecast, by Application 2020 & 2033
- Table 35: South Africa Food Grade Peracetic Acid Revenue (million) Forecast, by Application 2020 & 2033
- Table 36: Rest of Middle East & Africa Food Grade Peracetic Acid Revenue (million) Forecast, by Application 2020 & 2033
- Table 37: Global Food Grade Peracetic Acid Revenue million Forecast, by Application 2020 & 2033
- Table 38: Global Food Grade Peracetic Acid Revenue million Forecast, by Type 2020 & 2033
- Table 39: Global Food Grade Peracetic Acid Revenue million Forecast, by Country 2020 & 2033
- Table 40: China Food Grade Peracetic Acid Revenue (million) Forecast, by Application 2020 & 2033
- Table 41: India Food Grade Peracetic Acid Revenue (million) Forecast, by Application 2020 & 2033
- Table 42: Japan Food Grade Peracetic Acid Revenue (million) Forecast, by Application 2020 & 2033
- Table 43: South Korea Food Grade Peracetic Acid Revenue (million) Forecast, by Application 2020 & 2033
- Table 44: ASEAN Food Grade Peracetic Acid Revenue (million) Forecast, by Application 2020 & 2033
- Table 45: Oceania Food Grade Peracetic Acid Revenue (million) Forecast, by Application 2020 & 2033
- Table 46: Rest of Asia Pacific Food Grade Peracetic Acid Revenue (million) Forecast, by Application 2020 & 2033
Frequently Asked Questions
1. What is the projected Compound Annual Growth Rate (CAGR) of the Food Grade Peracetic Acid?
The projected CAGR is approximately 5.3%.
2. Which companies are prominent players in the Food Grade Peracetic Acid?
Key companies in the market include Evonik, Active Oxygens, Hydrite, Solvay, Proquimia, Airedale Chemical, Biosan, Arxada Enviro Tech, Tanfac Industries, D2 Sanitizers, Ecocare, Fortrex.
3. What are the main segments of the Food Grade Peracetic Acid?
The market segments include Application, Type.
4. Can you provide details about the market size?
The market size is estimated to be USD 428 million as of 2022.
5. What are some drivers contributing to market growth?
N/A
6. What are the notable trends driving market growth?
N/A
7. Are there any restraints impacting market growth?
N/A
8. Can you provide examples of recent developments in the market?
N/A
9. What pricing options are available for accessing the report?
Pricing options include single-user, multi-user, and enterprise licenses priced at USD 2900.00, USD 4350.00, and USD 5800.00 respectively.
10. Is the market size provided in terms of value or volume?
The market size is provided in terms of value, measured in million.
11. Are there any specific market keywords associated with the report?
Yes, the market keyword associated with the report is "Food Grade Peracetic Acid," which aids in identifying and referencing the specific market segment covered.
12. How do I determine which pricing option suits my needs best?
The pricing options vary based on user requirements and access needs. Individual users may opt for single-user licenses, while businesses requiring broader access may choose multi-user or enterprise licenses for cost-effective access to the report.
13. Are there any additional resources or data provided in the Food Grade Peracetic Acid report?
While the report offers comprehensive insights, it's advisable to review the specific contents or supplementary materials provided to ascertain if additional resources or data are available.
14. How can I stay updated on further developments or reports in the Food Grade Peracetic Acid?
To stay informed about further developments, trends, and reports in the Food Grade Peracetic Acid, consider subscribing to industry newsletters, following relevant companies and organizations, or regularly checking reputable industry news sources and publications.
Methodology
Step 1 - Identification of Relevant Samples Size from Population Database


Step 2 - Approaches for Defining Global Market Size (Value, Volume* & Price*)

Note*: In applicable scenarios
Step 3 - Data Sources
Primary Research
- Web Analytics
- Survey Reports
- Research Institute
- Latest Research Reports
- Opinion Leaders
Secondary Research
- Annual Reports
- White Paper
- Latest Press Release
- Industry Association
- Paid Database
- Investor Presentations

Step 4 - Data Triangulation
Involves using different sources of information in order to increase the validity of a study
These sources are likely to be stakeholders in a program - participants, other researchers, program staff, other community members, and so on.
Then we put all data in single framework & apply various statistical tools to find out the dynamic on the market.
During the analysis stage, feedback from the stakeholder groups would be compared to determine areas of agreement as well as areas of divergence