
Key Insights
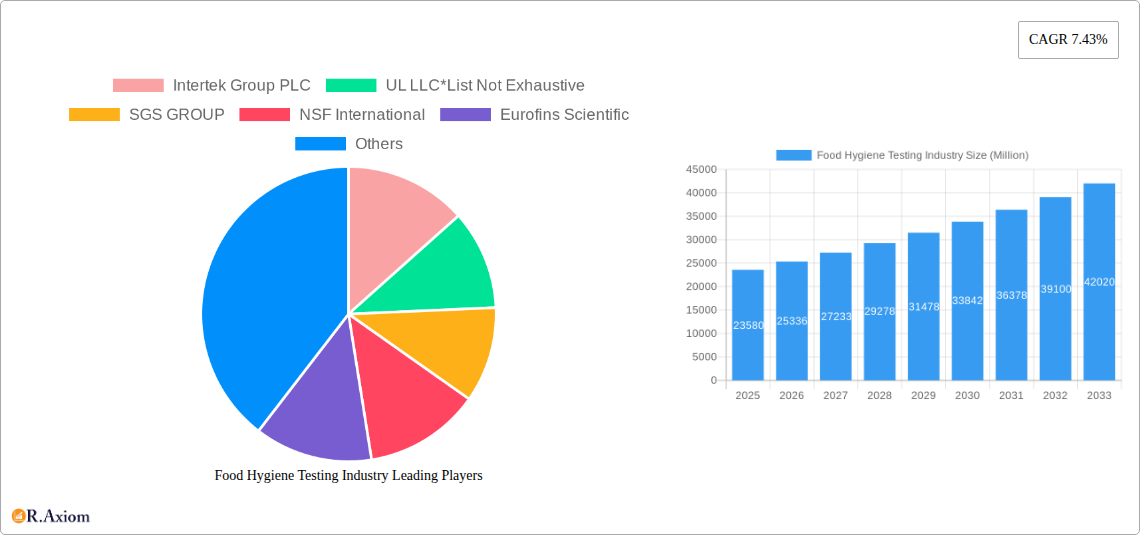
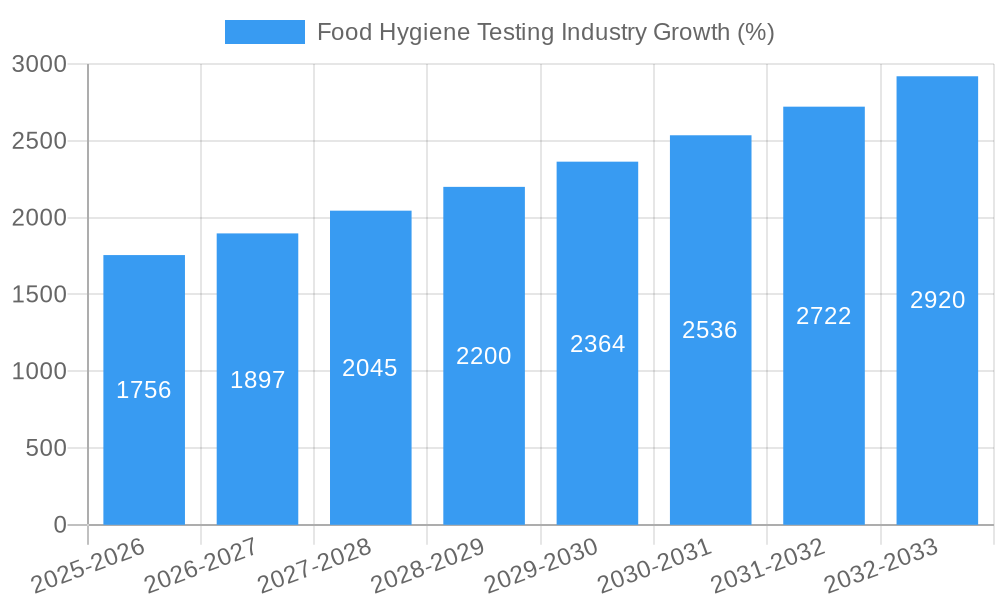
The global food hygiene testing market, valued at $23.58 billion in 2025, is projected to experience robust growth, exhibiting a Compound Annual Growth Rate (CAGR) of 7.43% from 2025 to 2033. This expansion is driven by several key factors. Stringent government regulations concerning food safety and quality, coupled with increasing consumer awareness regarding foodborne illnesses, are compelling food producers and processors to invest heavily in rigorous testing protocols. The rising prevalence of food contamination incidents, including those related to pathogens, pesticides, mycotoxins, and allergens, fuels the demand for advanced testing technologies. Furthermore, the growth of the processed food industry, particularly segments like baby food and dietary supplements requiring stringent quality control, significantly contributes to market expansion. Technological advancements in testing methodologies, such as the wider adoption of PCR, immunoassay-based techniques, and chromatography, also play a vital role in driving market growth by offering faster, more accurate, and higher-throughput testing capabilities.
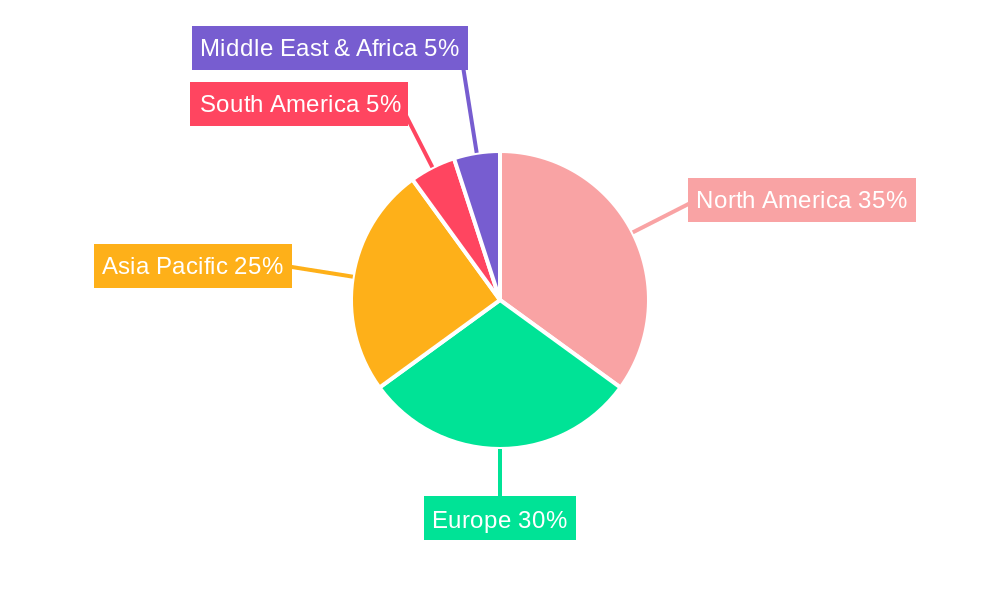
The market segmentation reveals significant opportunities across various testing types. Pathogen testing constitutes a substantial portion, reflecting the critical need to detect and prevent harmful bacteria and viruses. Pesticide and residue testing, crucial for ensuring food safety and meeting regulatory compliance, also demonstrates strong demand. Similarly, the rising awareness of mycotoxins and allergens further drives segment growth. Geographically, North America and Europe currently dominate the market due to established regulatory frameworks and advanced testing infrastructure. However, the Asia-Pacific region is poised for significant growth, driven by expanding food processing industries and rising disposable incomes. The competitive landscape comprises several global players, including Intertek, UL, SGS, NSF International, and Eurofins Scientific, engaged in providing a comprehensive suite of testing services. These companies are constantly innovating and expanding their service offerings to cater to the evolving needs of the food industry.
Food Hygiene Testing Industry: A Comprehensive Market Report (2019-2033)
This comprehensive report provides a detailed analysis of the global food hygiene testing industry, offering invaluable insights for stakeholders, investors, and industry professionals. With a study period spanning 2019-2033, a base year of 2025, and a forecast period of 2025-2033, this report offers a robust understanding of historical trends and future market projections. The total market size is estimated at $XX Billion in 2025, with a projected CAGR of XX% during the forecast period.
Food Hygiene Testing Industry Market Concentration & Innovation
The food hygiene testing industry is moderately concentrated, with several large multinational players dominating the market. Key players like Intertek Group PLC, UL LLC, SGS GROUP, NSF International, Eurofins Scientific, Merieux Nutrisciences, ALS Limited, Asurequality Limited, and TUV SUD hold significant market share, estimated collectively at approximately 60% in 2025. However, a considerable number of smaller, regional laboratories also contribute to the overall market. Innovation is driven by the increasing demand for faster, more accurate, and cost-effective testing methods. Stringent regulatory frameworks, particularly concerning food safety and labeling, are major drivers for industry growth. The development of sophisticated technologies such as PCR, immunoassays, and chromatography is significantly impacting the market. The threat of substitute technologies is low, but ongoing innovations constantly improve efficiency and accuracy. End-user trends reveal a growing focus on food traceability and transparency. Mergers and acquisitions (M&A) activity is high, with deal values exceeding $XX Billion in the last five years. These activities demonstrate the industry's consolidation and expansion efforts.
- Market Share: Top 10 players hold ~60% market share (2025 estimate).
- M&A Activity: Deal values exceeding $XX Billion (2019-2024).
- Innovation Drivers: Demand for faster, accurate testing; stringent regulations; technological advancements.
Food Hygiene Testing Industry Industry Trends & Insights
The global food hygiene testing market is experiencing robust growth, fueled by several key factors. Increasing consumer awareness of food safety and quality, coupled with stringent government regulations worldwide, is driving demand for testing services. The rise of e-commerce and globalization in the food industry has also contributed to this growth, as traceability and safety are paramount for international trade. Technological advancements, particularly in rapid testing methods, are significantly improving testing efficiency and reducing turnaround times. This has increased market penetration by making testing more affordable and accessible to a wider range of businesses. Consumer preferences are shifting towards healthier, safer food options, further stimulating demand. The competitive landscape is characterized by both large multinational companies and smaller specialized laboratories. This competition promotes innovation and drives prices down, benefiting consumers. The market's Compound Annual Growth Rate (CAGR) is projected at XX% from 2025 to 2033, indicating considerable future growth. Market penetration is increasing across both developed and developing economies, reflecting a growing global awareness of food safety issues.
Dominant Markets & Segments in Food Hygiene Testing Industry
The North American region currently holds the largest market share in the food hygiene testing industry, driven by strong regulatory frameworks and high consumer awareness. Within contaminant testing, pathogen testing dominates, followed by pesticide residue and allergen testing. PCR technology is currently the most widely used testing method due to its high sensitivity and specificity. The processed food segment (including baby food, bakery products, and snacks) is the leading application area, reflecting the high stakes associated with food safety in these categories.
- Key Drivers (North America): Stringent regulations, high consumer awareness, robust infrastructure.
- Dominant Contaminant Testing Segment: Pathogen Testing.
- Dominant Technology: Polymerase Chain Reaction (PCR).
- Dominant Application Area: Processed Food.
Detailed dominance analysis reveals that the high prevalence of foodborne illnesses, strict regulatory compliance requirements in developed countries, and increasing consumer demand for transparent and reliable food products all contribute to this market segment's leadership. The high capital expenditure for establishing and maintaining high-quality testing infrastructure and the specialized expertise required to operate advanced analytical techniques also creates a barrier to market entry, creating a scenario dominated by established companies.
Food Hygiene Testing Industry Product Developments
Recent product innovations focus on enhancing speed, accuracy, and cost-effectiveness. Rapid testing kits are becoming increasingly popular, addressing the need for faster turnaround times. Multiplex assays, capable of detecting multiple contaminants simultaneously, are also gaining traction, improving efficiency. These developments reflect a broader trend towards automation and miniaturization in analytical techniques. The competitive advantage lies in offering faster, more accurate, and more comprehensive testing solutions, often tailored to specific customer needs and regulatory requirements.
Report Scope & Segmentation Analysis
This report comprehensively segments the food hygiene testing market across various categories.
Contaminant Testing: Pathogen testing, pesticide and residue testing, mycotoxin testing, GMO testing, allergen testing, and other contaminant testing represent distinct market segments with varying growth rates and competitive dynamics. Growth projections vary greatly across these segments depending on factors like evolving regulatory landscapes and consumer preferences. Market sizes are substantial for each segment, with pathogen testing currently leading the way.
Technology: Polymerase Chain Reaction (PCR), immunoassay-based, chromatography and spectrometry, and other technologies each offer unique capabilities and target different market niches. PCR's high sensitivity is currently driving significant growth, but other technologies hold significant potential for future expansion.
Application: Animal feed and pet food, food, and processed food (including baby food, bakery products, savory and sweet snacks, and dietary supplements) all present distinct market segments with varying growth trajectories. The processed food sector remains the largest segment due to the higher risk and regulatory pressure associated with these products.
Key Drivers of Food Hygiene Testing Industry Growth
Several factors contribute to the industry's growth. Stringent food safety regulations are a primary driver, mandating testing for various contaminants. Rising consumer awareness of food safety and quality motivates demand. Technological advancements leading to faster, more efficient testing methods, and the increasing globalization of food trade which necessitates rigorous quality controls, all contribute to the expanding market.
Challenges in the Food Hygiene Testing Industry Sector
The industry faces challenges, including high initial investment costs for advanced equipment, the need for highly skilled personnel, and the complexity of regulatory compliance across various jurisdictions. Competition from numerous players also creates pressure on pricing and profit margins. Maintaining consistent quality across diverse testing methods and technologies remains a critical challenge, especially in emerging markets where testing infrastructure might be less developed.
Emerging Opportunities in Food Hygiene Testing Industry
Emerging opportunities lie in developing rapid, point-of-care testing technologies for on-site analysis. Expanding into new, underserved markets and developing customized solutions tailored to specific food products present significant growth potential. The integration of data analytics and AI into testing processes may lead to improved accuracy and efficiency, presenting another opportunity.
Leading Players in the Food Hygiene Testing Industry Market
- Intertek Group PLC
- UL LLC
- SGS GROUP
- NSF International
- Eurofins Scientific
- Merieux Nutrisciences
- ALS Limited
- Asurequality Limited
- TUV SUD
Key Developments in Food Hygiene Testing Industry Industry
- July 2022: SGS launched a new food analysis laboratory in Naucalpan, Mexico, enhancing its capacity to support the Mexican food industry’s quality control and regulatory compliance needs.
- May 2022: Bureau Veritas opened its third US microbiology laboratory in Reno, Nevada, focusing on rapid pathogen testing and microbiology indicator analyses for the agri-food sector.
- April 2022: Mérieux NutriSciences acquired Hortec Pty Ltd (South Africa) and Laboratorios Bromatológicos Araba SA (Spain), expanding its geographic reach and capabilities, particularly in pesticide testing.
Strategic Outlook for Food Hygiene Testing Industry Market
The future of the food hygiene testing industry is bright, driven by continuous innovation, stringent regulations, and increasing consumer demand for safe and high-quality food products. The industry will continue to consolidate, with larger players acquiring smaller laboratories. Technological advancements, particularly in rapid and multiplex testing, will enhance efficiency and lower costs. The expanding global food trade will continue to stimulate demand for testing services. Companies that can offer faster, more accurate, and more comprehensive testing solutions will be well-positioned for success.
Food Hygiene Testing Industry Segmentation
-
1. Contaminant Testing
- 1.1. Pathogen Testing
- 1.2. Pesticide and Residue Testing
- 1.3. Mycotoxin Testing
- 1.4. GMO Testing
- 1.5. Allergen Testing
- 1.6. Other Contaminant Testing
-
2. Technology
- 2.1. Polymerase Chain Reaction (PCR)
- 2.2. Immunoassay-based
-
2.3. Chromatography and Spectrometry
- 2.3.1. HPLC Based
- 2.3.2. LC-MS/MS-Based
- 2.3.3. Other Chromatography and Spectrometry
- 2.4. Other Technologies
-
3. Application
- 3.1. Animal Feed and Pet Food
- 3.2. Meat and Poultry
- 3.3. Dairy
- 3.4. Fruits and Vegetables
-
3.5. Processed Food
- 3.5.1. Baby Food
- 3.5.2. Bakery Products
- 3.5.3. Savory and Sweet Snacks
- 3.5.4. Dietary Supplements
- 3.6. Crops
- 3.7. Other Foods
Food Hygiene Testing Industry Segmentation By Geography
-
1. North America
- 1.1. United States
- 1.2. Canada
- 1.3. Mexico
- 1.4. Rest of North America
-
2. Europe
- 2.1. United Kingdom
- 2.2. Germany
- 2.3. France
- 2.4. Russia
- 2.5. Italy
- 2.6. Spain
- 2.7. Rest of Europe
-
3. Asia Pacific
- 3.1. India
- 3.2. China
- 3.3. Japan
- 3.4. Australia
- 3.5. Rest of Asia Pacific
-
4. South America
- 4.1. Brazil
- 4.2. Argentina
- 4.3. Rest of South America
- 5. Middle East
-
6. South Africa
- 6.1. Saudi Arabia
- 6.2. Rest of Middle East
Food Hygiene Testing Industry REPORT HIGHLIGHTS
| Aspects | Details |
|---|---|
| Study Period | 2019-2033 |
| Base Year | 2024 |
| Estimated Year | 2025 |
| Forecast Period | 2025-2033 |
| Historical Period | 2019-2024 |
| Growth Rate | CAGR of 7.43% from 2019-2033 |
| Segmentation |
|
Table of Contents
- 1. Introduction
- 1.1. Research Scope
- 1.2. Market Segmentation
- 1.3. Research Methodology
- 1.4. Definitions and Assumptions
- 2. Executive Summary
- 2.1. Introduction
- 3. Market Dynamics
- 3.1. Introduction
- 3.2. Market Drivers
- 3.2.1. Growing Demand for Convenience and Processed Foods Drives Demand; Expanding Cosmetic and Personal Care Industries Utilize Gelatin for Various Purposes
- 3.3. Market Restrains
- 3.3.1. Fluctuations in Raw Material Proces Affecting Production Costs
- 3.4. Market Trends
- 3.4.1. Growing Consumer Interest in Food Safety and Quality
- 4. Market Factor Analysis
- 4.1. Porters Five Forces
- 4.2. Supply/Value Chain
- 4.3. PESTEL analysis
- 4.4. Market Entropy
- 4.5. Patent/Trademark Analysis
- 5. Global Food Hygiene Testing Industry Analysis, Insights and Forecast, 2019-2031
- 5.1. Market Analysis, Insights and Forecast - by Contaminant Testing
- 5.1.1. Pathogen Testing
- 5.1.2. Pesticide and Residue Testing
- 5.1.3. Mycotoxin Testing
- 5.1.4. GMO Testing
- 5.1.5. Allergen Testing
- 5.1.6. Other Contaminant Testing
- 5.2. Market Analysis, Insights and Forecast - by Technology
- 5.2.1. Polymerase Chain Reaction (PCR)
- 5.2.2. Immunoassay-based
- 5.2.3. Chromatography and Spectrometry
- 5.2.3.1. HPLC Based
- 5.2.3.2. LC-MS/MS-Based
- 5.2.3.3. Other Chromatography and Spectrometry
- 5.2.4. Other Technologies
- 5.3. Market Analysis, Insights and Forecast - by Application
- 5.3.1. Animal Feed and Pet Food
- 5.3.2. Meat and Poultry
- 5.3.3. Dairy
- 5.3.4. Fruits and Vegetables
- 5.3.5. Processed Food
- 5.3.5.1. Baby Food
- 5.3.5.2. Bakery Products
- 5.3.5.3. Savory and Sweet Snacks
- 5.3.5.4. Dietary Supplements
- 5.3.6. Crops
- 5.3.7. Other Foods
- 5.4. Market Analysis, Insights and Forecast - by Region
- 5.4.1. North America
- 5.4.2. Europe
- 5.4.3. Asia Pacific
- 5.4.4. South America
- 5.4.5. Middle East
- 5.4.6. South Africa
- 5.1. Market Analysis, Insights and Forecast - by Contaminant Testing
- 6. North America Food Hygiene Testing Industry Analysis, Insights and Forecast, 2019-2031
- 6.1. Market Analysis, Insights and Forecast - by Contaminant Testing
- 6.1.1. Pathogen Testing
- 6.1.2. Pesticide and Residue Testing
- 6.1.3. Mycotoxin Testing
- 6.1.4. GMO Testing
- 6.1.5. Allergen Testing
- 6.1.6. Other Contaminant Testing
- 6.2. Market Analysis, Insights and Forecast - by Technology
- 6.2.1. Polymerase Chain Reaction (PCR)
- 6.2.2. Immunoassay-based
- 6.2.3. Chromatography and Spectrometry
- 6.2.3.1. HPLC Based
- 6.2.3.2. LC-MS/MS-Based
- 6.2.3.3. Other Chromatography and Spectrometry
- 6.2.4. Other Technologies
- 6.3. Market Analysis, Insights and Forecast - by Application
- 6.3.1. Animal Feed and Pet Food
- 6.3.2. Meat and Poultry
- 6.3.3. Dairy
- 6.3.4. Fruits and Vegetables
- 6.3.5. Processed Food
- 6.3.5.1. Baby Food
- 6.3.5.2. Bakery Products
- 6.3.5.3. Savory and Sweet Snacks
- 6.3.5.4. Dietary Supplements
- 6.3.6. Crops
- 6.3.7. Other Foods
- 6.1. Market Analysis, Insights and Forecast - by Contaminant Testing
- 7. Europe Food Hygiene Testing Industry Analysis, Insights and Forecast, 2019-2031
- 7.1. Market Analysis, Insights and Forecast - by Contaminant Testing
- 7.1.1. Pathogen Testing
- 7.1.2. Pesticide and Residue Testing
- 7.1.3. Mycotoxin Testing
- 7.1.4. GMO Testing
- 7.1.5. Allergen Testing
- 7.1.6. Other Contaminant Testing
- 7.2. Market Analysis, Insights and Forecast - by Technology
- 7.2.1. Polymerase Chain Reaction (PCR)
- 7.2.2. Immunoassay-based
- 7.2.3. Chromatography and Spectrometry
- 7.2.3.1. HPLC Based
- 7.2.3.2. LC-MS/MS-Based
- 7.2.3.3. Other Chromatography and Spectrometry
- 7.2.4. Other Technologies
- 7.3. Market Analysis, Insights and Forecast - by Application
- 7.3.1. Animal Feed and Pet Food
- 7.3.2. Meat and Poultry
- 7.3.3. Dairy
- 7.3.4. Fruits and Vegetables
- 7.3.5. Processed Food
- 7.3.5.1. Baby Food
- 7.3.5.2. Bakery Products
- 7.3.5.3. Savory and Sweet Snacks
- 7.3.5.4. Dietary Supplements
- 7.3.6. Crops
- 7.3.7. Other Foods
- 7.1. Market Analysis, Insights and Forecast - by Contaminant Testing
- 8. Asia Pacific Food Hygiene Testing Industry Analysis, Insights and Forecast, 2019-2031
- 8.1. Market Analysis, Insights and Forecast - by Contaminant Testing
- 8.1.1. Pathogen Testing
- 8.1.2. Pesticide and Residue Testing
- 8.1.3. Mycotoxin Testing
- 8.1.4. GMO Testing
- 8.1.5. Allergen Testing
- 8.1.6. Other Contaminant Testing
- 8.2. Market Analysis, Insights and Forecast - by Technology
- 8.2.1. Polymerase Chain Reaction (PCR)
- 8.2.2. Immunoassay-based
- 8.2.3. Chromatography and Spectrometry
- 8.2.3.1. HPLC Based
- 8.2.3.2. LC-MS/MS-Based
- 8.2.3.3. Other Chromatography and Spectrometry
- 8.2.4. Other Technologies
- 8.3. Market Analysis, Insights and Forecast - by Application
- 8.3.1. Animal Feed and Pet Food
- 8.3.2. Meat and Poultry
- 8.3.3. Dairy
- 8.3.4. Fruits and Vegetables
- 8.3.5. Processed Food
- 8.3.5.1. Baby Food
- 8.3.5.2. Bakery Products
- 8.3.5.3. Savory and Sweet Snacks
- 8.3.5.4. Dietary Supplements
- 8.3.6. Crops
- 8.3.7. Other Foods
- 8.1. Market Analysis, Insights and Forecast - by Contaminant Testing
- 9. South America Food Hygiene Testing Industry Analysis, Insights and Forecast, 2019-2031
- 9.1. Market Analysis, Insights and Forecast - by Contaminant Testing
- 9.1.1. Pathogen Testing
- 9.1.2. Pesticide and Residue Testing
- 9.1.3. Mycotoxin Testing
- 9.1.4. GMO Testing
- 9.1.5. Allergen Testing
- 9.1.6. Other Contaminant Testing
- 9.2. Market Analysis, Insights and Forecast - by Technology
- 9.2.1. Polymerase Chain Reaction (PCR)
- 9.2.2. Immunoassay-based
- 9.2.3. Chromatography and Spectrometry
- 9.2.3.1. HPLC Based
- 9.2.3.2. LC-MS/MS-Based
- 9.2.3.3. Other Chromatography and Spectrometry
- 9.2.4. Other Technologies
- 9.3. Market Analysis, Insights and Forecast - by Application
- 9.3.1. Animal Feed and Pet Food
- 9.3.2. Meat and Poultry
- 9.3.3. Dairy
- 9.3.4. Fruits and Vegetables
- 9.3.5. Processed Food
- 9.3.5.1. Baby Food
- 9.3.5.2. Bakery Products
- 9.3.5.3. Savory and Sweet Snacks
- 9.3.5.4. Dietary Supplements
- 9.3.6. Crops
- 9.3.7. Other Foods
- 9.1. Market Analysis, Insights and Forecast - by Contaminant Testing
- 10. Middle East Food Hygiene Testing Industry Analysis, Insights and Forecast, 2019-2031
- 10.1. Market Analysis, Insights and Forecast - by Contaminant Testing
- 10.1.1. Pathogen Testing
- 10.1.2. Pesticide and Residue Testing
- 10.1.3. Mycotoxin Testing
- 10.1.4. GMO Testing
- 10.1.5. Allergen Testing
- 10.1.6. Other Contaminant Testing
- 10.2. Market Analysis, Insights and Forecast - by Technology
- 10.2.1. Polymerase Chain Reaction (PCR)
- 10.2.2. Immunoassay-based
- 10.2.3. Chromatography and Spectrometry
- 10.2.3.1. HPLC Based
- 10.2.3.2. LC-MS/MS-Based
- 10.2.3.3. Other Chromatography and Spectrometry
- 10.2.4. Other Technologies
- 10.3. Market Analysis, Insights and Forecast - by Application
- 10.3.1. Animal Feed and Pet Food
- 10.3.2. Meat and Poultry
- 10.3.3. Dairy
- 10.3.4. Fruits and Vegetables
- 10.3.5. Processed Food
- 10.3.5.1. Baby Food
- 10.3.5.2. Bakery Products
- 10.3.5.3. Savory and Sweet Snacks
- 10.3.5.4. Dietary Supplements
- 10.3.6. Crops
- 10.3.7. Other Foods
- 10.1. Market Analysis, Insights and Forecast - by Contaminant Testing
- 11. South Africa Food Hygiene Testing Industry Analysis, Insights and Forecast, 2019-2031
- 11.1. Market Analysis, Insights and Forecast - by Contaminant Testing
- 11.1.1. Pathogen Testing
- 11.1.2. Pesticide and Residue Testing
- 11.1.3. Mycotoxin Testing
- 11.1.4. GMO Testing
- 11.1.5. Allergen Testing
- 11.1.6. Other Contaminant Testing
- 11.2. Market Analysis, Insights and Forecast - by Technology
- 11.2.1. Polymerase Chain Reaction (PCR)
- 11.2.2. Immunoassay-based
- 11.2.3. Chromatography and Spectrometry
- 11.2.3.1. HPLC Based
- 11.2.3.2. LC-MS/MS-Based
- 11.2.3.3. Other Chromatography and Spectrometry
- 11.2.4. Other Technologies
- 11.3. Market Analysis, Insights and Forecast - by Application
- 11.3.1. Animal Feed and Pet Food
- 11.3.2. Meat and Poultry
- 11.3.3. Dairy
- 11.3.4. Fruits and Vegetables
- 11.3.5. Processed Food
- 11.3.5.1. Baby Food
- 11.3.5.2. Bakery Products
- 11.3.5.3. Savory and Sweet Snacks
- 11.3.5.4. Dietary Supplements
- 11.3.6. Crops
- 11.3.7. Other Foods
- 11.1. Market Analysis, Insights and Forecast - by Contaminant Testing
- 12. North America Food Hygiene Testing Industry Analysis, Insights and Forecast, 2019-2031
- 12.1. Market Analysis, Insights and Forecast - By Country/Sub-region
- 12.1.1 United States
- 12.1.2 Canada
- 12.1.3 Mexico
- 12.1.4 Rest of North America
- 13. Europe Food Hygiene Testing Industry Analysis, Insights and Forecast, 2019-2031
- 13.1. Market Analysis, Insights and Forecast - By Country/Sub-region
- 13.1.1 United Kingdom
- 13.1.2 Germany
- 13.1.3 France
- 13.1.4 Russia
- 13.1.5 Italy
- 13.1.6 Spain
- 13.1.7 Rest of Europe
- 14. Asia Pacific Food Hygiene Testing Industry Analysis, Insights and Forecast, 2019-2031
- 14.1. Market Analysis, Insights and Forecast - By Country/Sub-region
- 14.1.1 India
- 14.1.2 China
- 14.1.3 Japan
- 14.1.4 Australia
- 14.1.5 Rest of Asia Pacific
- 15. South America Food Hygiene Testing Industry Analysis, Insights and Forecast, 2019-2031
- 15.1. Market Analysis, Insights and Forecast - By Country/Sub-region
- 15.1.1 Brazil
- 15.1.2 Argentina
- 15.1.3 Rest of South America
- 16. Middle East & Africa Food Hygiene Testing Industry Analysis, Insights and Forecast, 2019-2031
- 16.1. Market Analysis, Insights and Forecast - By Country/Sub-region
- 16.1.1 UAE
- 16.1.2 South Africa
- 16.1.3 Saudi Arabia
- 16.1.4 Rest of MEA
- 17. Competitive Analysis
- 17.1. Global Market Share Analysis 2024
- 17.2. Company Profiles
- 17.2.1 Intertek Group PLC
- 17.2.1.1. Overview
- 17.2.1.2. Products
- 17.2.1.3. SWOT Analysis
- 17.2.1.4. Recent Developments
- 17.2.1.5. Financials (Based on Availability)
- 17.2.2 UL LLC*List Not Exhaustive
- 17.2.2.1. Overview
- 17.2.2.2. Products
- 17.2.2.3. SWOT Analysis
- 17.2.2.4. Recent Developments
- 17.2.2.5. Financials (Based on Availability)
- 17.2.3 SGS GROUP
- 17.2.3.1. Overview
- 17.2.3.2. Products
- 17.2.3.3. SWOT Analysis
- 17.2.3.4. Recent Developments
- 17.2.3.5. Financials (Based on Availability)
- 17.2.4 NSF International
- 17.2.4.1. Overview
- 17.2.4.2. Products
- 17.2.4.3. SWOT Analysis
- 17.2.4.4. Recent Developments
- 17.2.4.5. Financials (Based on Availability)
- 17.2.5 Eurofins Scientific
- 17.2.5.1. Overview
- 17.2.5.2. Products
- 17.2.5.3. SWOT Analysis
- 17.2.5.4. Recent Developments
- 17.2.5.5. Financials (Based on Availability)
- 17.2.6 Merieux Nutrisciences
- 17.2.6.1. Overview
- 17.2.6.2. Products
- 17.2.6.3. SWOT Analysis
- 17.2.6.4. Recent Developments
- 17.2.6.5. Financials (Based on Availability)
- 17.2.7 ALS Limited
- 17.2.7.1. Overview
- 17.2.7.2. Products
- 17.2.7.3. SWOT Analysis
- 17.2.7.4. Recent Developments
- 17.2.7.5. Financials (Based on Availability)
- 17.2.8 Asurequality Limited
- 17.2.8.1. Overview
- 17.2.8.2. Products
- 17.2.8.3. SWOT Analysis
- 17.2.8.4. Recent Developments
- 17.2.8.5. Financials (Based on Availability)
- 17.2.9 TUV SUD
- 17.2.9.1. Overview
- 17.2.9.2. Products
- 17.2.9.3. SWOT Analysis
- 17.2.9.4. Recent Developments
- 17.2.9.5. Financials (Based on Availability)
- 17.2.1 Intertek Group PLC
List of Figures
- Figure 1: Global Food Hygiene Testing Industry Revenue Breakdown (Million, %) by Region 2024 & 2032
- Figure 2: North America Food Hygiene Testing Industry Revenue (Million), by Country 2024 & 2032
- Figure 3: North America Food Hygiene Testing Industry Revenue Share (%), by Country 2024 & 2032
- Figure 4: Europe Food Hygiene Testing Industry Revenue (Million), by Country 2024 & 2032
- Figure 5: Europe Food Hygiene Testing Industry Revenue Share (%), by Country 2024 & 2032
- Figure 6: Asia Pacific Food Hygiene Testing Industry Revenue (Million), by Country 2024 & 2032
- Figure 7: Asia Pacific Food Hygiene Testing Industry Revenue Share (%), by Country 2024 & 2032
- Figure 8: South America Food Hygiene Testing Industry Revenue (Million), by Country 2024 & 2032
- Figure 9: South America Food Hygiene Testing Industry Revenue Share (%), by Country 2024 & 2032
- Figure 10: Middle East & Africa Food Hygiene Testing Industry Revenue (Million), by Country 2024 & 2032
- Figure 11: Middle East & Africa Food Hygiene Testing Industry Revenue Share (%), by Country 2024 & 2032
- Figure 12: North America Food Hygiene Testing Industry Revenue (Million), by Contaminant Testing 2024 & 2032
- Figure 13: North America Food Hygiene Testing Industry Revenue Share (%), by Contaminant Testing 2024 & 2032
- Figure 14: North America Food Hygiene Testing Industry Revenue (Million), by Technology 2024 & 2032
- Figure 15: North America Food Hygiene Testing Industry Revenue Share (%), by Technology 2024 & 2032
- Figure 16: North America Food Hygiene Testing Industry Revenue (Million), by Application 2024 & 2032
- Figure 17: North America Food Hygiene Testing Industry Revenue Share (%), by Application 2024 & 2032
- Figure 18: North America Food Hygiene Testing Industry Revenue (Million), by Country 2024 & 2032
- Figure 19: North America Food Hygiene Testing Industry Revenue Share (%), by Country 2024 & 2032
- Figure 20: Europe Food Hygiene Testing Industry Revenue (Million), by Contaminant Testing 2024 & 2032
- Figure 21: Europe Food Hygiene Testing Industry Revenue Share (%), by Contaminant Testing 2024 & 2032
- Figure 22: Europe Food Hygiene Testing Industry Revenue (Million), by Technology 2024 & 2032
- Figure 23: Europe Food Hygiene Testing Industry Revenue Share (%), by Technology 2024 & 2032
- Figure 24: Europe Food Hygiene Testing Industry Revenue (Million), by Application 2024 & 2032
- Figure 25: Europe Food Hygiene Testing Industry Revenue Share (%), by Application 2024 & 2032
- Figure 26: Europe Food Hygiene Testing Industry Revenue (Million), by Country 2024 & 2032
- Figure 27: Europe Food Hygiene Testing Industry Revenue Share (%), by Country 2024 & 2032
- Figure 28: Asia Pacific Food Hygiene Testing Industry Revenue (Million), by Contaminant Testing 2024 & 2032
- Figure 29: Asia Pacific Food Hygiene Testing Industry Revenue Share (%), by Contaminant Testing 2024 & 2032
- Figure 30: Asia Pacific Food Hygiene Testing Industry Revenue (Million), by Technology 2024 & 2032
- Figure 31: Asia Pacific Food Hygiene Testing Industry Revenue Share (%), by Technology 2024 & 2032
- Figure 32: Asia Pacific Food Hygiene Testing Industry Revenue (Million), by Application 2024 & 2032
- Figure 33: Asia Pacific Food Hygiene Testing Industry Revenue Share (%), by Application 2024 & 2032
- Figure 34: Asia Pacific Food Hygiene Testing Industry Revenue (Million), by Country 2024 & 2032
- Figure 35: Asia Pacific Food Hygiene Testing Industry Revenue Share (%), by Country 2024 & 2032
- Figure 36: South America Food Hygiene Testing Industry Revenue (Million), by Contaminant Testing 2024 & 2032
- Figure 37: South America Food Hygiene Testing Industry Revenue Share (%), by Contaminant Testing 2024 & 2032
- Figure 38: South America Food Hygiene Testing Industry Revenue (Million), by Technology 2024 & 2032
- Figure 39: South America Food Hygiene Testing Industry Revenue Share (%), by Technology 2024 & 2032
- Figure 40: South America Food Hygiene Testing Industry Revenue (Million), by Application 2024 & 2032
- Figure 41: South America Food Hygiene Testing Industry Revenue Share (%), by Application 2024 & 2032
- Figure 42: South America Food Hygiene Testing Industry Revenue (Million), by Country 2024 & 2032
- Figure 43: South America Food Hygiene Testing Industry Revenue Share (%), by Country 2024 & 2032
- Figure 44: Middle East Food Hygiene Testing Industry Revenue (Million), by Contaminant Testing 2024 & 2032
- Figure 45: Middle East Food Hygiene Testing Industry Revenue Share (%), by Contaminant Testing 2024 & 2032
- Figure 46: Middle East Food Hygiene Testing Industry Revenue (Million), by Technology 2024 & 2032
- Figure 47: Middle East Food Hygiene Testing Industry Revenue Share (%), by Technology 2024 & 2032
- Figure 48: Middle East Food Hygiene Testing Industry Revenue (Million), by Application 2024 & 2032
- Figure 49: Middle East Food Hygiene Testing Industry Revenue Share (%), by Application 2024 & 2032
- Figure 50: Middle East Food Hygiene Testing Industry Revenue (Million), by Country 2024 & 2032
- Figure 51: Middle East Food Hygiene Testing Industry Revenue Share (%), by Country 2024 & 2032
- Figure 52: South Africa Food Hygiene Testing Industry Revenue (Million), by Contaminant Testing 2024 & 2032
- Figure 53: South Africa Food Hygiene Testing Industry Revenue Share (%), by Contaminant Testing 2024 & 2032
- Figure 54: South Africa Food Hygiene Testing Industry Revenue (Million), by Technology 2024 & 2032
- Figure 55: South Africa Food Hygiene Testing Industry Revenue Share (%), by Technology 2024 & 2032
- Figure 56: South Africa Food Hygiene Testing Industry Revenue (Million), by Application 2024 & 2032
- Figure 57: South Africa Food Hygiene Testing Industry Revenue Share (%), by Application 2024 & 2032
- Figure 58: South Africa Food Hygiene Testing Industry Revenue (Million), by Country 2024 & 2032
- Figure 59: South Africa Food Hygiene Testing Industry Revenue Share (%), by Country 2024 & 2032
List of Tables
- Table 1: Global Food Hygiene Testing Industry Revenue Million Forecast, by Region 2019 & 2032
- Table 2: Global Food Hygiene Testing Industry Revenue Million Forecast, by Contaminant Testing 2019 & 2032
- Table 3: Global Food Hygiene Testing Industry Revenue Million Forecast, by Technology 2019 & 2032
- Table 4: Global Food Hygiene Testing Industry Revenue Million Forecast, by Application 2019 & 2032
- Table 5: Global Food Hygiene Testing Industry Revenue Million Forecast, by Region 2019 & 2032
- Table 6: Global Food Hygiene Testing Industry Revenue Million Forecast, by Country 2019 & 2032
- Table 7: United States Food Hygiene Testing Industry Revenue (Million) Forecast, by Application 2019 & 2032
- Table 8: Canada Food Hygiene Testing Industry Revenue (Million) Forecast, by Application 2019 & 2032
- Table 9: Mexico Food Hygiene Testing Industry Revenue (Million) Forecast, by Application 2019 & 2032
- Table 10: Rest of North America Food Hygiene Testing Industry Revenue (Million) Forecast, by Application 2019 & 2032
- Table 11: Global Food Hygiene Testing Industry Revenue Million Forecast, by Country 2019 & 2032
- Table 12: United Kingdom Food Hygiene Testing Industry Revenue (Million) Forecast, by Application 2019 & 2032
- Table 13: Germany Food Hygiene Testing Industry Revenue (Million) Forecast, by Application 2019 & 2032
- Table 14: France Food Hygiene Testing Industry Revenue (Million) Forecast, by Application 2019 & 2032
- Table 15: Russia Food Hygiene Testing Industry Revenue (Million) Forecast, by Application 2019 & 2032
- Table 16: Italy Food Hygiene Testing Industry Revenue (Million) Forecast, by Application 2019 & 2032
- Table 17: Spain Food Hygiene Testing Industry Revenue (Million) Forecast, by Application 2019 & 2032
- Table 18: Rest of Europe Food Hygiene Testing Industry Revenue (Million) Forecast, by Application 2019 & 2032
- Table 19: Global Food Hygiene Testing Industry Revenue Million Forecast, by Country 2019 & 2032
- Table 20: India Food Hygiene Testing Industry Revenue (Million) Forecast, by Application 2019 & 2032
- Table 21: China Food Hygiene Testing Industry Revenue (Million) Forecast, by Application 2019 & 2032
- Table 22: Japan Food Hygiene Testing Industry Revenue (Million) Forecast, by Application 2019 & 2032
- Table 23: Australia Food Hygiene Testing Industry Revenue (Million) Forecast, by Application 2019 & 2032
- Table 24: Rest of Asia Pacific Food Hygiene Testing Industry Revenue (Million) Forecast, by Application 2019 & 2032
- Table 25: Global Food Hygiene Testing Industry Revenue Million Forecast, by Country 2019 & 2032
- Table 26: Brazil Food Hygiene Testing Industry Revenue (Million) Forecast, by Application 2019 & 2032
- Table 27: Argentina Food Hygiene Testing Industry Revenue (Million) Forecast, by Application 2019 & 2032
- Table 28: Rest of South America Food Hygiene Testing Industry Revenue (Million) Forecast, by Application 2019 & 2032
- Table 29: Global Food Hygiene Testing Industry Revenue Million Forecast, by Country 2019 & 2032
- Table 30: UAE Food Hygiene Testing Industry Revenue (Million) Forecast, by Application 2019 & 2032
- Table 31: South Africa Food Hygiene Testing Industry Revenue (Million) Forecast, by Application 2019 & 2032
- Table 32: Saudi Arabia Food Hygiene Testing Industry Revenue (Million) Forecast, by Application 2019 & 2032
- Table 33: Rest of MEA Food Hygiene Testing Industry Revenue (Million) Forecast, by Application 2019 & 2032
- Table 34: Global Food Hygiene Testing Industry Revenue Million Forecast, by Contaminant Testing 2019 & 2032
- Table 35: Global Food Hygiene Testing Industry Revenue Million Forecast, by Technology 2019 & 2032
- Table 36: Global Food Hygiene Testing Industry Revenue Million Forecast, by Application 2019 & 2032
- Table 37: Global Food Hygiene Testing Industry Revenue Million Forecast, by Country 2019 & 2032
- Table 38: United States Food Hygiene Testing Industry Revenue (Million) Forecast, by Application 2019 & 2032
- Table 39: Canada Food Hygiene Testing Industry Revenue (Million) Forecast, by Application 2019 & 2032
- Table 40: Mexico Food Hygiene Testing Industry Revenue (Million) Forecast, by Application 2019 & 2032
- Table 41: Rest of North America Food Hygiene Testing Industry Revenue (Million) Forecast, by Application 2019 & 2032
- Table 42: Global Food Hygiene Testing Industry Revenue Million Forecast, by Contaminant Testing 2019 & 2032
- Table 43: Global Food Hygiene Testing Industry Revenue Million Forecast, by Technology 2019 & 2032
- Table 44: Global Food Hygiene Testing Industry Revenue Million Forecast, by Application 2019 & 2032
- Table 45: Global Food Hygiene Testing Industry Revenue Million Forecast, by Country 2019 & 2032
- Table 46: United Kingdom Food Hygiene Testing Industry Revenue (Million) Forecast, by Application 2019 & 2032
- Table 47: Germany Food Hygiene Testing Industry Revenue (Million) Forecast, by Application 2019 & 2032
- Table 48: France Food Hygiene Testing Industry Revenue (Million) Forecast, by Application 2019 & 2032
- Table 49: Russia Food Hygiene Testing Industry Revenue (Million) Forecast, by Application 2019 & 2032
- Table 50: Italy Food Hygiene Testing Industry Revenue (Million) Forecast, by Application 2019 & 2032
- Table 51: Spain Food Hygiene Testing Industry Revenue (Million) Forecast, by Application 2019 & 2032
- Table 52: Rest of Europe Food Hygiene Testing Industry Revenue (Million) Forecast, by Application 2019 & 2032
- Table 53: Global Food Hygiene Testing Industry Revenue Million Forecast, by Contaminant Testing 2019 & 2032
- Table 54: Global Food Hygiene Testing Industry Revenue Million Forecast, by Technology 2019 & 2032
- Table 55: Global Food Hygiene Testing Industry Revenue Million Forecast, by Application 2019 & 2032
- Table 56: Global Food Hygiene Testing Industry Revenue Million Forecast, by Country 2019 & 2032
- Table 57: India Food Hygiene Testing Industry Revenue (Million) Forecast, by Application 2019 & 2032
- Table 58: China Food Hygiene Testing Industry Revenue (Million) Forecast, by Application 2019 & 2032
- Table 59: Japan Food Hygiene Testing Industry Revenue (Million) Forecast, by Application 2019 & 2032
- Table 60: Australia Food Hygiene Testing Industry Revenue (Million) Forecast, by Application 2019 & 2032
- Table 61: Rest of Asia Pacific Food Hygiene Testing Industry Revenue (Million) Forecast, by Application 2019 & 2032
- Table 62: Global Food Hygiene Testing Industry Revenue Million Forecast, by Contaminant Testing 2019 & 2032
- Table 63: Global Food Hygiene Testing Industry Revenue Million Forecast, by Technology 2019 & 2032
- Table 64: Global Food Hygiene Testing Industry Revenue Million Forecast, by Application 2019 & 2032
- Table 65: Global Food Hygiene Testing Industry Revenue Million Forecast, by Country 2019 & 2032
- Table 66: Brazil Food Hygiene Testing Industry Revenue (Million) Forecast, by Application 2019 & 2032
- Table 67: Argentina Food Hygiene Testing Industry Revenue (Million) Forecast, by Application 2019 & 2032
- Table 68: Rest of South America Food Hygiene Testing Industry Revenue (Million) Forecast, by Application 2019 & 2032
- Table 69: Global Food Hygiene Testing Industry Revenue Million Forecast, by Contaminant Testing 2019 & 2032
- Table 70: Global Food Hygiene Testing Industry Revenue Million Forecast, by Technology 2019 & 2032
- Table 71: Global Food Hygiene Testing Industry Revenue Million Forecast, by Application 2019 & 2032
- Table 72: Global Food Hygiene Testing Industry Revenue Million Forecast, by Country 2019 & 2032
- Table 73: Global Food Hygiene Testing Industry Revenue Million Forecast, by Contaminant Testing 2019 & 2032
- Table 74: Global Food Hygiene Testing Industry Revenue Million Forecast, by Technology 2019 & 2032
- Table 75: Global Food Hygiene Testing Industry Revenue Million Forecast, by Application 2019 & 2032
- Table 76: Global Food Hygiene Testing Industry Revenue Million Forecast, by Country 2019 & 2032
- Table 77: Saudi Arabia Food Hygiene Testing Industry Revenue (Million) Forecast, by Application 2019 & 2032
- Table 78: Rest of Middle East Food Hygiene Testing Industry Revenue (Million) Forecast, by Application 2019 & 2032
Frequently Asked Questions
1. What is the projected Compound Annual Growth Rate (CAGR) of the Food Hygiene Testing Industry?
The projected CAGR is approximately 7.43%.
2. Which companies are prominent players in the Food Hygiene Testing Industry?
Key companies in the market include Intertek Group PLC, UL LLC*List Not Exhaustive, SGS GROUP, NSF International, Eurofins Scientific, Merieux Nutrisciences, ALS Limited, Asurequality Limited, TUV SUD.
3. What are the main segments of the Food Hygiene Testing Industry?
The market segments include Contaminant Testing, Technology, Application.
4. Can you provide details about the market size?
The market size is estimated to be USD 23.58 Million as of 2022.
5. What are some drivers contributing to market growth?
Growing Demand for Convenience and Processed Foods Drives Demand; Expanding Cosmetic and Personal Care Industries Utilize Gelatin for Various Purposes.
6. What are the notable trends driving market growth?
Growing Consumer Interest in Food Safety and Quality.
7. Are there any restraints impacting market growth?
Fluctuations in Raw Material Proces Affecting Production Costs.
8. Can you provide examples of recent developments in the market?
July 2022: SGS launched a new food analysis laboratory in Mexico. The new Naucalpan laboratory will support the Mexican food industry, assisting organizations with quality control and regulatory compliance.
9. What pricing options are available for accessing the report?
Pricing options include single-user, multi-user, and enterprise licenses priced at USD 4750, USD 5250, and USD 8750 respectively.
10. Is the market size provided in terms of value or volume?
The market size is provided in terms of value, measured in Million.
11. Are there any specific market keywords associated with the report?
Yes, the market keyword associated with the report is "Food Hygiene Testing Industry," which aids in identifying and referencing the specific market segment covered.
12. How do I determine which pricing option suits my needs best?
The pricing options vary based on user requirements and access needs. Individual users may opt for single-user licenses, while businesses requiring broader access may choose multi-user or enterprise licenses for cost-effective access to the report.
13. Are there any additional resources or data provided in the Food Hygiene Testing Industry report?
While the report offers comprehensive insights, it's advisable to review the specific contents or supplementary materials provided to ascertain if additional resources or data are available.
14. How can I stay updated on further developments or reports in the Food Hygiene Testing Industry?
To stay informed about further developments, trends, and reports in the Food Hygiene Testing Industry, consider subscribing to industry newsletters, following relevant companies and organizations, or regularly checking reputable industry news sources and publications.
Methodology
Step 1 - Identification of Relevant Samples Size from Population Database


Step 2 - Approaches for Defining Global Market Size (Value, Volume* & Price*)

Note*: In applicable scenarios
Step 3 - Data Sources
Primary Research
- Web Analytics
- Survey Reports
- Research Institute
- Latest Research Reports
- Opinion Leaders
Secondary Research
- Annual Reports
- White Paper
- Latest Press Release
- Industry Association
- Paid Database
- Investor Presentations

Step 4 - Data Triangulation
Involves using different sources of information in order to increase the validity of a study
These sources are likely to be stakeholders in a program - participants, other researchers, program staff, other community members, and so on.
Then we put all data in single framework & apply various statistical tools to find out the dynamic on the market.
During the analysis stage, feedback from the stakeholder groups would be compared to determine areas of agreement as well as areas of divergence


