
Key Insights
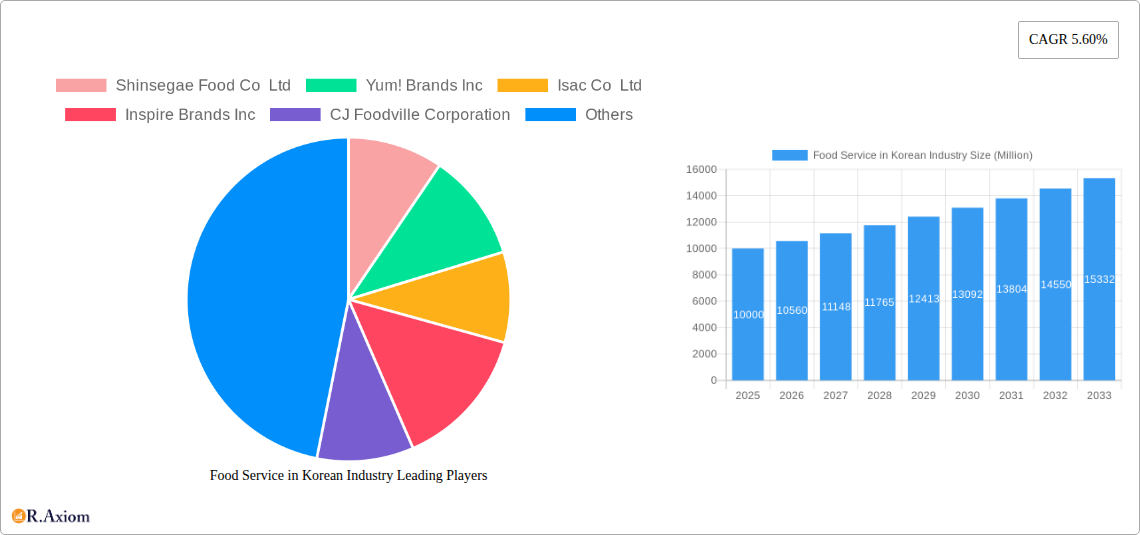
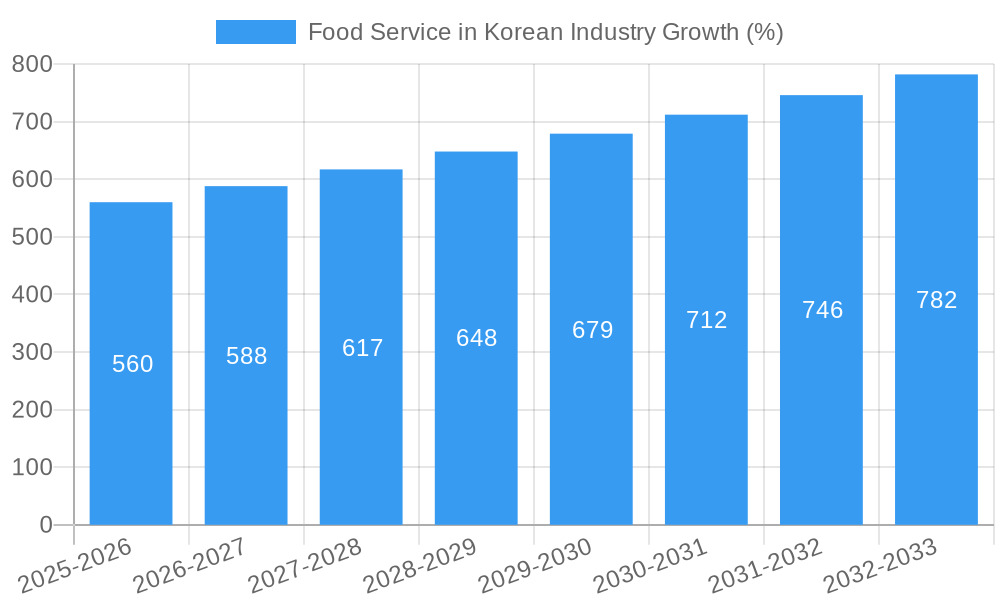
The South Korean food service industry, boasting a 5.60% CAGR (2019-2024), reveals a dynamic market landscape shaped by evolving consumer preferences and competitive pressures. The market's segmentation highlights the prominence of chained outlets within the QSR (Quick Service Restaurant) sector, particularly those offering diverse cuisines beyond traditional Korean fare. Location-wise, retail and standalone outlets dominate, suggesting a strong presence in high-traffic areas and independent establishments catering to local demand. Key players like Shinsegae Food Co Ltd, CJ Foodville Corporation, and McDonald's Corporation are driving market growth through strategic expansions, menu innovations, and brand loyalty programs. The industry's success is fueled by factors such as rising disposable incomes, a growing young population embracing diverse culinary experiences, and increasing urbanization. However, challenges persist, including increasing labor costs, intense competition, and the need to adapt to evolving consumer health consciousness. The forecast period (2025-2033) is expected to see continued growth, driven by technological advancements in ordering and delivery systems, and the ongoing popularity of convenient, high-quality food options. This will necessitate a focus on digital marketing strategies, efficient supply chain management, and a sustained commitment to product innovation to maintain a competitive edge. The industry is also likely to see a growing trend towards sustainability and ethical sourcing practices in response to increasing consumer demand for responsible consumption.
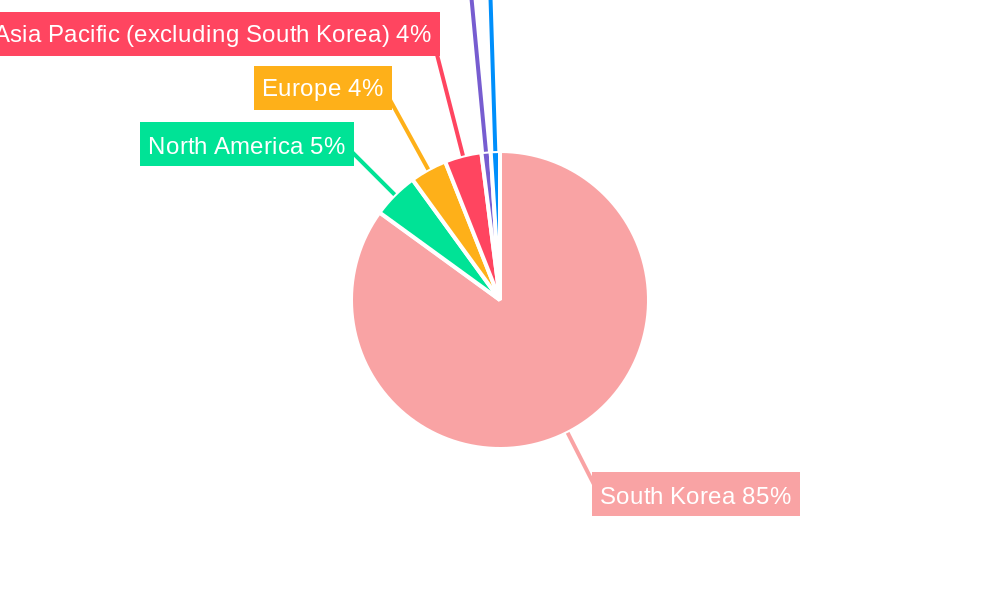
The regional distribution of the South Korean food service market likely shows a concentration within the domestic market, given the focus on Korean companies in the provided list. While the data includes a global regional breakdown, the market's core growth is strongly linked to the South Korean economy and its specific cultural and demographic trends. Expansion into international markets by some key players indicates growth potential beyond the domestic sphere, however the contribution of international markets to the overall market value is likely still comparatively smaller in the immediate future. This suggests a future strategy for established players focused on leveraging both domestic and international growth avenues. The long-term growth trajectory is projected to be positive, driven by consistent economic development and the sustained appeal of convenient and diverse food options.
Food Service in Korean Industry: A Comprehensive Market Report (2019-2033)
This in-depth report provides a comprehensive analysis of the South Korean food service industry, covering market size, segmentation, trends, competitive landscape, and future growth prospects. The study period spans from 2019 to 2033, with 2025 as the base and estimated year. The forecast period is 2025-2033, and the historical period is 2019-2024. The report offers actionable insights for industry stakeholders, including major players like Shinsegae Food Co Ltd, Yum! Brands Inc, and McDonald's Corporation. Expect detailed analysis across key segments: Other QSR Cuisines, Chained Outlets, Independent Outlets, Leisure, Lodging, Retail, Standalone, Travel locations, and Cafes & Bars foodservice types. The total market value is projected to reach xx Million by 2033.
Food Service in Korean Industry Market Concentration & Innovation
The South Korean food service market exhibits a concentrated landscape, with a few dominant players commanding significant market share. Key players like CJ Foodville Corporation and McDonald's Corporation hold substantial influence. The market share of the top five players in 2024 was estimated at xx%, indicating a moderately concentrated market. Innovation is driven by factors such as evolving consumer preferences, technological advancements (e.g., online ordering, delivery platforms), and the increasing popularity of diverse cuisines. Stringent food safety regulations and a competitive environment contribute to ongoing innovation. Mergers and acquisitions (M&A) activity has been significant, particularly in recent years. For instance, Yum! Brands Inc.’s acquisition of KFC Korea in March 2023 was valued at xx Million, showcasing a trend of consolidation and expansion within the sector.
- Market Concentration: Top 5 players hold xx% market share (2024).
- M&A Activity: Significant activity, exemplified by Yum! Brands Inc.'s KFC Korea acquisition (March 2023, xx Million).
- Innovation Drivers: Consumer preferences, technological advancements, regulatory frameworks.
- Regulatory Framework: Stringent food safety and hygiene regulations are in place.
- Product Substitutes: Home-cooked meals, meal delivery services, grocery store prepared foods.
- End-User Trends: Increasing demand for convenience, health-conscious options, and diverse culinary experiences.
Food Service in Korean Industry Industry Trends & Insights
The South Korean food service market is experiencing robust growth, driven by factors such as rising disposable incomes, increasing urbanization, and changing lifestyles. The market's Compound Annual Growth Rate (CAGR) during the historical period (2019-2024) was approximately xx%, and is projected to be xx% during the forecast period (2025-2033). Technological disruptions, such as the rise of online food delivery platforms and mobile ordering apps, are significantly impacting the industry. Consumer preferences are shifting towards healthier options, personalized experiences, and unique culinary offerings. Intense competition among established players and new entrants fuels innovation and expansion. Market penetration of online ordering is estimated at xx% in 2024, showing significant potential for future growth. The market is witnessing a growing trend towards premiumization, with consumers increasingly willing to pay more for higher-quality food and unique dining experiences.
Dominant Markets & Segments in Food Service in Korean Industry
The South Korean food service market is dominated by the Chained Outlets segment, driven by factors such as brand recognition, consistent quality, and convenience. Major metropolitan areas like Seoul and Busan exhibit higher market concentration.
- Dominant Segment: Chained Outlets
- Key Drivers:
- Economic Policies: Government support for the food service industry.
- Infrastructure: Well-developed transportation and logistics networks.
- Consumer Preferences: Demand for convenience, familiarity, and consistency.
- Regional Dominance: Seoul and Busan, due to higher population density and disposable incomes.
- Outlet Type: Chained outlets outpace independent outlets in terms of market share and growth.
- Location: Standalone locations hold the largest market share.
The Other QSR Cuisines segment is also showing strong growth due to increasing consumer interest in international flavors and experiences.
Food Service in Korean Industry Product Developments
Recent product innovations in the Korean food service industry focus on incorporating healthier ingredients, offering customized meals, and leveraging technology for enhanced convenience. Plant-based options, such as Shinsegae Food's Better Burger, are gaining traction, aligning with growing health consciousness. The integration of technology in ordering systems and delivery services is improving efficiency and customer experience. This reflects market trends toward customization and convenience.
Report Scope & Segmentation Analysis
This report segments the Korean food service market by cuisine type (Other QSR Cuisines), outlet type (Chained Outlets, Independent Outlets), location (Leisure, Lodging, Retail, Standalone, Travel), and foodservice type (Cafes & Bars). Each segment's growth projections, market size, and competitive dynamics are thoroughly analyzed. For example, the Chained Outlets segment is expected to maintain its dominance, while the Other QSR Cuisines segment is poised for significant growth.
Key Drivers of Food Service in Korean Industry Growth
The growth of the Korean food service industry is fueled by several factors: increasing disposable incomes and consumer spending, the rise of the urban population leading to higher demand for convenient food options, changing lifestyles, and preferences for diverse cuisines. Technological advancements like online ordering and delivery platforms are also contributing significantly to this growth. Government policies supporting the industry further facilitate expansion.
Challenges in the Food Service in Korean Industry Sector
Challenges faced by the Korean food service sector include increasing labor costs, intense competition, fluctuating raw material prices, and stringent food safety regulations. These factors influence operating margins and profitability. Supply chain disruptions caused by unforeseen events also pose a risk. The COVID-19 pandemic highlighted the vulnerability of the sector to external shocks.
Emerging Opportunities in Food Service in Korean Industry
Emerging opportunities include the rising demand for healthy and sustainable options, growing popularity of customized meal plans, and the increasing adoption of technology. Expansion into niche markets and internationalization are significant opportunities for growth. The development of innovative food delivery models further expands the market's potential.
Leading Players in the Food Service in Korean Industry Market
- Shinsegae Food Co Ltd
- Yum! Brands Inc
- Isac Co Ltd
- Inspire Brands Inc
- CJ Foodville Corporation
- Seven & I Holdings Co Ltd
- Kyochon Food&Beverage Co Ltd
- Doctor's Associate Inc
- MP DAESAN Inc
- Genesis Co Ltd
- Domino's Pizza Inc
- Starbucks Corporation
- Restaurant Brands International Inc
- Royal T Group Pte Ltd
- McDonald's Corporation
- Mom's Touch & Co
Key Developments in Food Service in Korean Industry Industry
- April 2023: Shinsegae Food launched the Better Burger, a 100% plant-based burger, reflecting the growing demand for vegan options.
- March 2023: Yum! Brands Inc. acquired KFC Korea Co., signifying consolidation within the QSR sector.
- February 2023: McDonald's Korea collaborated with NewJeans, a popular K-pop group, to launch a limited-edition meal, highlighting effective marketing strategies.
Strategic Outlook for Food Service in Korean Industry Market
The South Korean food service market is projected to experience sustained growth over the forecast period, driven by changing consumer preferences, technological advancements, and increasing disposable incomes. Companies focusing on innovation, digital transformation, and providing unique customer experiences are well-positioned for success. The market presents lucrative opportunities for both established players and new entrants, especially those catering to evolving health-conscious and experience-driven demands.
Food Service in Korean Industry Segmentation
-
1. Foodservice Type
-
1.1. Cafes & Bars
-
1.1.1. By Cuisine
- 1.1.1.1. Bars & Pubs
- 1.1.1.2. Juice/Smoothie/Desserts Bars
- 1.1.1.3. Specialist Coffee & Tea Shops
-
1.1.1. By Cuisine
- 1.2. Cloud Kitchen
-
1.3. Full Service Restaurants
- 1.3.1. Asian
- 1.3.2. European
- 1.3.3. Latin American
- 1.3.4. Middle Eastern
- 1.3.5. North American
- 1.3.6. Other FSR Cuisines
-
1.4. Quick Service Restaurants
- 1.4.1. Bakeries
- 1.4.2. Burger
- 1.4.3. Ice Cream
- 1.4.4. Meat-based Cuisines
- 1.4.5. Pizza
- 1.4.6. Other QSR Cuisines
-
1.1. Cafes & Bars
-
2. Outlet
- 2.1. Chained Outlets
- 2.2. Independent Outlets
-
3. Location
- 3.1. Leisure
- 3.2. Lodging
- 3.3. Retail
- 3.4. Standalone
- 3.5. Travel
Food Service in Korean Industry Segmentation By Geography
-
1. North America
- 1.1. United States
- 1.2. Canada
- 1.3. Mexico
-
2. South America
- 2.1. Brazil
- 2.2. Argentina
- 2.3. Rest of South America
-
3. Europe
- 3.1. United Kingdom
- 3.2. Germany
- 3.3. France
- 3.4. Italy
- 3.5. Spain
- 3.6. Russia
- 3.7. Benelux
- 3.8. Nordics
- 3.9. Rest of Europe
-
4. Middle East & Africa
- 4.1. Turkey
- 4.2. Israel
- 4.3. GCC
- 4.4. North Africa
- 4.5. South Africa
- 4.6. Rest of Middle East & Africa
-
5. Asia Pacific
- 5.1. China
- 5.2. India
- 5.3. Japan
- 5.4. South Korea
- 5.5. ASEAN
- 5.6. Oceania
- 5.7. Rest of Asia Pacific
Food Service in Korean Industry REPORT HIGHLIGHTS
| Aspects | Details |
|---|---|
| Study Period | 2019-2033 |
| Base Year | 2024 |
| Estimated Year | 2025 |
| Forecast Period | 2025-2033 |
| Historical Period | 2019-2024 |
| Growth Rate | CAGR of 5.60% from 2019-2033 |
| Segmentation |
|
Table of Contents
- 1. Introduction
- 1.1. Research Scope
- 1.2. Market Segmentation
- 1.3. Research Methodology
- 1.4. Definitions and Assumptions
- 2. Executive Summary
- 2.1. Introduction
- 3. Market Dynamics
- 3.1. Introduction
- 3.2. Market Drivers
- 3.2.1. Growing Demand for Cocoa Butter Equivalents Among Food Manufacturers; Rising Application in Food Industry
- 3.3. Market Restrains
- 3.3.1. Health Concerns Pertaining to the Excessive Consumption of Fats and Oils
- 3.4. Market Trends
- 3.4.1. High demand for traditional cuisines and increased spending on dining increase the sales
- 4. Market Factor Analysis
- 4.1. Porters Five Forces
- 4.2. Supply/Value Chain
- 4.3. PESTEL analysis
- 4.4. Market Entropy
- 4.5. Patent/Trademark Analysis
- 5. Global Food Service in Korean Industry Analysis, Insights and Forecast, 2019-2031
- 5.1. Market Analysis, Insights and Forecast - by Foodservice Type
- 5.1.1. Cafes & Bars
- 5.1.1.1. By Cuisine
- 5.1.1.1.1. Bars & Pubs
- 5.1.1.1.2. Juice/Smoothie/Desserts Bars
- 5.1.1.1.3. Specialist Coffee & Tea Shops
- 5.1.1.1. By Cuisine
- 5.1.2. Cloud Kitchen
- 5.1.3. Full Service Restaurants
- 5.1.3.1. Asian
- 5.1.3.2. European
- 5.1.3.3. Latin American
- 5.1.3.4. Middle Eastern
- 5.1.3.5. North American
- 5.1.3.6. Other FSR Cuisines
- 5.1.4. Quick Service Restaurants
- 5.1.4.1. Bakeries
- 5.1.4.2. Burger
- 5.1.4.3. Ice Cream
- 5.1.4.4. Meat-based Cuisines
- 5.1.4.5. Pizza
- 5.1.4.6. Other QSR Cuisines
- 5.1.1. Cafes & Bars
- 5.2. Market Analysis, Insights and Forecast - by Outlet
- 5.2.1. Chained Outlets
- 5.2.2. Independent Outlets
- 5.3. Market Analysis, Insights and Forecast - by Location
- 5.3.1. Leisure
- 5.3.2. Lodging
- 5.3.3. Retail
- 5.3.4. Standalone
- 5.3.5. Travel
- 5.4. Market Analysis, Insights and Forecast - by Region
- 5.4.1. North America
- 5.4.2. South America
- 5.4.3. Europe
- 5.4.4. Middle East & Africa
- 5.4.5. Asia Pacific
- 5.1. Market Analysis, Insights and Forecast - by Foodservice Type
- 6. North America Food Service in Korean Industry Analysis, Insights and Forecast, 2019-2031
- 6.1. Market Analysis, Insights and Forecast - by Foodservice Type
- 6.1.1. Cafes & Bars
- 6.1.1.1. By Cuisine
- 6.1.1.1.1. Bars & Pubs
- 6.1.1.1.2. Juice/Smoothie/Desserts Bars
- 6.1.1.1.3. Specialist Coffee & Tea Shops
- 6.1.1.1. By Cuisine
- 6.1.2. Cloud Kitchen
- 6.1.3. Full Service Restaurants
- 6.1.3.1. Asian
- 6.1.3.2. European
- 6.1.3.3. Latin American
- 6.1.3.4. Middle Eastern
- 6.1.3.5. North American
- 6.1.3.6. Other FSR Cuisines
- 6.1.4. Quick Service Restaurants
- 6.1.4.1. Bakeries
- 6.1.4.2. Burger
- 6.1.4.3. Ice Cream
- 6.1.4.4. Meat-based Cuisines
- 6.1.4.5. Pizza
- 6.1.4.6. Other QSR Cuisines
- 6.1.1. Cafes & Bars
- 6.2. Market Analysis, Insights and Forecast - by Outlet
- 6.2.1. Chained Outlets
- 6.2.2. Independent Outlets
- 6.3. Market Analysis, Insights and Forecast - by Location
- 6.3.1. Leisure
- 6.3.2. Lodging
- 6.3.3. Retail
- 6.3.4. Standalone
- 6.3.5. Travel
- 6.1. Market Analysis, Insights and Forecast - by Foodservice Type
- 7. South America Food Service in Korean Industry Analysis, Insights and Forecast, 2019-2031
- 7.1. Market Analysis, Insights and Forecast - by Foodservice Type
- 7.1.1. Cafes & Bars
- 7.1.1.1. By Cuisine
- 7.1.1.1.1. Bars & Pubs
- 7.1.1.1.2. Juice/Smoothie/Desserts Bars
- 7.1.1.1.3. Specialist Coffee & Tea Shops
- 7.1.1.1. By Cuisine
- 7.1.2. Cloud Kitchen
- 7.1.3. Full Service Restaurants
- 7.1.3.1. Asian
- 7.1.3.2. European
- 7.1.3.3. Latin American
- 7.1.3.4. Middle Eastern
- 7.1.3.5. North American
- 7.1.3.6. Other FSR Cuisines
- 7.1.4. Quick Service Restaurants
- 7.1.4.1. Bakeries
- 7.1.4.2. Burger
- 7.1.4.3. Ice Cream
- 7.1.4.4. Meat-based Cuisines
- 7.1.4.5. Pizza
- 7.1.4.6. Other QSR Cuisines
- 7.1.1. Cafes & Bars
- 7.2. Market Analysis, Insights and Forecast - by Outlet
- 7.2.1. Chained Outlets
- 7.2.2. Independent Outlets
- 7.3. Market Analysis, Insights and Forecast - by Location
- 7.3.1. Leisure
- 7.3.2. Lodging
- 7.3.3. Retail
- 7.3.4. Standalone
- 7.3.5. Travel
- 7.1. Market Analysis, Insights and Forecast - by Foodservice Type
- 8. Europe Food Service in Korean Industry Analysis, Insights and Forecast, 2019-2031
- 8.1. Market Analysis, Insights and Forecast - by Foodservice Type
- 8.1.1. Cafes & Bars
- 8.1.1.1. By Cuisine
- 8.1.1.1.1. Bars & Pubs
- 8.1.1.1.2. Juice/Smoothie/Desserts Bars
- 8.1.1.1.3. Specialist Coffee & Tea Shops
- 8.1.1.1. By Cuisine
- 8.1.2. Cloud Kitchen
- 8.1.3. Full Service Restaurants
- 8.1.3.1. Asian
- 8.1.3.2. European
- 8.1.3.3. Latin American
- 8.1.3.4. Middle Eastern
- 8.1.3.5. North American
- 8.1.3.6. Other FSR Cuisines
- 8.1.4. Quick Service Restaurants
- 8.1.4.1. Bakeries
- 8.1.4.2. Burger
- 8.1.4.3. Ice Cream
- 8.1.4.4. Meat-based Cuisines
- 8.1.4.5. Pizza
- 8.1.4.6. Other QSR Cuisines
- 8.1.1. Cafes & Bars
- 8.2. Market Analysis, Insights and Forecast - by Outlet
- 8.2.1. Chained Outlets
- 8.2.2. Independent Outlets
- 8.3. Market Analysis, Insights and Forecast - by Location
- 8.3.1. Leisure
- 8.3.2. Lodging
- 8.3.3. Retail
- 8.3.4. Standalone
- 8.3.5. Travel
- 8.1. Market Analysis, Insights and Forecast - by Foodservice Type
- 9. Middle East & Africa Food Service in Korean Industry Analysis, Insights and Forecast, 2019-2031
- 9.1. Market Analysis, Insights and Forecast - by Foodservice Type
- 9.1.1. Cafes & Bars
- 9.1.1.1. By Cuisine
- 9.1.1.1.1. Bars & Pubs
- 9.1.1.1.2. Juice/Smoothie/Desserts Bars
- 9.1.1.1.3. Specialist Coffee & Tea Shops
- 9.1.1.1. By Cuisine
- 9.1.2. Cloud Kitchen
- 9.1.3. Full Service Restaurants
- 9.1.3.1. Asian
- 9.1.3.2. European
- 9.1.3.3. Latin American
- 9.1.3.4. Middle Eastern
- 9.1.3.5. North American
- 9.1.3.6. Other FSR Cuisines
- 9.1.4. Quick Service Restaurants
- 9.1.4.1. Bakeries
- 9.1.4.2. Burger
- 9.1.4.3. Ice Cream
- 9.1.4.4. Meat-based Cuisines
- 9.1.4.5. Pizza
- 9.1.4.6. Other QSR Cuisines
- 9.1.1. Cafes & Bars
- 9.2. Market Analysis, Insights and Forecast - by Outlet
- 9.2.1. Chained Outlets
- 9.2.2. Independent Outlets
- 9.3. Market Analysis, Insights and Forecast - by Location
- 9.3.1. Leisure
- 9.3.2. Lodging
- 9.3.3. Retail
- 9.3.4. Standalone
- 9.3.5. Travel
- 9.1. Market Analysis, Insights and Forecast - by Foodservice Type
- 10. Asia Pacific Food Service in Korean Industry Analysis, Insights and Forecast, 2019-2031
- 10.1. Market Analysis, Insights and Forecast - by Foodservice Type
- 10.1.1. Cafes & Bars
- 10.1.1.1. By Cuisine
- 10.1.1.1.1. Bars & Pubs
- 10.1.1.1.2. Juice/Smoothie/Desserts Bars
- 10.1.1.1.3. Specialist Coffee & Tea Shops
- 10.1.1.1. By Cuisine
- 10.1.2. Cloud Kitchen
- 10.1.3. Full Service Restaurants
- 10.1.3.1. Asian
- 10.1.3.2. European
- 10.1.3.3. Latin American
- 10.1.3.4. Middle Eastern
- 10.1.3.5. North American
- 10.1.3.6. Other FSR Cuisines
- 10.1.4. Quick Service Restaurants
- 10.1.4.1. Bakeries
- 10.1.4.2. Burger
- 10.1.4.3. Ice Cream
- 10.1.4.4. Meat-based Cuisines
- 10.1.4.5. Pizza
- 10.1.4.6. Other QSR Cuisines
- 10.1.1. Cafes & Bars
- 10.2. Market Analysis, Insights and Forecast - by Outlet
- 10.2.1. Chained Outlets
- 10.2.2. Independent Outlets
- 10.3. Market Analysis, Insights and Forecast - by Location
- 10.3.1. Leisure
- 10.3.2. Lodging
- 10.3.3. Retail
- 10.3.4. Standalone
- 10.3.5. Travel
- 10.1. Market Analysis, Insights and Forecast - by Foodservice Type
- 11. North America Food Service in Korean Industry Analysis, Insights and Forecast, 2019-2031
- 11.1. Market Analysis, Insights and Forecast - By Country/Sub-region
- 11.1.1 United States
- 11.1.2 Canada
- 11.1.3 Mexico
- 11.1.4 Rest of North America
- 12. Europe Food Service in Korean Industry Analysis, Insights and Forecast, 2019-2031
- 12.1. Market Analysis, Insights and Forecast - By Country/Sub-region
- 12.1.1 Germany
- 12.1.2 United Kingdom
- 12.1.3 Italy
- 12.1.4 Spain
- 12.1.5 France
- 12.1.6 Russia
- 12.1.7 Rest of Europe
- 13. Asia Pacific Food Service in Korean Industry Analysis, Insights and Forecast, 2019-2031
- 13.1. Market Analysis, Insights and Forecast - By Country/Sub-region
- 13.1.1 China
- 13.1.2 Japan
- 13.1.3 India
- 13.1.4 Australia
- 13.1.5 Rest of Asia Pacific
- 14. South America Food Service in Korean Industry Analysis, Insights and Forecast, 2019-2031
- 14.1. Market Analysis, Insights and Forecast - By Country/Sub-region
- 14.1.1 Brazil
- 14.1.2 Argentina
- 14.1.3 Rest of South America
- 15. Middle East and Africa Food Service in Korean Industry Analysis, Insights and Forecast, 2019-2031
- 15.1. Market Analysis, Insights and Forecast - By Country/Sub-region
- 15.1.1 Saudi Arabia
- 15.1.2 South Africa
- 15.1.3 Rest of Middle East and Africa
- 16. Competitive Analysis
- 16.1. Global Market Share Analysis 2024
- 16.2. Company Profiles
- 16.2.1 Shinsegae Food Co Ltd
- 16.2.1.1. Overview
- 16.2.1.2. Products
- 16.2.1.3. SWOT Analysis
- 16.2.1.4. Recent Developments
- 16.2.1.5. Financials (Based on Availability)
- 16.2.2 Yum! Brands Inc
- 16.2.2.1. Overview
- 16.2.2.2. Products
- 16.2.2.3. SWOT Analysis
- 16.2.2.4. Recent Developments
- 16.2.2.5. Financials (Based on Availability)
- 16.2.3 Isac Co Ltd
- 16.2.3.1. Overview
- 16.2.3.2. Products
- 16.2.3.3. SWOT Analysis
- 16.2.3.4. Recent Developments
- 16.2.3.5. Financials (Based on Availability)
- 16.2.4 Inspire Brands Inc
- 16.2.4.1. Overview
- 16.2.4.2. Products
- 16.2.4.3. SWOT Analysis
- 16.2.4.4. Recent Developments
- 16.2.4.5. Financials (Based on Availability)
- 16.2.5 CJ Foodville Corporation
- 16.2.5.1. Overview
- 16.2.5.2. Products
- 16.2.5.3. SWOT Analysis
- 16.2.5.4. Recent Developments
- 16.2.5.5. Financials (Based on Availability)
- 16.2.6 Seven & I Holdings Co Ltd
- 16.2.6.1. Overview
- 16.2.6.2. Products
- 16.2.6.3. SWOT Analysis
- 16.2.6.4. Recent Developments
- 16.2.6.5. Financials (Based on Availability)
- 16.2.7 Kyochon Food&Beverage Co Ltd
- 16.2.7.1. Overview
- 16.2.7.2. Products
- 16.2.7.3. SWOT Analysis
- 16.2.7.4. Recent Developments
- 16.2.7.5. Financials (Based on Availability)
- 16.2.8 Doctor's Associate Inc
- 16.2.8.1. Overview
- 16.2.8.2. Products
- 16.2.8.3. SWOT Analysis
- 16.2.8.4. Recent Developments
- 16.2.8.5. Financials (Based on Availability)
- 16.2.9 MP DAESAN Inc
- 16.2.9.1. Overview
- 16.2.9.2. Products
- 16.2.9.3. SWOT Analysis
- 16.2.9.4. Recent Developments
- 16.2.9.5. Financials (Based on Availability)
- 16.2.10 Genesis Co Ltd
- 16.2.10.1. Overview
- 16.2.10.2. Products
- 16.2.10.3. SWOT Analysis
- 16.2.10.4. Recent Developments
- 16.2.10.5. Financials (Based on Availability)
- 16.2.11 Domino's Pizza Inc
- 16.2.11.1. Overview
- 16.2.11.2. Products
- 16.2.11.3. SWOT Analysis
- 16.2.11.4. Recent Developments
- 16.2.11.5. Financials (Based on Availability)
- 16.2.12 Starbucks Corporation
- 16.2.12.1. Overview
- 16.2.12.2. Products
- 16.2.12.3. SWOT Analysis
- 16.2.12.4. Recent Developments
- 16.2.12.5. Financials (Based on Availability)
- 16.2.13 Restaurant Brands International Inc
- 16.2.13.1. Overview
- 16.2.13.2. Products
- 16.2.13.3. SWOT Analysis
- 16.2.13.4. Recent Developments
- 16.2.13.5. Financials (Based on Availability)
- 16.2.14 Royal T Group Pte Ltd
- 16.2.14.1. Overview
- 16.2.14.2. Products
- 16.2.14.3. SWOT Analysis
- 16.2.14.4. Recent Developments
- 16.2.14.5. Financials (Based on Availability)
- 16.2.15 McDonald's Corporation
- 16.2.15.1. Overview
- 16.2.15.2. Products
- 16.2.15.3. SWOT Analysis
- 16.2.15.4. Recent Developments
- 16.2.15.5. Financials (Based on Availability)
- 16.2.16 Mom's Touch & Co
- 16.2.16.1. Overview
- 16.2.16.2. Products
- 16.2.16.3. SWOT Analysis
- 16.2.16.4. Recent Developments
- 16.2.16.5. Financials (Based on Availability)
- 16.2.1 Shinsegae Food Co Ltd
List of Figures
- Figure 1: Global Food Service in Korean Industry Revenue Breakdown (Million, %) by Region 2024 & 2032
- Figure 2: North America Food Service in Korean Industry Revenue (Million), by Country 2024 & 2032
- Figure 3: North America Food Service in Korean Industry Revenue Share (%), by Country 2024 & 2032
- Figure 4: Europe Food Service in Korean Industry Revenue (Million), by Country 2024 & 2032
- Figure 5: Europe Food Service in Korean Industry Revenue Share (%), by Country 2024 & 2032
- Figure 6: Asia Pacific Food Service in Korean Industry Revenue (Million), by Country 2024 & 2032
- Figure 7: Asia Pacific Food Service in Korean Industry Revenue Share (%), by Country 2024 & 2032
- Figure 8: South America Food Service in Korean Industry Revenue (Million), by Country 2024 & 2032
- Figure 9: South America Food Service in Korean Industry Revenue Share (%), by Country 2024 & 2032
- Figure 10: Middle East and Africa Food Service in Korean Industry Revenue (Million), by Country 2024 & 2032
- Figure 11: Middle East and Africa Food Service in Korean Industry Revenue Share (%), by Country 2024 & 2032
- Figure 12: North America Food Service in Korean Industry Revenue (Million), by Foodservice Type 2024 & 2032
- Figure 13: North America Food Service in Korean Industry Revenue Share (%), by Foodservice Type 2024 & 2032
- Figure 14: North America Food Service in Korean Industry Revenue (Million), by Outlet 2024 & 2032
- Figure 15: North America Food Service in Korean Industry Revenue Share (%), by Outlet 2024 & 2032
- Figure 16: North America Food Service in Korean Industry Revenue (Million), by Location 2024 & 2032
- Figure 17: North America Food Service in Korean Industry Revenue Share (%), by Location 2024 & 2032
- Figure 18: North America Food Service in Korean Industry Revenue (Million), by Country 2024 & 2032
- Figure 19: North America Food Service in Korean Industry Revenue Share (%), by Country 2024 & 2032
- Figure 20: South America Food Service in Korean Industry Revenue (Million), by Foodservice Type 2024 & 2032
- Figure 21: South America Food Service in Korean Industry Revenue Share (%), by Foodservice Type 2024 & 2032
- Figure 22: South America Food Service in Korean Industry Revenue (Million), by Outlet 2024 & 2032
- Figure 23: South America Food Service in Korean Industry Revenue Share (%), by Outlet 2024 & 2032
- Figure 24: South America Food Service in Korean Industry Revenue (Million), by Location 2024 & 2032
- Figure 25: South America Food Service in Korean Industry Revenue Share (%), by Location 2024 & 2032
- Figure 26: South America Food Service in Korean Industry Revenue (Million), by Country 2024 & 2032
- Figure 27: South America Food Service in Korean Industry Revenue Share (%), by Country 2024 & 2032
- Figure 28: Europe Food Service in Korean Industry Revenue (Million), by Foodservice Type 2024 & 2032
- Figure 29: Europe Food Service in Korean Industry Revenue Share (%), by Foodservice Type 2024 & 2032
- Figure 30: Europe Food Service in Korean Industry Revenue (Million), by Outlet 2024 & 2032
- Figure 31: Europe Food Service in Korean Industry Revenue Share (%), by Outlet 2024 & 2032
- Figure 32: Europe Food Service in Korean Industry Revenue (Million), by Location 2024 & 2032
- Figure 33: Europe Food Service in Korean Industry Revenue Share (%), by Location 2024 & 2032
- Figure 34: Europe Food Service in Korean Industry Revenue (Million), by Country 2024 & 2032
- Figure 35: Europe Food Service in Korean Industry Revenue Share (%), by Country 2024 & 2032
- Figure 36: Middle East & Africa Food Service in Korean Industry Revenue (Million), by Foodservice Type 2024 & 2032
- Figure 37: Middle East & Africa Food Service in Korean Industry Revenue Share (%), by Foodservice Type 2024 & 2032
- Figure 38: Middle East & Africa Food Service in Korean Industry Revenue (Million), by Outlet 2024 & 2032
- Figure 39: Middle East & Africa Food Service in Korean Industry Revenue Share (%), by Outlet 2024 & 2032
- Figure 40: Middle East & Africa Food Service in Korean Industry Revenue (Million), by Location 2024 & 2032
- Figure 41: Middle East & Africa Food Service in Korean Industry Revenue Share (%), by Location 2024 & 2032
- Figure 42: Middle East & Africa Food Service in Korean Industry Revenue (Million), by Country 2024 & 2032
- Figure 43: Middle East & Africa Food Service in Korean Industry Revenue Share (%), by Country 2024 & 2032
- Figure 44: Asia Pacific Food Service in Korean Industry Revenue (Million), by Foodservice Type 2024 & 2032
- Figure 45: Asia Pacific Food Service in Korean Industry Revenue Share (%), by Foodservice Type 2024 & 2032
- Figure 46: Asia Pacific Food Service in Korean Industry Revenue (Million), by Outlet 2024 & 2032
- Figure 47: Asia Pacific Food Service in Korean Industry Revenue Share (%), by Outlet 2024 & 2032
- Figure 48: Asia Pacific Food Service in Korean Industry Revenue (Million), by Location 2024 & 2032
- Figure 49: Asia Pacific Food Service in Korean Industry Revenue Share (%), by Location 2024 & 2032
- Figure 50: Asia Pacific Food Service in Korean Industry Revenue (Million), by Country 2024 & 2032
- Figure 51: Asia Pacific Food Service in Korean Industry Revenue Share (%), by Country 2024 & 2032
List of Tables
- Table 1: Global Food Service in Korean Industry Revenue Million Forecast, by Region 2019 & 2032
- Table 2: Global Food Service in Korean Industry Revenue Million Forecast, by Foodservice Type 2019 & 2032
- Table 3: Global Food Service in Korean Industry Revenue Million Forecast, by Outlet 2019 & 2032
- Table 4: Global Food Service in Korean Industry Revenue Million Forecast, by Location 2019 & 2032
- Table 5: Global Food Service in Korean Industry Revenue Million Forecast, by Region 2019 & 2032
- Table 6: Global Food Service in Korean Industry Revenue Million Forecast, by Country 2019 & 2032
- Table 7: United States Food Service in Korean Industry Revenue (Million) Forecast, by Application 2019 & 2032
- Table 8: Canada Food Service in Korean Industry Revenue (Million) Forecast, by Application 2019 & 2032
- Table 9: Mexico Food Service in Korean Industry Revenue (Million) Forecast, by Application 2019 & 2032
- Table 10: Rest of North America Food Service in Korean Industry Revenue (Million) Forecast, by Application 2019 & 2032
- Table 11: Global Food Service in Korean Industry Revenue Million Forecast, by Country 2019 & 2032
- Table 12: Germany Food Service in Korean Industry Revenue (Million) Forecast, by Application 2019 & 2032
- Table 13: United Kingdom Food Service in Korean Industry Revenue (Million) Forecast, by Application 2019 & 2032
- Table 14: Italy Food Service in Korean Industry Revenue (Million) Forecast, by Application 2019 & 2032
- Table 15: Spain Food Service in Korean Industry Revenue (Million) Forecast, by Application 2019 & 2032
- Table 16: France Food Service in Korean Industry Revenue (Million) Forecast, by Application 2019 & 2032
- Table 17: Russia Food Service in Korean Industry Revenue (Million) Forecast, by Application 2019 & 2032
- Table 18: Rest of Europe Food Service in Korean Industry Revenue (Million) Forecast, by Application 2019 & 2032
- Table 19: Global Food Service in Korean Industry Revenue Million Forecast, by Country 2019 & 2032
- Table 20: China Food Service in Korean Industry Revenue (Million) Forecast, by Application 2019 & 2032
- Table 21: Japan Food Service in Korean Industry Revenue (Million) Forecast, by Application 2019 & 2032
- Table 22: India Food Service in Korean Industry Revenue (Million) Forecast, by Application 2019 & 2032
- Table 23: Australia Food Service in Korean Industry Revenue (Million) Forecast, by Application 2019 & 2032
- Table 24: Rest of Asia Pacific Food Service in Korean Industry Revenue (Million) Forecast, by Application 2019 & 2032
- Table 25: Global Food Service in Korean Industry Revenue Million Forecast, by Country 2019 & 2032
- Table 26: Brazil Food Service in Korean Industry Revenue (Million) Forecast, by Application 2019 & 2032
- Table 27: Argentina Food Service in Korean Industry Revenue (Million) Forecast, by Application 2019 & 2032
- Table 28: Rest of South America Food Service in Korean Industry Revenue (Million) Forecast, by Application 2019 & 2032
- Table 29: Global Food Service in Korean Industry Revenue Million Forecast, by Country 2019 & 2032
- Table 30: Saudi Arabia Food Service in Korean Industry Revenue (Million) Forecast, by Application 2019 & 2032
- Table 31: South Africa Food Service in Korean Industry Revenue (Million) Forecast, by Application 2019 & 2032
- Table 32: Rest of Middle East and Africa Food Service in Korean Industry Revenue (Million) Forecast, by Application 2019 & 2032
- Table 33: Global Food Service in Korean Industry Revenue Million Forecast, by Foodservice Type 2019 & 2032
- Table 34: Global Food Service in Korean Industry Revenue Million Forecast, by Outlet 2019 & 2032
- Table 35: Global Food Service in Korean Industry Revenue Million Forecast, by Location 2019 & 2032
- Table 36: Global Food Service in Korean Industry Revenue Million Forecast, by Country 2019 & 2032
- Table 37: United States Food Service in Korean Industry Revenue (Million) Forecast, by Application 2019 & 2032
- Table 38: Canada Food Service in Korean Industry Revenue (Million) Forecast, by Application 2019 & 2032
- Table 39: Mexico Food Service in Korean Industry Revenue (Million) Forecast, by Application 2019 & 2032
- Table 40: Global Food Service in Korean Industry Revenue Million Forecast, by Foodservice Type 2019 & 2032
- Table 41: Global Food Service in Korean Industry Revenue Million Forecast, by Outlet 2019 & 2032
- Table 42: Global Food Service in Korean Industry Revenue Million Forecast, by Location 2019 & 2032
- Table 43: Global Food Service in Korean Industry Revenue Million Forecast, by Country 2019 & 2032
- Table 44: Brazil Food Service in Korean Industry Revenue (Million) Forecast, by Application 2019 & 2032
- Table 45: Argentina Food Service in Korean Industry Revenue (Million) Forecast, by Application 2019 & 2032
- Table 46: Rest of South America Food Service in Korean Industry Revenue (Million) Forecast, by Application 2019 & 2032
- Table 47: Global Food Service in Korean Industry Revenue Million Forecast, by Foodservice Type 2019 & 2032
- Table 48: Global Food Service in Korean Industry Revenue Million Forecast, by Outlet 2019 & 2032
- Table 49: Global Food Service in Korean Industry Revenue Million Forecast, by Location 2019 & 2032
- Table 50: Global Food Service in Korean Industry Revenue Million Forecast, by Country 2019 & 2032
- Table 51: United Kingdom Food Service in Korean Industry Revenue (Million) Forecast, by Application 2019 & 2032
- Table 52: Germany Food Service in Korean Industry Revenue (Million) Forecast, by Application 2019 & 2032
- Table 53: France Food Service in Korean Industry Revenue (Million) Forecast, by Application 2019 & 2032
- Table 54: Italy Food Service in Korean Industry Revenue (Million) Forecast, by Application 2019 & 2032
- Table 55: Spain Food Service in Korean Industry Revenue (Million) Forecast, by Application 2019 & 2032
- Table 56: Russia Food Service in Korean Industry Revenue (Million) Forecast, by Application 2019 & 2032
- Table 57: Benelux Food Service in Korean Industry Revenue (Million) Forecast, by Application 2019 & 2032
- Table 58: Nordics Food Service in Korean Industry Revenue (Million) Forecast, by Application 2019 & 2032
- Table 59: Rest of Europe Food Service in Korean Industry Revenue (Million) Forecast, by Application 2019 & 2032
- Table 60: Global Food Service in Korean Industry Revenue Million Forecast, by Foodservice Type 2019 & 2032
- Table 61: Global Food Service in Korean Industry Revenue Million Forecast, by Outlet 2019 & 2032
- Table 62: Global Food Service in Korean Industry Revenue Million Forecast, by Location 2019 & 2032
- Table 63: Global Food Service in Korean Industry Revenue Million Forecast, by Country 2019 & 2032
- Table 64: Turkey Food Service in Korean Industry Revenue (Million) Forecast, by Application 2019 & 2032
- Table 65: Israel Food Service in Korean Industry Revenue (Million) Forecast, by Application 2019 & 2032
- Table 66: GCC Food Service in Korean Industry Revenue (Million) Forecast, by Application 2019 & 2032
- Table 67: North Africa Food Service in Korean Industry Revenue (Million) Forecast, by Application 2019 & 2032
- Table 68: South Africa Food Service in Korean Industry Revenue (Million) Forecast, by Application 2019 & 2032
- Table 69: Rest of Middle East & Africa Food Service in Korean Industry Revenue (Million) Forecast, by Application 2019 & 2032
- Table 70: Global Food Service in Korean Industry Revenue Million Forecast, by Foodservice Type 2019 & 2032
- Table 71: Global Food Service in Korean Industry Revenue Million Forecast, by Outlet 2019 & 2032
- Table 72: Global Food Service in Korean Industry Revenue Million Forecast, by Location 2019 & 2032
- Table 73: Global Food Service in Korean Industry Revenue Million Forecast, by Country 2019 & 2032
- Table 74: China Food Service in Korean Industry Revenue (Million) Forecast, by Application 2019 & 2032
- Table 75: India Food Service in Korean Industry Revenue (Million) Forecast, by Application 2019 & 2032
- Table 76: Japan Food Service in Korean Industry Revenue (Million) Forecast, by Application 2019 & 2032
- Table 77: South Korea Food Service in Korean Industry Revenue (Million) Forecast, by Application 2019 & 2032
- Table 78: ASEAN Food Service in Korean Industry Revenue (Million) Forecast, by Application 2019 & 2032
- Table 79: Oceania Food Service in Korean Industry Revenue (Million) Forecast, by Application 2019 & 2032
- Table 80: Rest of Asia Pacific Food Service in Korean Industry Revenue (Million) Forecast, by Application 2019 & 2032
Frequently Asked Questions
1. What is the projected Compound Annual Growth Rate (CAGR) of the Food Service in Korean Industry?
The projected CAGR is approximately 5.60%.
2. Which companies are prominent players in the Food Service in Korean Industry?
Key companies in the market include Shinsegae Food Co Ltd, Yum! Brands Inc, Isac Co Ltd, Inspire Brands Inc, CJ Foodville Corporation, Seven & I Holdings Co Ltd, Kyochon Food&Beverage Co Ltd, Doctor's Associate Inc, MP DAESAN Inc, Genesis Co Ltd, Domino's Pizza Inc, Starbucks Corporation, Restaurant Brands International Inc, Royal T Group Pte Ltd, McDonald's Corporation, Mom's Touch & Co.
3. What are the main segments of the Food Service in Korean Industry?
The market segments include Foodservice Type, Outlet, Location.
4. Can you provide details about the market size?
The market size is estimated to be USD XX Million as of 2022.
5. What are some drivers contributing to market growth?
Growing Demand for Cocoa Butter Equivalents Among Food Manufacturers; Rising Application in Food Industry.
6. What are the notable trends driving market growth?
High demand for traditional cuisines and increased spending on dining increase the sales.
7. Are there any restraints impacting market growth?
Health Concerns Pertaining to the Excessive Consumption of Fats and Oils.
8. Can you provide examples of recent developments in the market?
April 2023: Shinsegae Food introduced a 100% plant-based burger called Better Burger. Instead of using animal products like milk and eggs, the burger uses substitute meat, cheese, and buns created from plant-based proteins like soybeans and cashew nuts.March 2023: Yum! Brands Inc. teamed up with a Korean private equity fund to acquire KFC Korea Co.February 2023: McDonald's Korea collaborated with NewJeans and introduced a special crispy chicken sandwich meal.
9. What pricing options are available for accessing the report?
Pricing options include single-user, multi-user, and enterprise licenses priced at USD 3800, USD 4500, and USD 5800 respectively.
10. Is the market size provided in terms of value or volume?
The market size is provided in terms of value, measured in Million.
11. Are there any specific market keywords associated with the report?
Yes, the market keyword associated with the report is "Food Service in Korean Industry," which aids in identifying and referencing the specific market segment covered.
12. How do I determine which pricing option suits my needs best?
The pricing options vary based on user requirements and access needs. Individual users may opt for single-user licenses, while businesses requiring broader access may choose multi-user or enterprise licenses for cost-effective access to the report.
13. Are there any additional resources or data provided in the Food Service in Korean Industry report?
While the report offers comprehensive insights, it's advisable to review the specific contents or supplementary materials provided to ascertain if additional resources or data are available.
14. How can I stay updated on further developments or reports in the Food Service in Korean Industry?
To stay informed about further developments, trends, and reports in the Food Service in Korean Industry, consider subscribing to industry newsletters, following relevant companies and organizations, or regularly checking reputable industry news sources and publications.
Methodology
Step 1 - Identification of Relevant Samples Size from Population Database


Step 2 - Approaches for Defining Global Market Size (Value, Volume* & Price*)

Note*: In applicable scenarios
Step 3 - Data Sources
Primary Research
- Web Analytics
- Survey Reports
- Research Institute
- Latest Research Reports
- Opinion Leaders
Secondary Research
- Annual Reports
- White Paper
- Latest Press Release
- Industry Association
- Paid Database
- Investor Presentations

Step 4 - Data Triangulation
Involves using different sources of information in order to increase the validity of a study
These sources are likely to be stakeholders in a program - participants, other researchers, program staff, other community members, and so on.
Then we put all data in single framework & apply various statistical tools to find out the dynamic on the market.
During the analysis stage, feedback from the stakeholder groups would be compared to determine areas of agreement as well as areas of divergence


